1316
Motion detection in spectroscopy using FID navigators1Center for Magnetic Resonance Research and Department of Radiology, University of Minnesota, Minneapolis, MN, United States, 2Advanced Clinical Imaging Technology, Siemens Healthcare AG, Lausanne, Switzerland, 3Department of Radiology, University Hospital (CHUV), Lausanne, Switzerland, 4LTS5, École Polytechnique Fédérale de Lausanne, Lausanne, Switzerland
Synopsis
A free induction decay navigator (FIDnav) was implemented in a spectroscopic sequence to identify motion-corrupted spectra for retrospective rejection. An optimal channel combination of a weighted sum of channels based on the magnitude of a localized water reference signal allowed for improved identification of motion events. The FID navigator successfully detected motion events in both phantom studies and in vivo for both single voxel spectroscopy (SVS) and 2D chemical shift imaging (CSI). Removal of the motion-corrupted data based on the FIDnav is demonstrated to show improved spectral quality.
Purpose
Magnetic resonance spectroscopy (MRS) is a non-invasive method for detecting and measuring metabolite concentrations in vivo. Subject motion and B0 inhomogeneity can significantly degrade spectral quality, especially at ultrahigh field strengths (i.e. ≥ 7 tesla). The ability to detect and remove/reacquire motion-corrupted data can potentially lead to an improvement in spectral quality. Free induction decay navigators (FIDnav) have been previously used in imaging studies to detect motion and trigger data rejection and reacquisition1,2. Moreover, navigators offer reliable motion detection with no additional hardware and minimal cost in scan time. Here we implement an FIDnav for use in spectroscopic acquisitions. Its use is demonstrated in phantoms and prostate studies at 7T.Methods
MRS experiments were conducted on a whole-body 7T research MRI system (Siemens, Erlangen, Germany) using a 16 channel loop-dipole body coil3 combined with a 2-channel solid endorectal coil4 (ERC). Spectroscopy was performed with semi-LASER5 (TR/TE 1900/70 ms) using VAPOR6 water suppression and MEGA7 lipid suppression. The FID navigator was inserted at the end of the readout and consisted of a non-localized small flip angle (9°) excitation followed by a brief readout of ~1 ms.
Experimental studies were performed in phantoms and in human volunteers. Subjects provided written signed consent to participate in an IRB approved protocol. Sampled volumes were shimmed using FASTMAP8. In phantom studies, a 10 mL Foley catheter placed next to a prostate phantom was used to simulate a gas bolus in the colon. In vivo, motion was induced in the form of gross arm motion, Valsalva maneuvers, and changes in breathing pattern and depth.
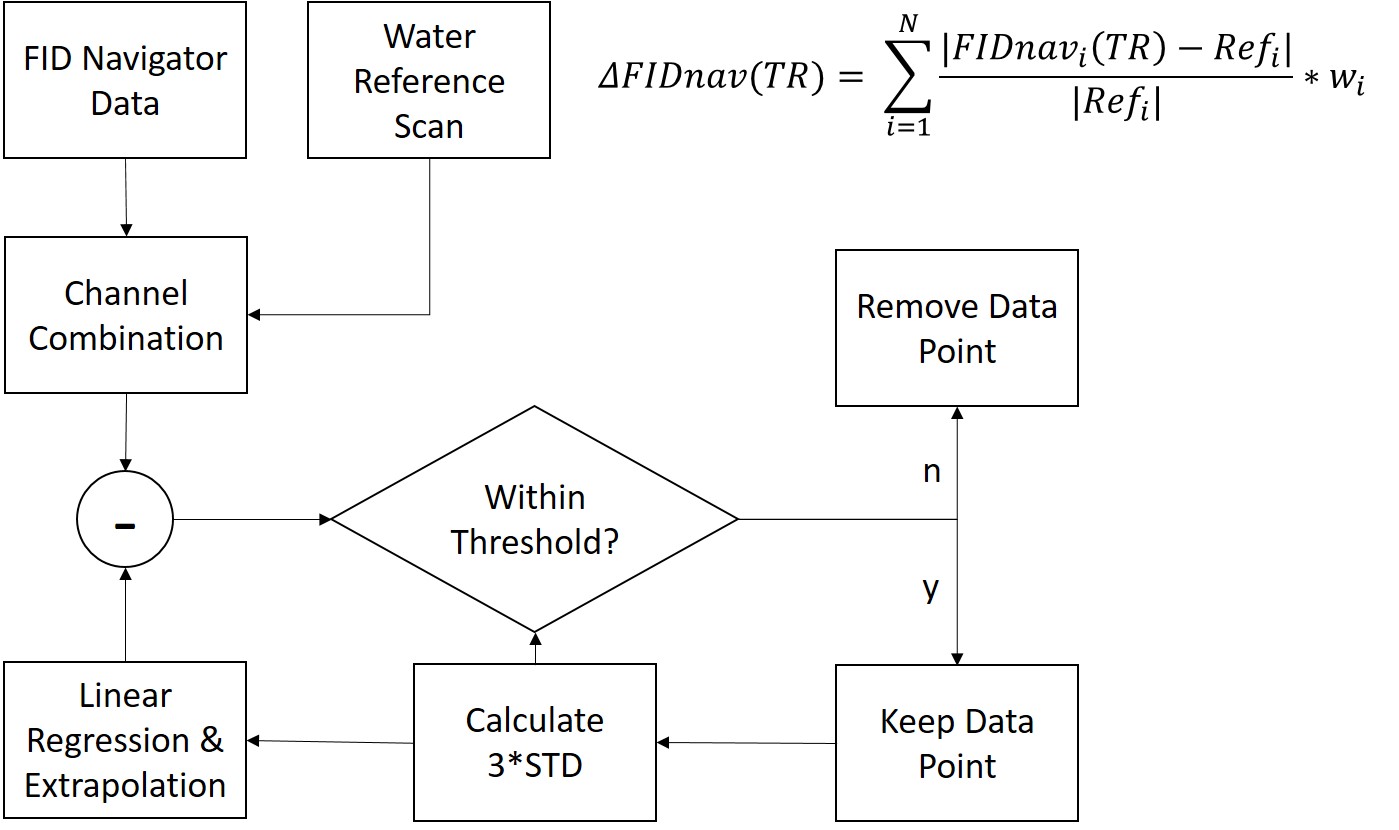
In the current implementation, the raw datasets were exported and processed offline with Matlab (Mathworks, Natick, MA). The first five timepoints were assumed free of motion and used to calculate a reference FIDnav signal. A percent change from the complex difference of the reference signal was calculated on a per-channel basis. Channel combinations of the difference signals were accomplished using a weighted sum based on the magnitudes of a semi-LASER localized water reference scan (Figure 1). A drift-corrected FIDnav signal was generated by subtracting the extrapolated linear regression from the combined FIDnav signal, and accepted FIDnav points were used to calculate the running standard deviation after baseline correction. Data identified as motion corrupted based on the specified threshold of 3 standard deviations were removed from the averaging. Spectra were reconstructed using the FIDnav to reject acquisitions classified as motion corrupted. The data were fitted in LCModel9 for analysis.
Results
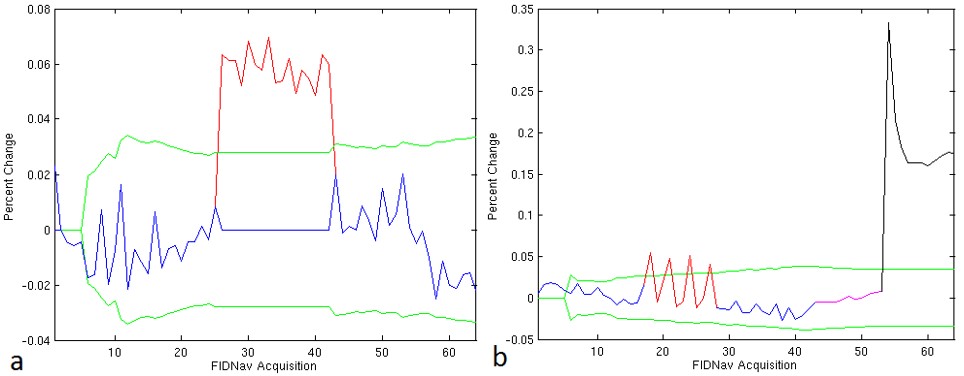
Induced magnitude and phase changes (i.e. motion events) were detected in phantom studies and in vivo as shown in Figure 2. Respiration was identified as the primary source of periodic baseline fluctuation in the navigator signal for in vivo experiments (Figure 2.b). A system-induced drift of the baseline, possibly due to thermal effects, is corrected for via a linear regression performed on all included points. An average correction of 1.36%/min (σ = 0.85%/min) was calculated with a maximum of 3.26%/min, which was imposed as the maximal slope of the linear regression. The proposed running threshold, 3 standard deviations over all corrected FIDnav points that were accepted, is reasonable to identify significant motion events.
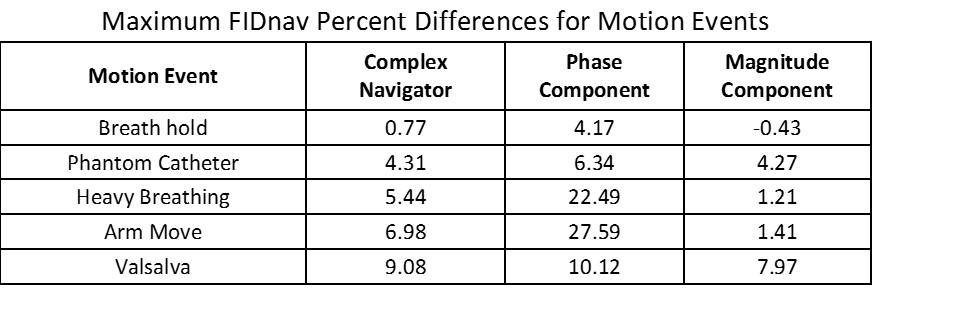
In order to understand the nature of the motion event on the navigator signal, each motion event was decomposed into a separate phase and magnitude component, as shown in Table 1. The final FIDnav signal is predominately dependent upon the magnitude component of the signal and is responsible for the baseline system drift. Motion events that do not produce gross motion of the ERC tend to change the phase more than the magnitude.
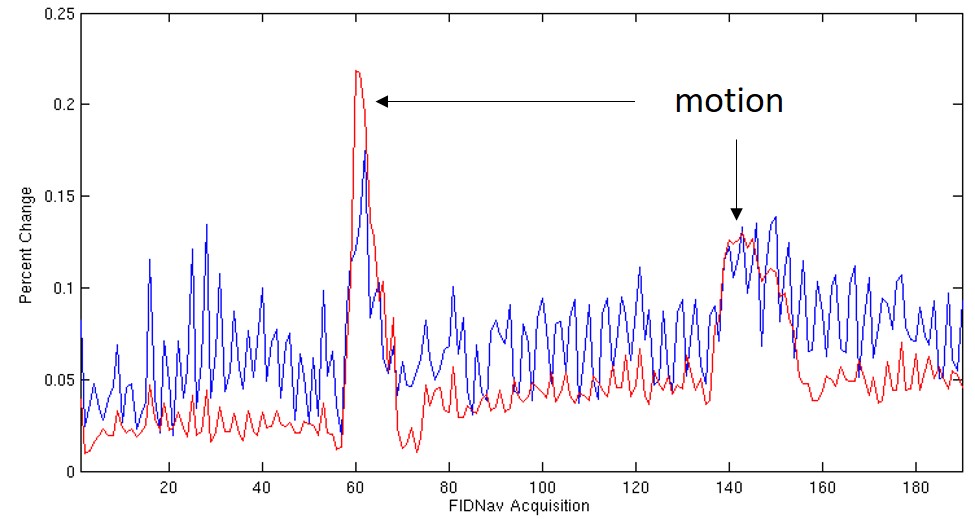
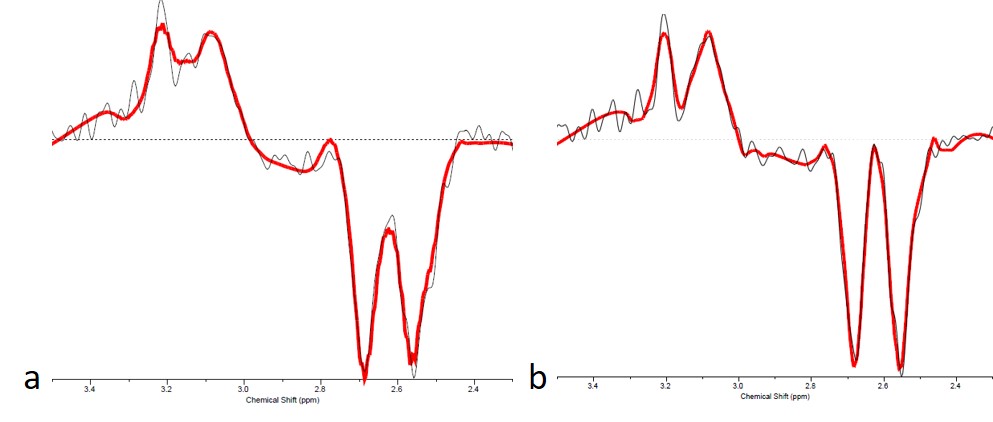
A comparison of the channel combination method described above and the traditional method1 of equally weighting channels is shown in Figure 3. By removing the motion corrupted data using the described methods resulted in improvements of both linewidth and line shape, shown in Figure 4.
Conclusions/Discussion
FID navigators were successfully implemented in a spectroscopic sequence to detect subject motion. With an appropriate threshold, motion corrupted data was removed resulting in improved spectral quality. The threshold most likely needs to be tailored for the combination of RF coil and anatomy being investigated. The weighted channel combination in this application with an ERC-provided localization of the otherwise non-localized signal to the region of the prostate greatly improves FIDnav signal specificity to motion affecting the target anatomy. While single voxel studies are demonstrated, the methods are being applied to spectroscopic imaging acquisitions where retrospective identification of corrupted data is not as trivial and where FIDnav triggered re-acquisition of data would be desired.Acknowledgements
Supported by: NCI R01 CA155268, NIBIB P41 EB015894.References
1. Kober, T., Marques, J. P., Gruetter, R. and Krueger, G. Head motion detection using FID navigators. Magn. Reson. Med., 2012, 66: 135–143.
2. Kober, T., J. P., Gruetter, R. and Krueger, G. Prospective and retrospective motion correction in diffusion magnetic resonance imaging of the human brain, NeuroImage, 2012, 59, 1, 389.
3. Ertürk, M. A., Raaijmakers, A. J. E., Adriany, G., Ugurbil, K. and Metzger, G. J., A 16-channel combined loop-dipole transceiver array for 7 Tesla body MRI. Magn. Reson. Med.., 2016, doi:10.1002/mrm.26153
4. Ertürk, M. A., Tian, J., Van de Moortele, P.-F., Adriany, G. and Metzger, G. J. (2016), Development and evaluation of a multichannel endorectal RF coil for prostate MRI at 7T in combination with an external surface array. J. Magn. Reson. Imaging, 2016, 43: 1279–1287.
5. Scheenen, T.W., A. Heerschap, and D.W. Klomp, Towards 1H-MRSI of the human brain at 7T with slice-selective adiabatic refocusing pulses. Magma, 2008. 21(1-2): p. 95-101.
6. Tkac, I., et al., In vivo 1H NMR spectroscopy of rat brain at 1 ms echo time. Magn Reson Med, 1999. 41(4): p. 649-56.
7. Mescher, M., et al., Simultaneous in vivo spectral editing and water suppression. NMR Biomed, 1998. 11(6): p. 266-72.
8. Marjanska M, Auerbach EJ, Valabrègue R, Van de Moortele P-F, Adriany G, Garwood M. Localized 1H NMR spectroscopy in different regions of human brain in vivo at 7 T: T2 relaxation times and concentrations of cerebral metabolites. NMR Biomed. 2012 Feb;25(2):332-9.
9. Provencher SW. Estimation of metabolite concentrations from localized in vivo proton NMR spectra. Magn Reson Med 1993;30: 672–679.
Figures