1307
Ultrasound Monitoring of a Respiratory Phantom for the Development andValidation of Segmented EPI Reconstruction Methods1Radiology, Brigham and Women's Hospital, Boston, MA, United States, 2Radiology, Massachusetts General Hospital, MA, United States, 3Harvard Medical School, Boston, MA, United States, 4Boston University, Boston, MA, United States, 5Dept. of Biomedical Engineering, Akdeniz University, Antalya, Turkey
Synopsis
In MRI, changes in lung volume can affect the static encoding field during brain imaging, inducing phase modulations in the acquired signal. In segmented EPI, these phase modulations manifest as ghost artifacts. To enable rapid development of new segmented EPI image formation methods, this work presents a respiratory phantom that can be monitored using an ultrasound transducer. Using inexpensive materials, the transducer tracks the thickness of a flexible water bottle as the respiratory phantom inflates/deflates. Results verify that phase changes induced by the changing air volume can be observed in both MR and ultrasound data, and are well correlated.
Introduction
fMRI data acquired using gradient-echo EPI typically employs single-shot sequences. This limits the achievable spatial resolution, particulary along the phase encode dimension. Segmented, or multi-shot, EPI sequences are one approach to improve spatial resolution, while maintaining an echo time appropriate for BOLD imaging. However, phase incoherence is common between multiple segments, which produce artifacts similar to Nyquist ghosting. This phase incoherence comes predominantly from two sources: hardware effects such as gradient miscallibration and eddy currents; and physiological motion. In particular, it was recently shown that respiratory activity can be a significant source of phase incoherence in fMRI data1, for changes in lung volume can modulate the primary encoding field when imaging the brain. For segmented EPI to be successful, methods to identify and correct for respiratory effects need to be developed. We present here a phantom setup to speed up development and testing of segmented EPI reconstruction methods.Methods
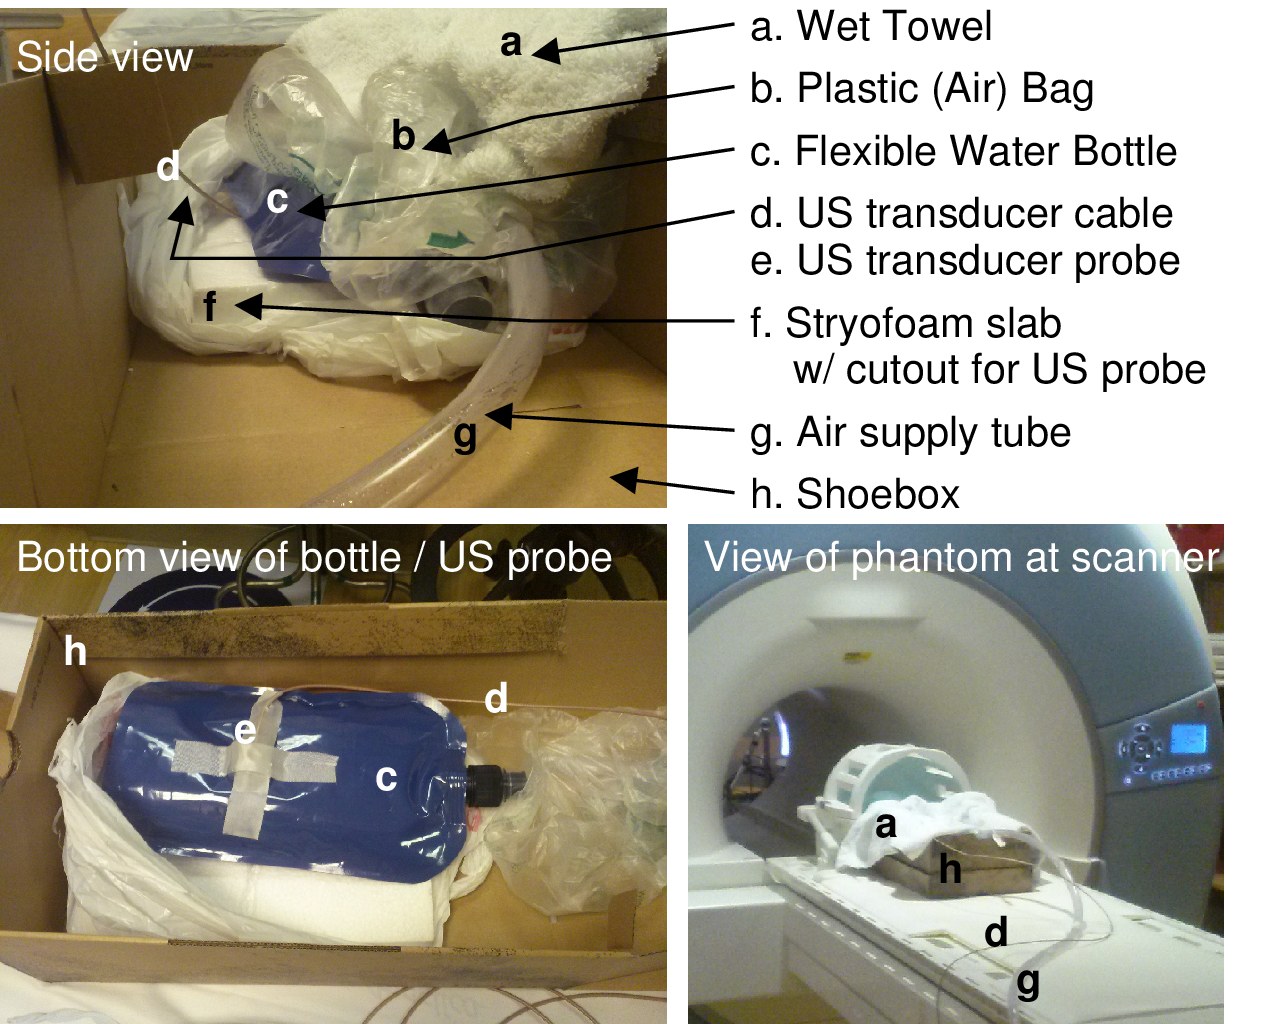
Our phantom is inspired by prior work by Khatamian, et al.1. That work employed a pair of plastic bags filled with air, covered by a wet towel to simulate the water content in the anterior chest wall. Changing the air volume in the bag physically changes the relative location of the wet towel in the A/P direction. This motion consequently induces phase changes in a spherical water-phantom placed at the magnet's iso-center. to this setup, we added components to measure motion in this respiratory phantom using ultrasound (US). A single-element US organ-motion configuration (OCM) transducer has been presented previously by Preiswerk, et al2 to track abdominal motion during thoracic MR data acquisition and synthetically generate MRI images at the temporal rate of the the US trigger (and MR readout). We employed the same ultrasound setup here. To couple the US transducer to the bag of air, we employed an partially (~80%) filled 1-liter flexible water bottle. When properly configured, inflating the bag with air would push down on the water bottle, decreasing the bottle's thickness during "phantom inspiration." When air was released from the bag, the water bottle returned to its original thickness. By attaching the ultrasound transducer under the water bottle, the thickness of the bottle could be monitored and recorded. The full phantom setup is shown in Fig 1.
To demonstrate the effect of this respiratory phantom, we acquired a single slice of EPI data from a spherical water-phantom placed within a 12-channel head coil in a Siemens 3T Trio MRI scanner. The slice data was measured at a TR of 60 msec, with a resolution of 128x128. Changes in air volume of the respiratory phantom induced changes in the B0 encoding field, producing an image-domain phase shift in the measured MRI signal. This phase shift was measured over time using a 2D phase-correlation approach3. Similarly, the relative shift of the measured time-domain US trace was measured by first isolating the strongest reflection in the recorded US signal and then measuring its relative change via phase correlation4.
Results
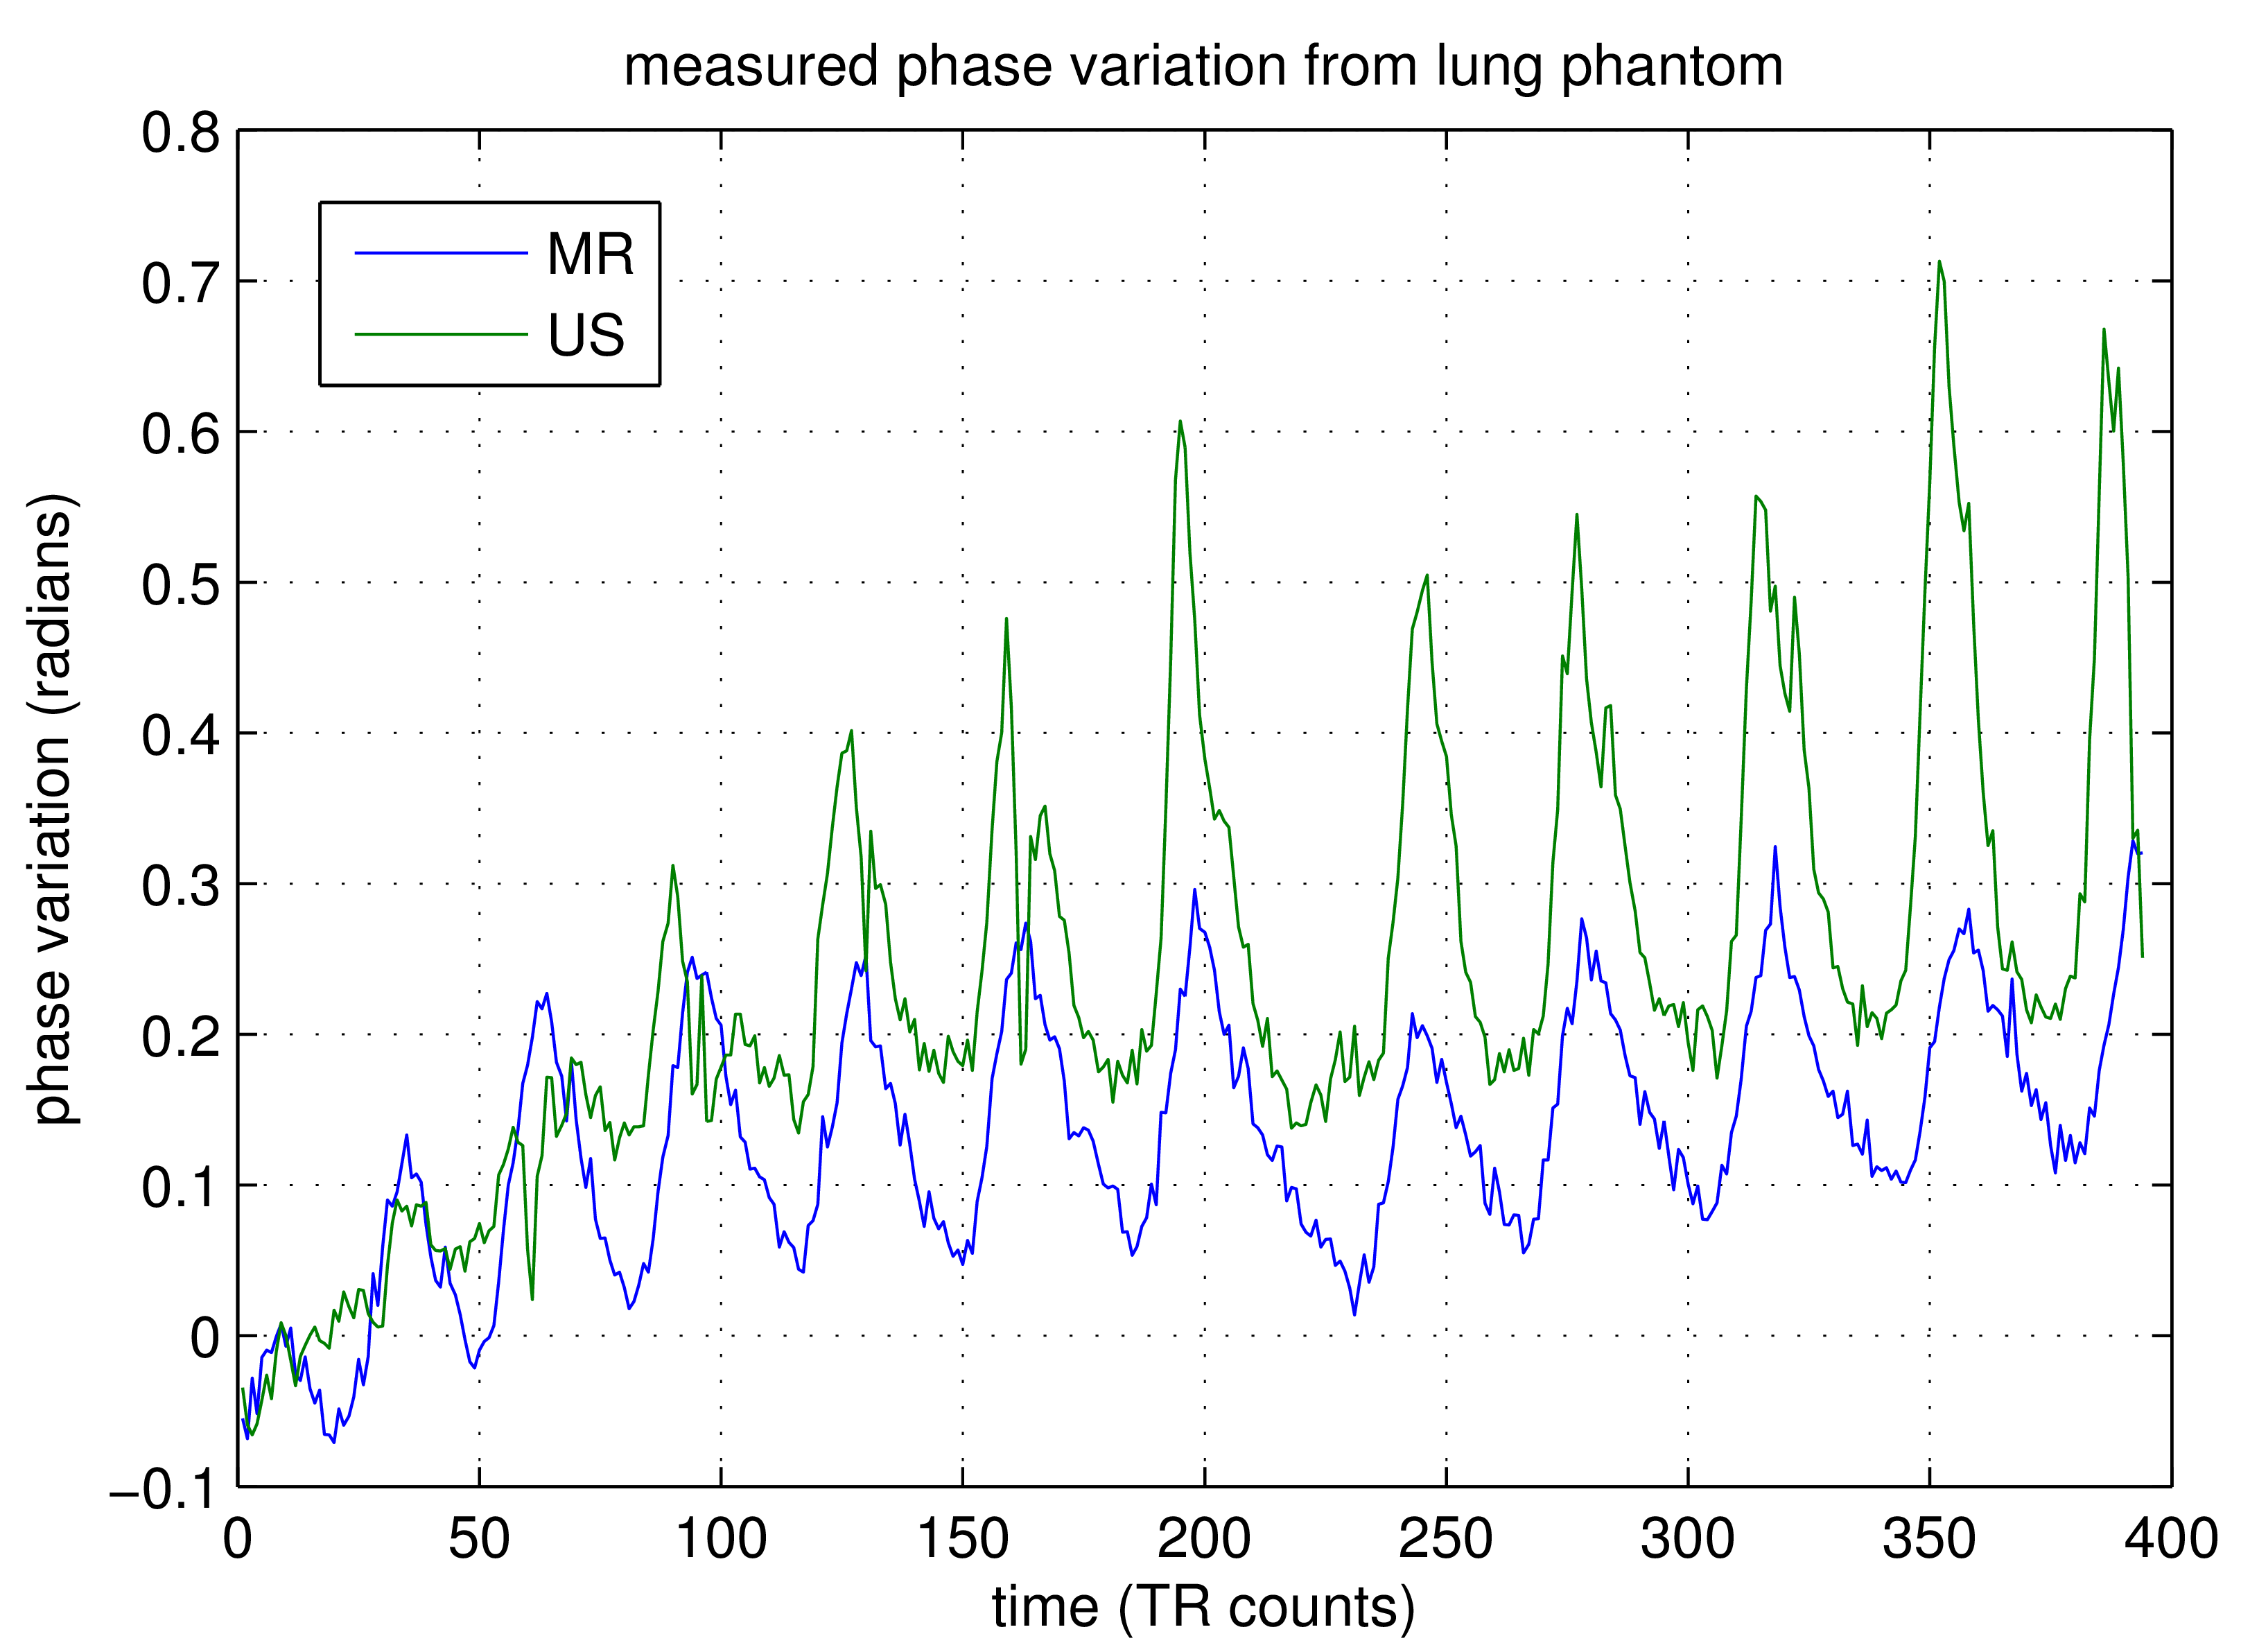
A plot from each of these signals, representing the relative phase change from both MR and US data sources, is shown in Fig 2. As evidenced in the plot, the two signals are strongly correlated over time, showing similar dynamics from the phantom motion with a sharp peak at each phantom inspiration and then a slow decay and recovery as air is released from the bag and then subsequently re-inflated.
Conclusion
This work demonstrates that (1) the described respiration phantom can successfully induce signal phase changes in a water phantom, confirming the results of Khatamian1 that simulate the effect of normal breathing on fMRI data acquisition, and (2) that this motion can be successfully monitored by employing ultrasound to track the effects of air volume changes in a respiratory phantom. We anticipate this phantom will enable rapid development and validation testing of reconstruction methods for acquisitions that are sensitive to phase changes---in particular 2D and 3D segmented EPI.
Acknowledgements
P41EB015898 and R01CA149342References
1. Khatamian Y, Faraji-Dana Z, Chen JJ. Significance and correction of respiratory off-resonance effects in fMRI - a phantom study. in Proc of Organization for Human Brain Mapping (OHBM). 2015; 1651.
2. Preiswerk F, Toews M, Cheng CC, Chiou JyG, Mei CS, Schaefer LF, Hoge WS, Schwartz BM, Panych LP, Madore B. Hybrid MRI ultrasound acquisitions, and scannerless real-time imaging. Magnetic Resonance in Medicine 2016; Early View.
3. Hoge WS. Subspace identification extension to the phase correlation method. IEEE Trans. on Medical Imaging 2003;22(2):277–280.
4. Kuglin CDK, Hines DC. The phase correlation image alignment method. in Proc. Int. Conf. on Cybernetics and Society. IEEE, 1975; 163–165.
Figures