1306
Impact of image registration on renal T1 mapping in children with chronic kidney diseaseFabio Nery1, Enrico De Vita2,3, Chris A. Clark1, Isky Gordon1, and David L. Thomas3
1UCL Great Ormond Street Institute of Child Health, Developmental Imaging and Biophysics Section, London, United Kingdom, 2National Hospital for Neurology and Neurosurgery, Lysholm Department of Neuroradiology;, 3UCL Institute of Neurology, Department of Brain Repair and Rehabilitation
Synopsis
Renal longitudinal relaxation time (T1) is an established indicator of pathophysiological tissue status. We have applied image registration techniques to correct for motion during saturation recovery (SR) acquisitions with multiple recovery times used for T1 mapping in kidneys of paediatric patients. All registration techniques were successful in improving the intra and inter-session repeatability of the T1 estimates, as well as the quality of the underlying saturation recovery fits on a challenging patient population, as assessed by intra- and inter-scan repeatability and analysis of the root mean squared error of the SR fits.
Introduction
Renal longitudinal relaxation time (T1) is an established indicator of pathophysiological tissue status [1], and is a required parameter for quantification of tissue perfusion using arterial spin labelling (ASL). Common approaches for T1 mapping include saturation recovery (SR) based methods, which are sensitive to subject motion due to the need to collect images at multiple recovery times. Motion correction strategies are therefore required to ensure accurate and reliable T1 mapping, particularly when applied to the abdomen.Purpose
To evaluate the impact of image-based rigid registration motion correction approaches on renal T1 mapping of paediatric patients with kidney disease (CKD).Methods
Eleven children with CKD (age 12±3) were scanned twice on a 1.5T Avanto scanner (Siemens Healthcare, Erlangen). The time between scans was 23±10 days. A SR sequence was used with 9 post-saturation delays (TD) (range: 100-2500ms; increment 300ms; saturation pulse spatially non-selective). The imaging module consisted of a single-shot 3D GRASE readout with main parameters matched to an accompanying ASL imaging module: matrix size 64x64x10, voxel size 4.5x4.5x6.0mm, Partial Fourier (factor 3/4), TR/TE=3000ms/31.54ms. Respiratory triggering was used to trigger the saturation pulse at end-expiration. Data acquisition was repeated up to 3 times in each session (dependent on patient tolerance) resulting in a total of 52 SR datasets (2 excluded due to extreme motion). These were fitted on a voxel-wise basis to generate T1 and M0 maps following three different pre-processing approaches: A - no image registration; B - “chain” registration, in which images were successively registered to the adjacent image in the SR time course, starting from the longest TD; C - “direct” registration, in which all images were directly registered to a target proton-density (PD) image. Approach B was implemented with the goal of minimizing contrast differences between the target and source image volumes throughout the recovery time series. 3D rigid body registrations were performed using elastix [2] with masks for independent registration of each kidney and a mutual information-based image similarity measure. For analysis, regions of interest (ROIs) in functional renal parenchyma were manually drawn on the PD/long TD images. The impact of the registration algorithms on the intra- and inter-session repeatability of the T1 estimates was evaluated using the intra-class correlation coefficient (ICC) and the within-subject coefficient of variation (WSCV). Furthermore, the quality of the underlying SR fits obtained following the different motion correction approaches was assessed employing the root mean squared error (RMSE) as a goodness of fit metric.Results and Discussion
Mean T1 values across the whole cohort obtained with approaches A, B and C were 1.89±0.31s, 1.66±0.26s and 1.62±0.20s, respectively. Examples of T1 maps in the ROIs obtained before and after applying the different registration methods are shown in Fig. 1. Significant statistical differences were found between the mean T1 values over all runs/days when comparing approaches A vs. B (p<0.05) and A vs. C (paired t-test p<0.005) but not when comparing the approaches B vs. C (paired t-test p=0.096). Both registration approaches improved the repeatability of the scans, with the “direct” registration method outperforming the “chain” method according to all repeatability measures (Fig. 2). Propagation of registration errors in the “chain” method introduced severe artefacts in the T1 map of one SR time series (approx. doubling the mean T1 in this scan). Therefore, repeatability indexes were computed for the full dataset and excluding this scan (Fig. 2). Both registration methods are similarly effective except in one particular case where the chain approach fails resulting in highly corrupted T1 maps. Using both proposed registration approaches, the mean RMSE of the SR fits was found to be significantly lower throughout all patient/runs compared to the “no-registration” approach (Fig. 3a)) (paired t-test p<1e-10). There was no significant difference between the mean RMSE obtained the two registration approaches (paired t-test p=0.47). Further evidence of this fact can be seen in the histogram in Fig. 3b), obtained by pooling the value of the RMSE of all ROI voxels of all patients/days/runs.Conclusion
We evaluated the impact of image registration on renal T1 estimates in paediatric patients with CKD. The “chain” method appears susceptible to propagation of errors throughout the time series due to the fact that the reference image for the registration step changes in each iteration. This suggests that having a fixed high SNR reference image should be prioritized over minimizing differences in contrast throughout the time series. Nevertheless, both registration approaches were successful in improving the quality of the T1 estimates on a challenging patient population, as assessed by intra- and inter-scan repeatability and analysis of the RMSE of the SR fits.Acknowledgements
The authors would like to thank Kidney Research UK (www.kidneyresearchuk.org) for funding this work. Part of this work was supported by the National Institute for Health Research University College London Hospitals Biomedical Research Centre.References
[1] Huang, Y., et. al., Measurement and comparison of T1 relaxation times in native and transplanted kidney cortex and medulla, JMRI, 33, 1241-1247, 2011 [2] Klein, S., et. al., A Toolbox for Intensity-Based Medical Image Registration, IEEE TMI, 29, 196-205, 2010Figures
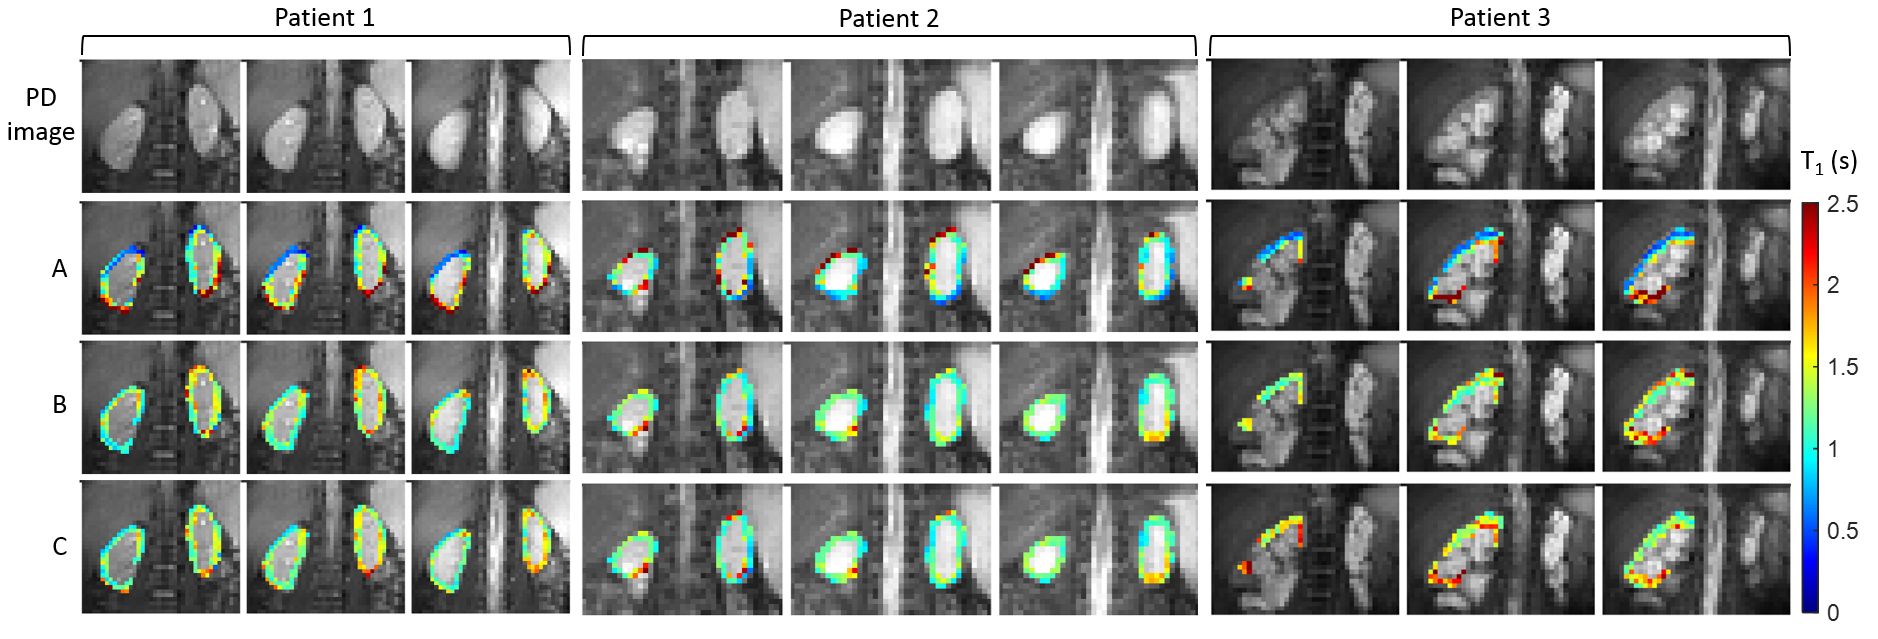
Example of the effect of image registration on
the T1 estimates in the functional renal parenchyma ROIs, overlaid on
corresponding proton-density reference images. Three central slices are shown
for three patients, where A - no image registration; B - “chain” registration
and C - “direct” registration. Note how the boundary artefacts, seen in row
‘A’, occurring due to changes in position by the kidney throughout the time
series, are well suppressed with registration methods ‘B’ and ‘C’.
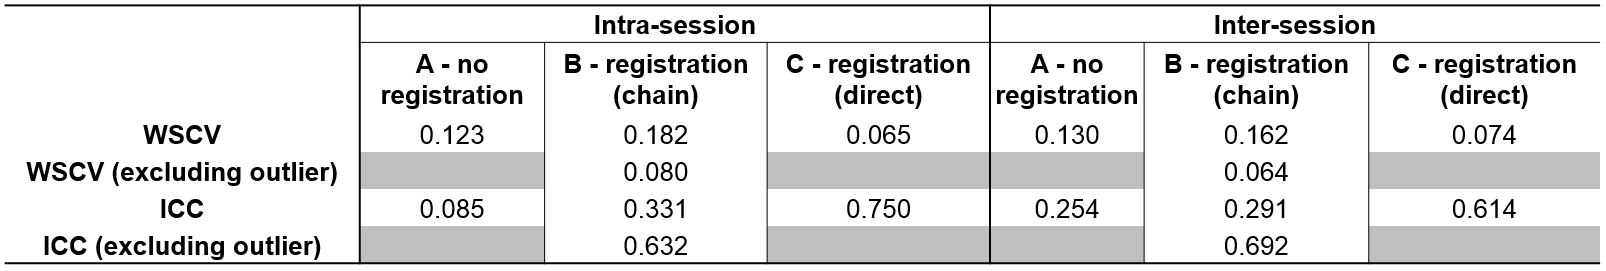
Intra and inter-session repeatability measures.
WSCV: within-subject coefficient of variation; ICC: intra-class correlation
coefficient.
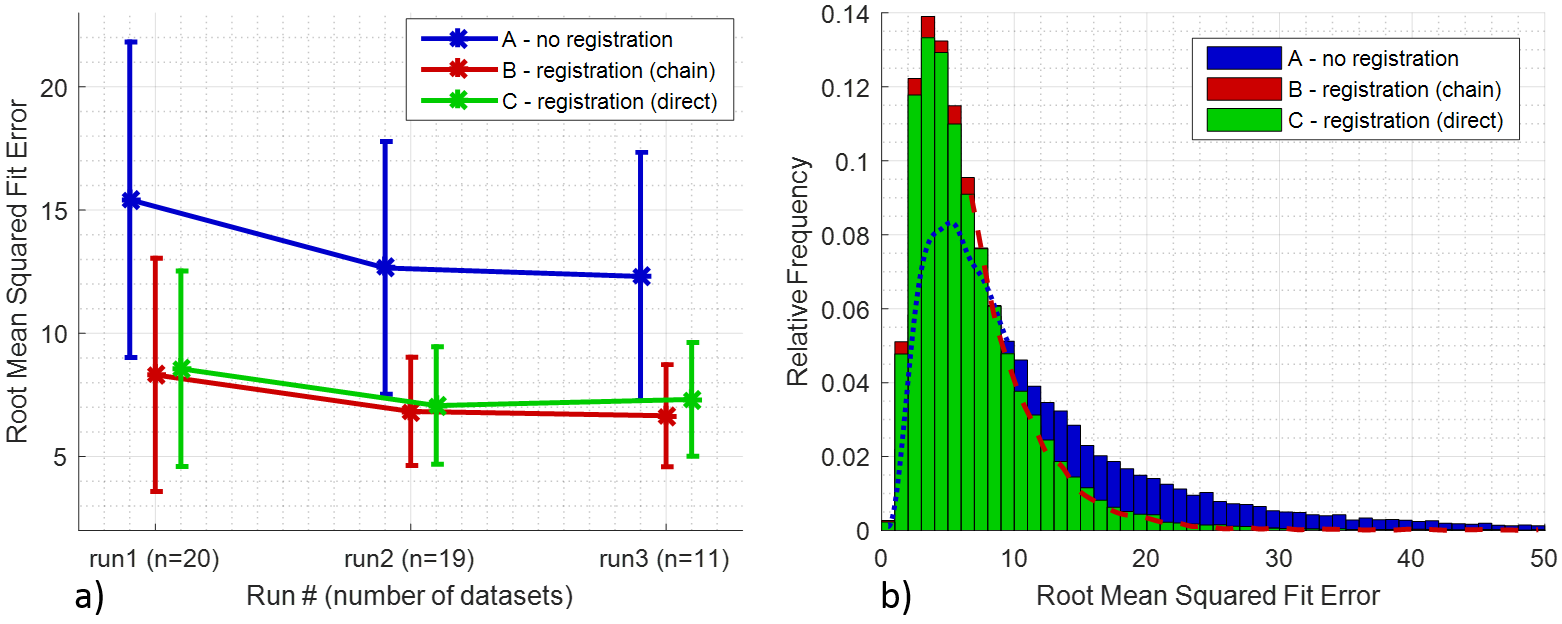
Effect of applying the proposed registration
approaches on the root mean squared error (RMSE) of the SR fits on the functional
renal parenchyma ROIs. a) Average ± standard deviation (error bars) RMSE across
all subjects for each run of a given day. b) Histogram of the RMSE of
individual voxels for all patients/days/runs. The dashed lines correspond to
the obscured sections of histograms A and B.