1300
On the importance of skin color phase variations for video measurement of cardiac activity in MRI1University of Applied Sciences and Arts Dortmund, Dortmund, Germany, 2Erwin L. Hahn Institute for Magnetic Resonance Imaging, University Duisburg-Essen, Essen, Germany, 3Division of Medical Physics in Radiology, German Cancer Research Center, Heidelberg, Germany
Synopsis
The limitations of contact-based hardware for cardiac activity measurement in MRI (e.g. electrocardiography, pulse oximetry) might eventually be overcome by using videos of the skin. Currently, a limitation for practical usage is the poor signal-to-noise ratio of the acquired signals, especially in an MR environment. We analyzed pixel intensity variations over time measured on the forehead and observed that 15%-25% of pixels exhibit a different signal morphology and phase than the remaining pixels. This effect is a limitation for many algorithms related and unrelated to MRI: If all pixels within a region-of-interest are used for averaging, different signal types are mixed which biases results.
Introduction
Videos from human skin allow the measurement of peripheral blood perfusion that is associated with cardiac activity1. Recently, algorithms for physiological measurement have been proposed in the context of MRI2,3. Video-based cardiac gating has the potential to overcome the physical restrictions of contact-based methods such as pulse oximetry (PO) or electrocardiography (ECG) and would be especially valuable in ultra-high-field MRI where ECG is error-prone4. Different works proposed video-based cardiac gating as future work2,5 but one major limitation is the poor signal-to-noise ratio (SNR) of the video signal caused by illumination conditions inside the MR bore and relatively low performance of compatible camera hardware.
We developed an open-source hardware and software system (described in another abstract submitted to this conference) to make the method available to others and to analyze the influence of skin illumination on SNR. During evaluation, we observed a skin property that biases algorithms averaging pixel values in a region-of-interest (ROI), which is the case for many algorithms, including those related2,3,5 and unrelated to MRI.
Methods
The experimental setup was similar to related works2,3,5: In a 7T MR room (Magnetom, Siemens GmbH, Erlangen, Germany), a custom-built stand was installed above a volunteer so that a MR-compatible camera (12M-i, MRC Systems, Heidelberg, Germany; 30Hz sampling rate, integrated LED, peak wavelength 950nm) was aimed toward the forehead; ten green LEDs (L-7113VGC-E, Kingbright, CA, USA; peak wavelength 518nm) were used to increase illumination. The infrared LED integrated in the camera was turned on and room lighting was turned off. The MR vendor-provided finger PO probe (50Hz sampling rate) was used as ground truth. Three consecutive stages with duration of 60s each were recorded: 1) dedicated LED illumination turned off, 2) set to 90mA, and 3) set to 180mA.Results
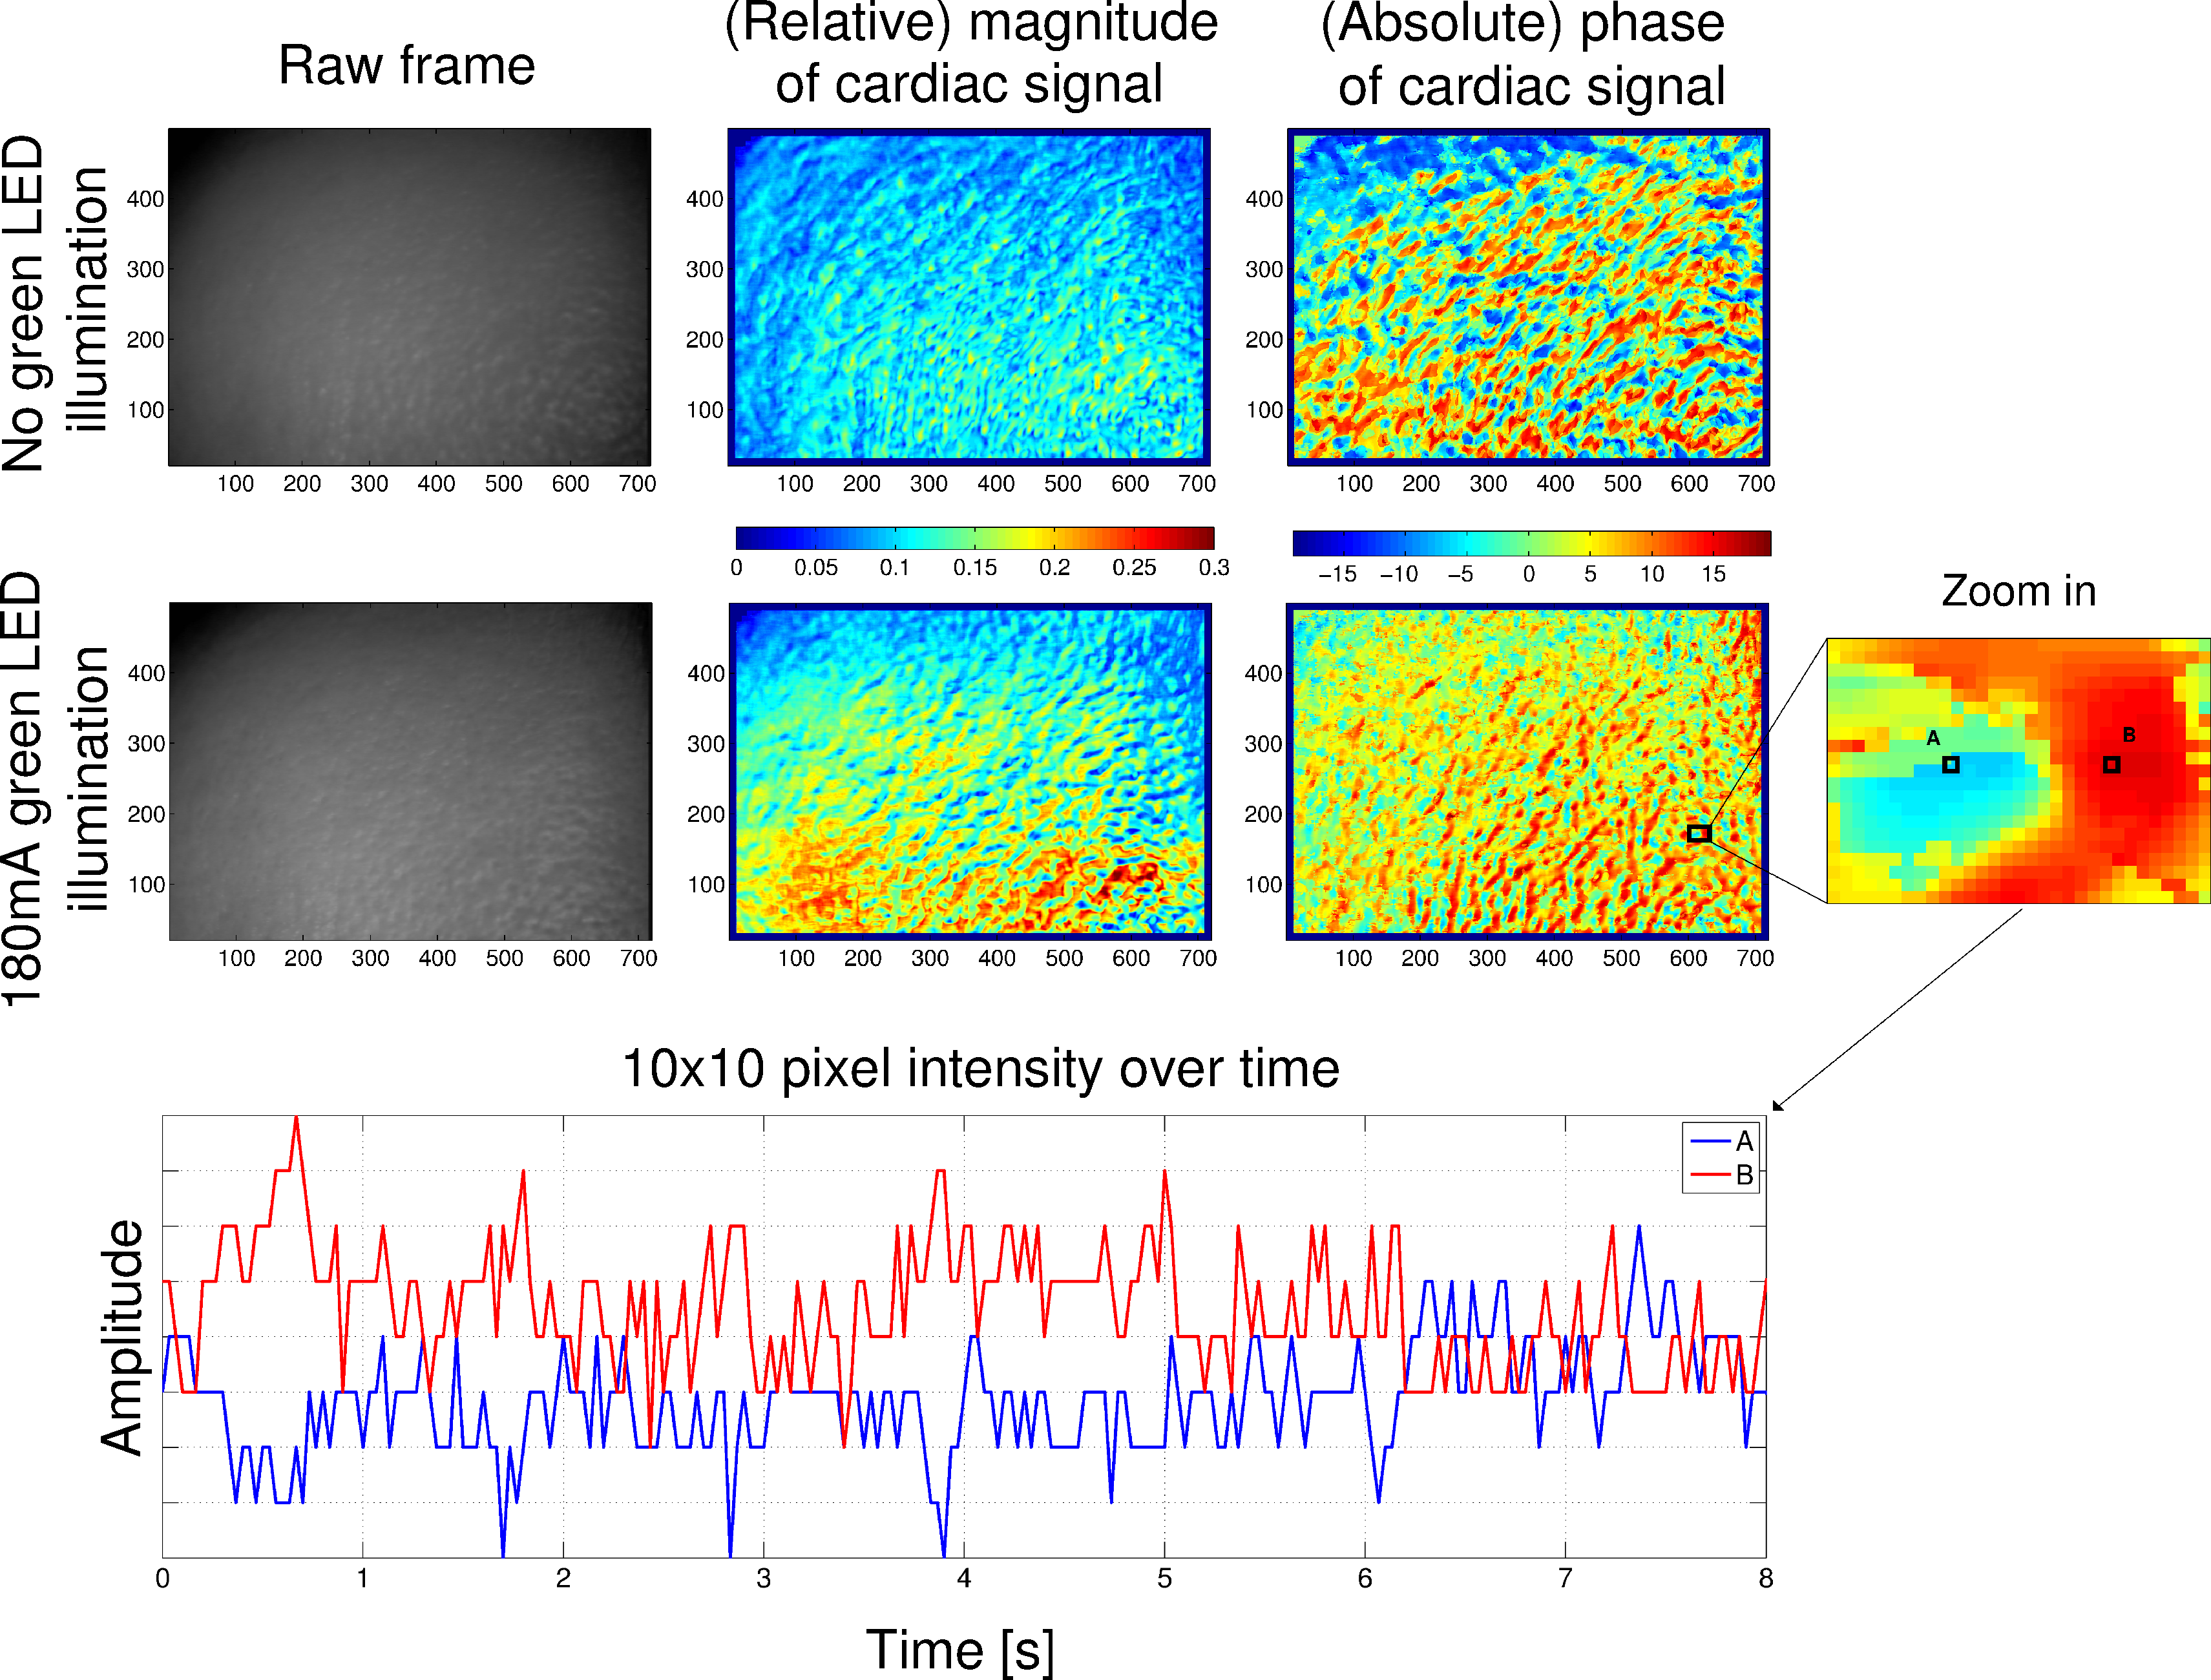
To analyze the influence of different illumination conditions during the individual stages, we visualized the spatial distribution of the cardiac signal on the forehead using pseudo-colored maps. Fig. 1 shows maps depicting the magnitude and phase of the cardiac signal during the first and third stage. As can be seen in the magnitude map, the SNR of the video, i.e. the magnitude of the cardiac component, is increased and reaches a maximum of approximately 30% with dedicated illumination compared to 20% without. Additionally, we observed no continuous areas of similarly high SNR but instead scattered areas with varying high and low SNR.
Therefore, we analyzed the spatial distribution of the phase and observed that counter-phase skin color variations, that were recently described6, appear in close proximity to each other. As an example, Fig. 1 shows in the bottom plot two pixels (A and B) thirteen pixels apart, exhibiting a 180 degree phase shift. If a ROI would be placed across both pixels, they would not contribute to the final signal since they cancel each other out.
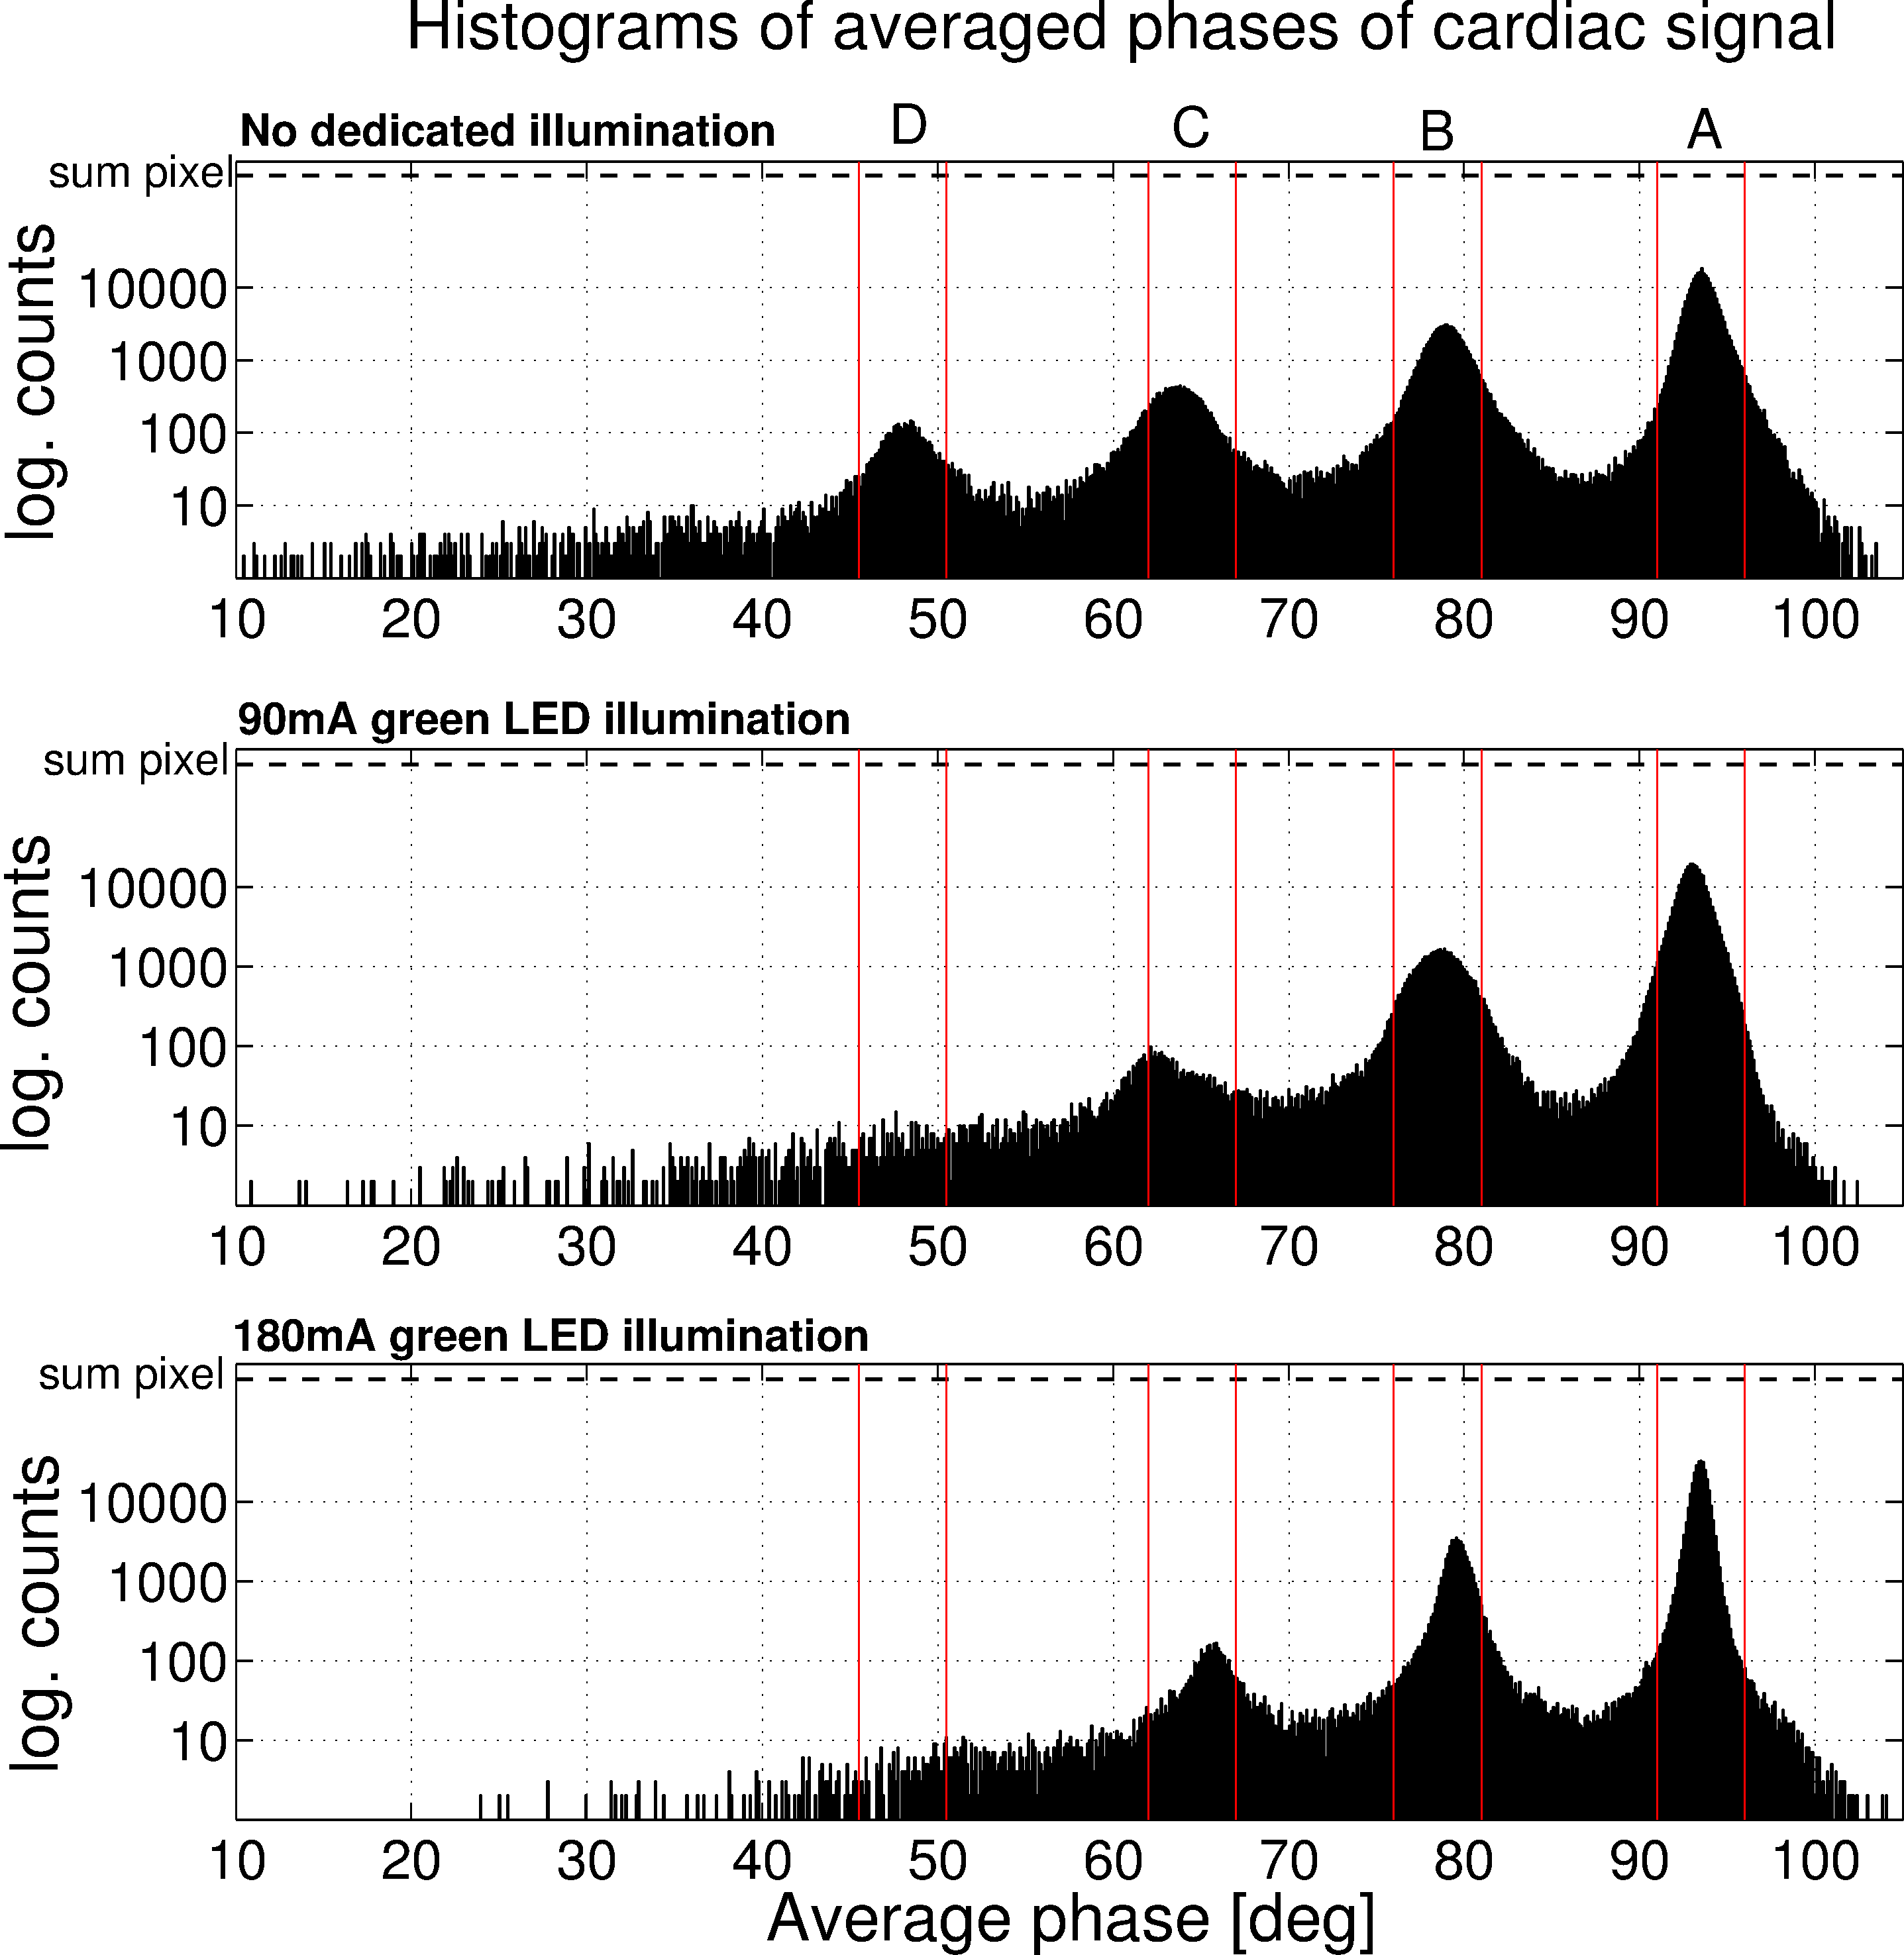
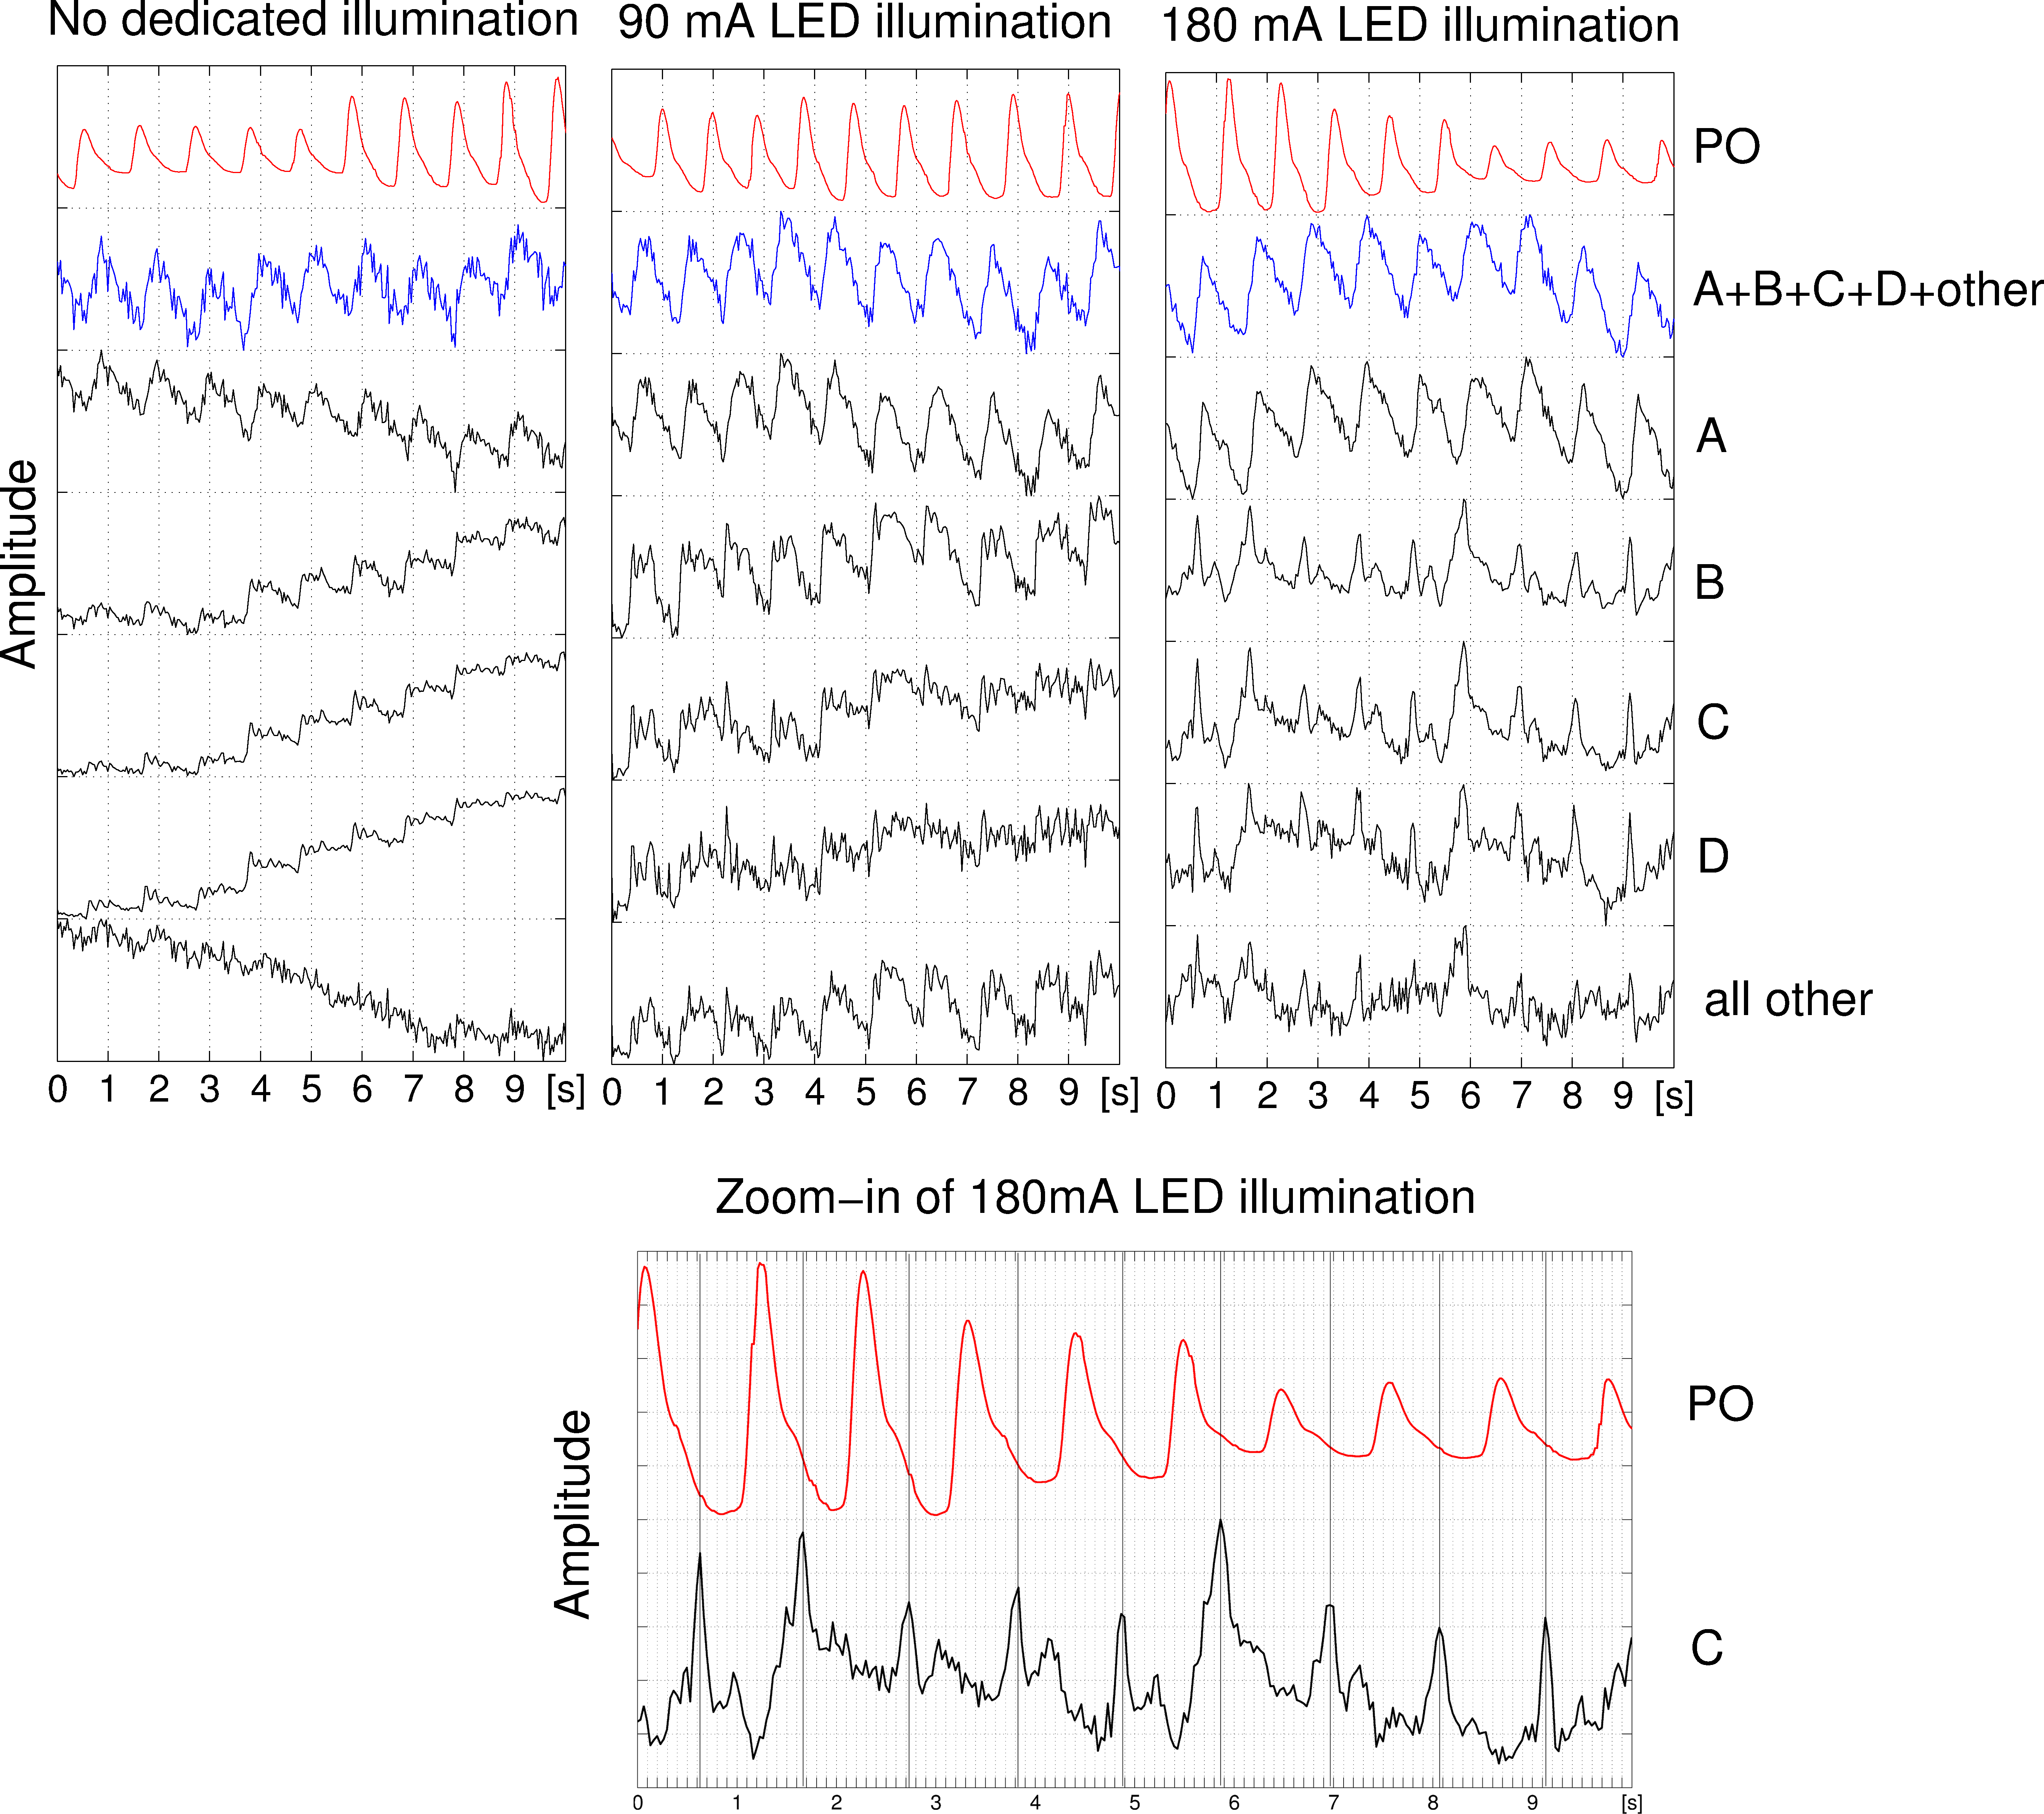
Fig. 2 shows histograms over the phases of all pixels of the cardiac component over time. The top histogram exhibits four distinctive peaks (section A-D) that appear in all videos, except peak D which disappears during stages with illumination. Fig. 3 shows averaged intensity variations of pixels within the same phase section A-D over time. The PO signal and the signal, that is obtained when applying a ROI across all pixels, are displayed for comparison. It can be seen that the most pixels lie within peak A (Stage 1: 75.8% 2: 86.0% 3: 85.6%) which therefore contribute most to the averaged signal. Signals obtained from peaks B-D exhibit a different morphology when compared to A and furthermore, with an illumination of 180mA, exhibit peaks that consistently appear near the ''dicrotic notch''7 of the PO signal as shown in the bottom plot of Fig. 3.
Discussion and Conclusion
The limitations of contact-based gating hardware might eventually be overcome by using an unobtrusive video measurement, but to date video SNR has been too low. By increasing illumination we could increase the video SNR considerably but also found counter-phase skin color variations both with and without illumination. This effect is a major limitation for many algorithms related and unrelated to MRI: If a ROI is placed for signal averaging, counter-phase skin color variations cancel each other out.
Additionally, we observed that 15%-25% of pixels, depending on illumination, have a different signal morphology over time than the remaining pixels. Simply considering all pixels within a ROI, as it is widely practice today, mixes both signal types. We will address the skin color phase variations observed here in future work by developing algorithms that will exclude pixels inside a ROI, based on their phase components.
Acknowledgements
No acknowledgement found.References
[1] Sun Y, Thakor N. Photoplethysmography Revisited: From Contact to Noncontact, From Point to Imaging. IEEE Transactions on Biomedical Engineering 2015;63(3):463-477
[2] Maclaren J, Aksoy M, Bammer R. Contact-free physiological monitoring using a markerless optical system. Magnetic Resonance in Medicine 2015;74(2):571-577
[3] Spicher N, Maderwald S, Ladd ME, et al. Heart rate monitoring in ultra-high-field MRI using frequency information obtained from video signals of the human skin compared to electrocardiography and pulse oximetry. Current Directions in Biomedical Engineering 2015;1(1):69-72
[4] Snyder CJ, DelaBarre L, Metzger GJ, et al. Initial results of cardiac imaging at 7 tesla. Magnetic Resonance in Medicine 2009;61(3):517-524
[5] Spicher N, Kukuk M, Ladd ME, et al. In vivo 7T MR imaging triggered by phase information obtained from video signals of the human skin. Proceedings ISMRM 2015 (#2548)
[6] Kamshilin AA, Nippolainen E, Sidorov IS, et al. A new look at the essence of the imaging photoplethysmography. Scientific Reports 2015;5(10494):1-9
[7] Allen J. Photoplethysmography and its application in clinical physiological measurement. Investigative Radiology 2017;28(3):1-39
Figures