1288
Phase-based Motion Detection for Diffusion Magnetic Resonance Imaging1Diagnostic Radiology, University of Maryland School of Medicine, Baltimore, MD, United States, 2Neural and Pain Sciences and Orthodontics, University of Maryland Dental School, Baltimore, MD, United States, 3Electrical and Computer Engineering, Johns Hopkins University, Baltimore, MD, United States
Synopsis
Diffusion-weighted imaging is sensitive to subject motion. Even small subject motion induces dramatic spin phase changes, allowing phase map to have higher sensitivity than the magnitude images to detect subtle motion. In this study, we derived metrics based on the Haralick features in DWI phase maps for automatic motion detection and data rejection in diffusion-weighted imaging data. The motion detection method is validated against motion tracked by an external electromagnetic motion tracking sensor.
Purpose
Diffusion-weighted-Imaging (DWI) is very sensitive to a subject’s motion. As DWI is trying to capture water molecule motion on a molecular level, any bulk motion can lead to inaccurate diffusion maps. Different methods have been developed to detect and correct motion in diffusion imaging, mostly based on loss of signal magnitude [1] or 3D volume registrations [2]. As motion leads to accumulated spin phase in MRI, phase mapping could provide more reliable information about subject motion. A new method based on the phase maps of DWI to detect and reject motion corrupted data is presented. Textural features [3] of the DWI phase map are analyzed to develop a reliable threshold for data rejection. The results of the method are compared against the tracking of an electromagnetic motion tracking system for validation.Methods
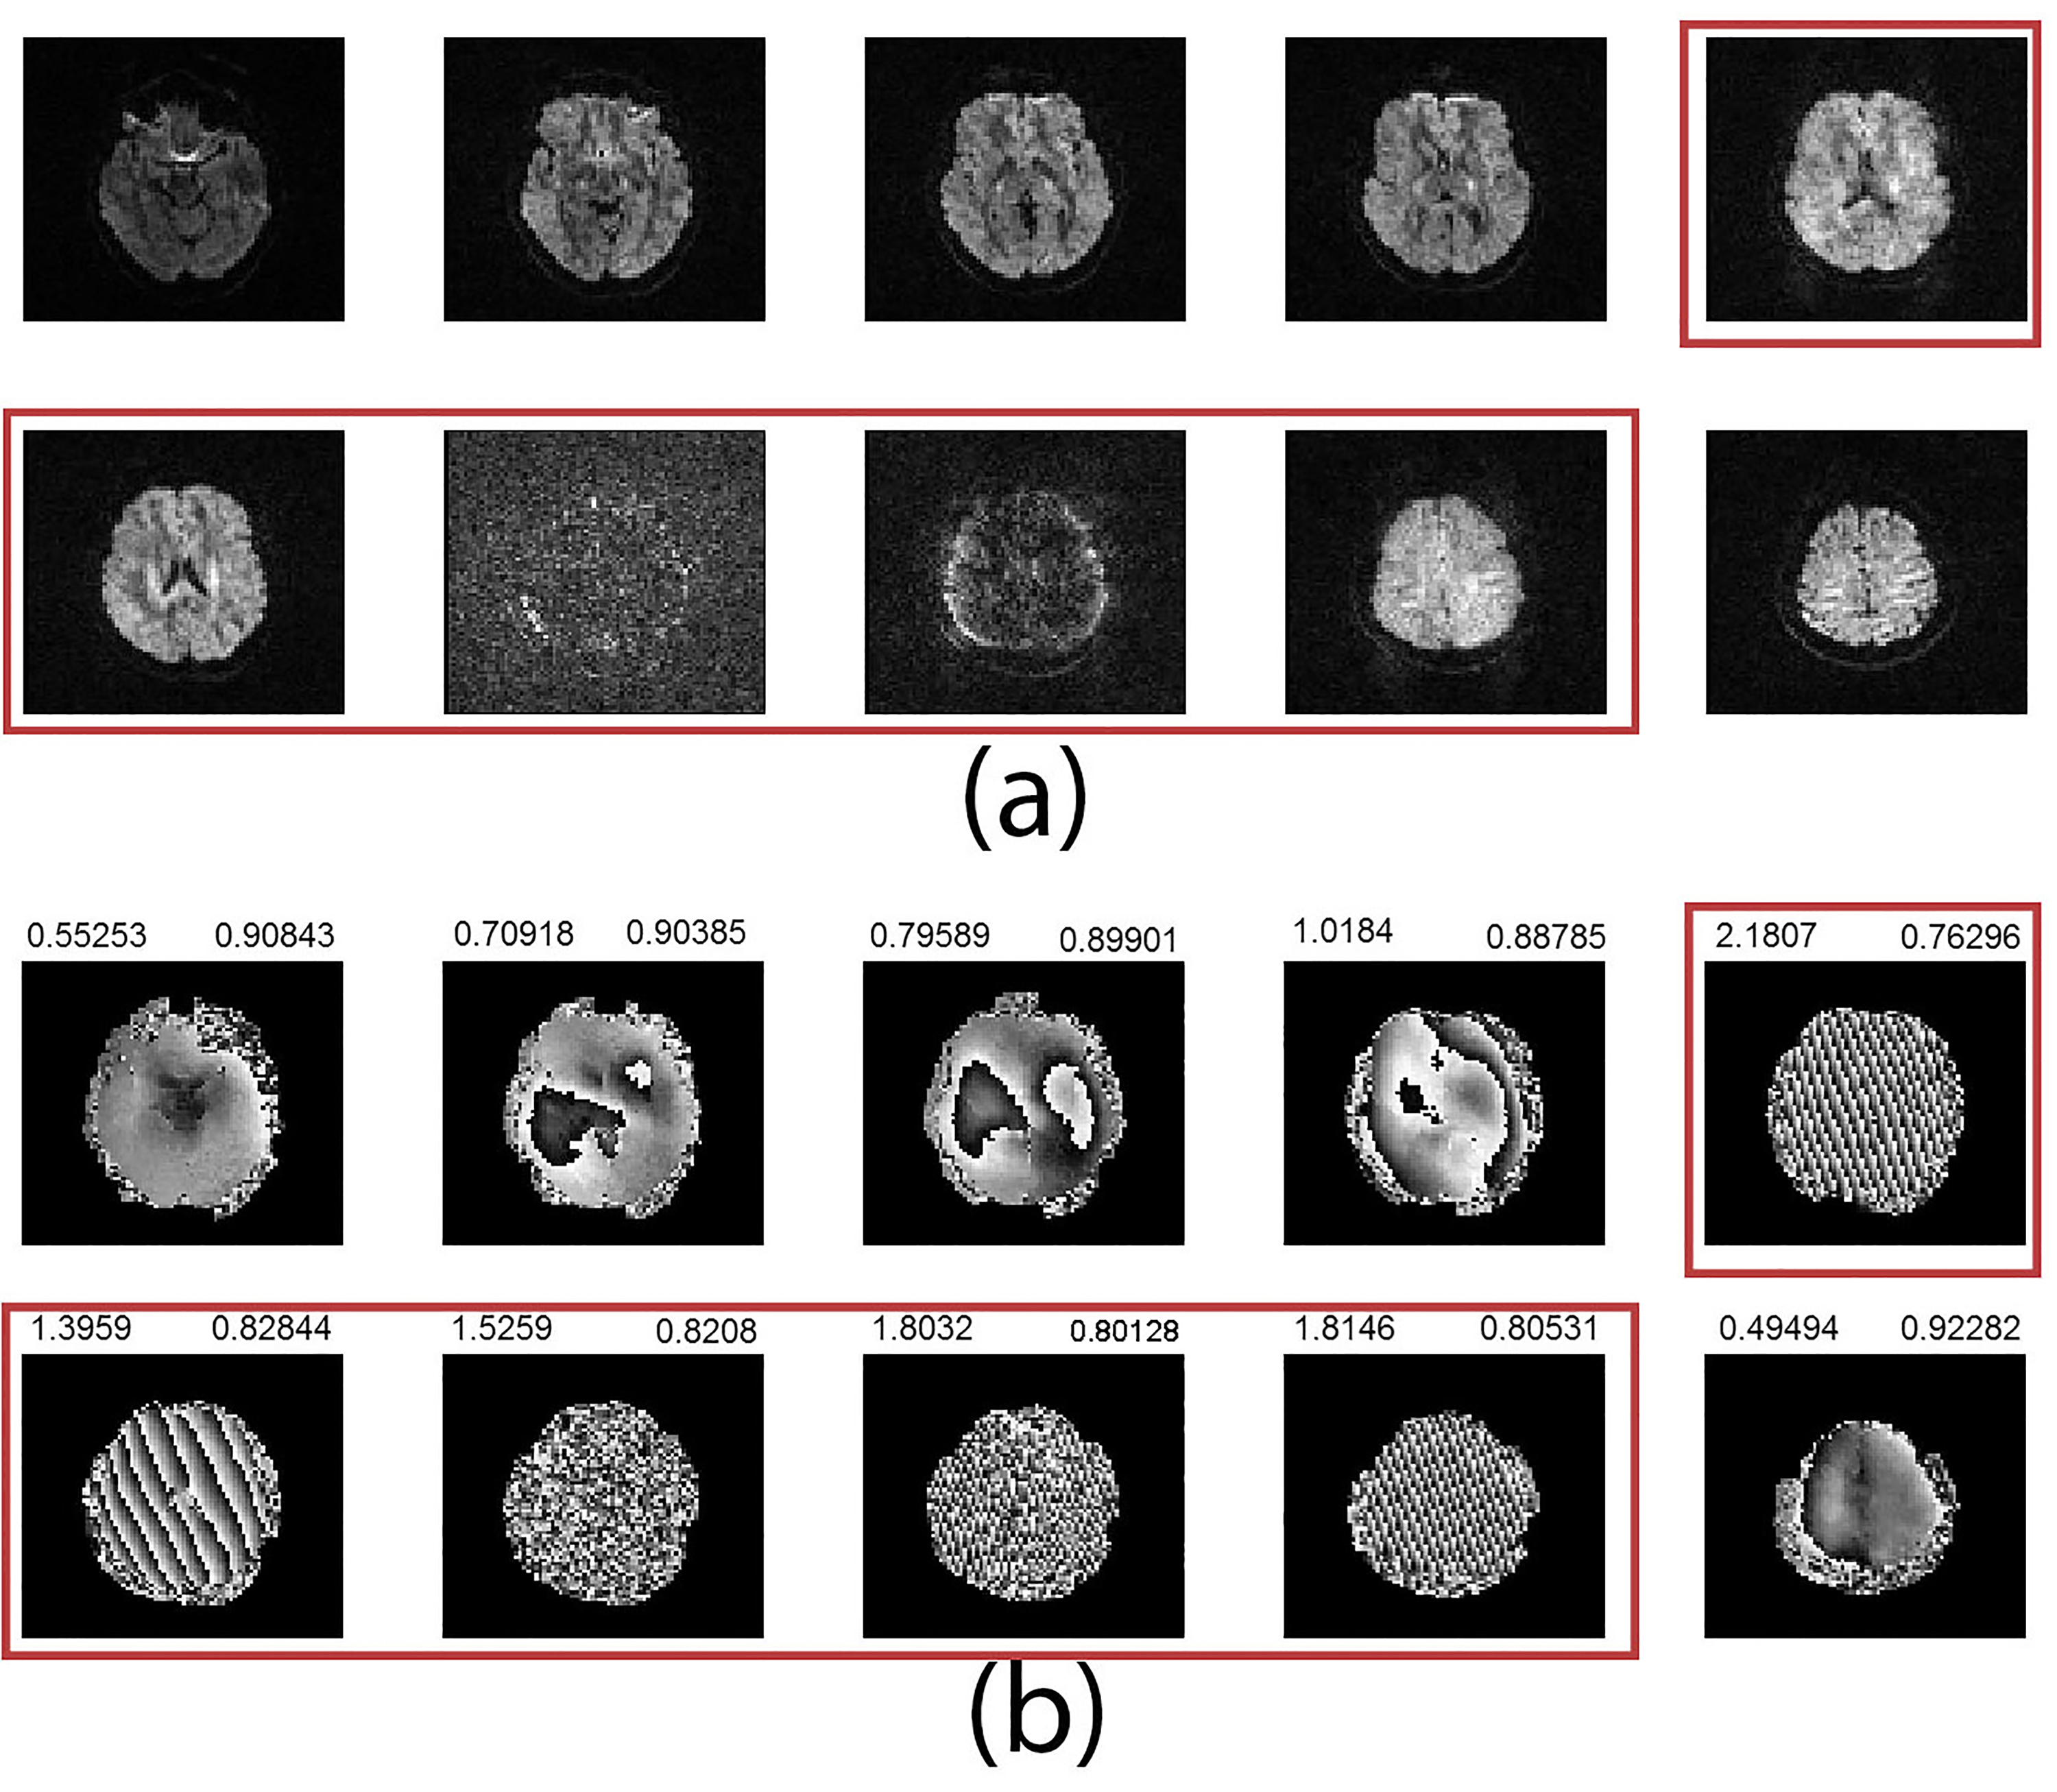
MR DTI imaging was performed using a 3T MRI scanner (Tim Trio, Siemens Healthcare) with a 12-channel head coil. A healthy volunteer was instructed to move her head voluntarily during diffusion tensor imaging acquisition with a 2D SE EPI pulse sequence (TR/TE =5s/ 79 ms, FOV=24 cm, matrix=80x80, number of slices=45, slice thickness=3 mm, b-value=1000 s/mm$$$^2$$$, 30 electrostatically arranged diffusion directions [4], 2 averages). The DTI sequence was adapted to incorporate motion tracking using a magnetic-field tracking sensor (Robin Medical Inc.) attached to the subject’s head. The location and orientation of the sensor can be determined by measuring voltages induced in the coils inside the sensors with respect to the MR magnetic field gradients. The DTI pulse sequence was triggered to track the motion at the beginning of each slice acquisition with a sampling rate of 40 Hz. Rather than removing entire volume at a time, we analyze DWI on a slice-by-slice basis and remove only the corrupted slices in diffusion-weighted volumes. Two statistical features known as Haralick features [3] were extracted from the phase images within the brain mask. These features are the contrast calculated by (1) and the homogeneity calculated by (2). These features are shown in Fig. 1(b) corresponding to the magnitude images in Fig 1(a).
Contrast: $$$\sum_{ij}|i-j|^2p(i,j)$$$ (1)
Homogeneity: $$$\sum_{ij}\frac{p(i,j)}{1+|i-j|}$$$ (2)
where is the entry in a normalized gray-tone spatial-dependence matrix. These features are shown in Fig. 1(b) corresponding to the magnitude images in Fig 1(a). We used an algorithm that uses a metric that takes into account both the textural features as well as the fact if a rejected slice is adjacent to the slice being evaluated. (If $$$slice_{z-1}$$$ and $$$slice_{z+1}$$$ rejected, Reject $$$slice_z)$$$. A contrast value greater than 1.2 and a homogeneity value less than 0.86 are both used to reject the corresponding DWI slice.
Results
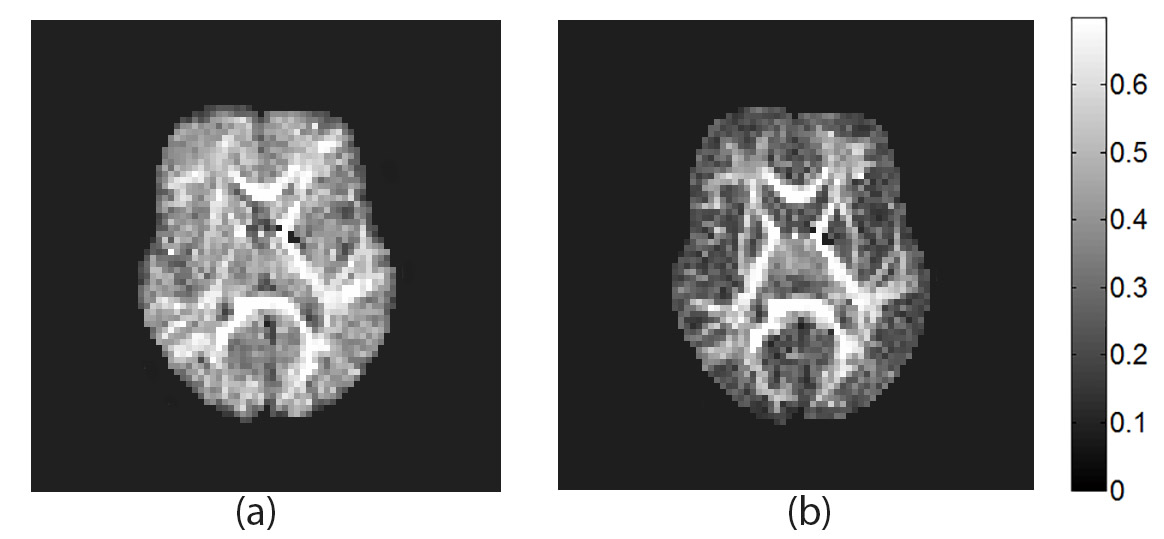
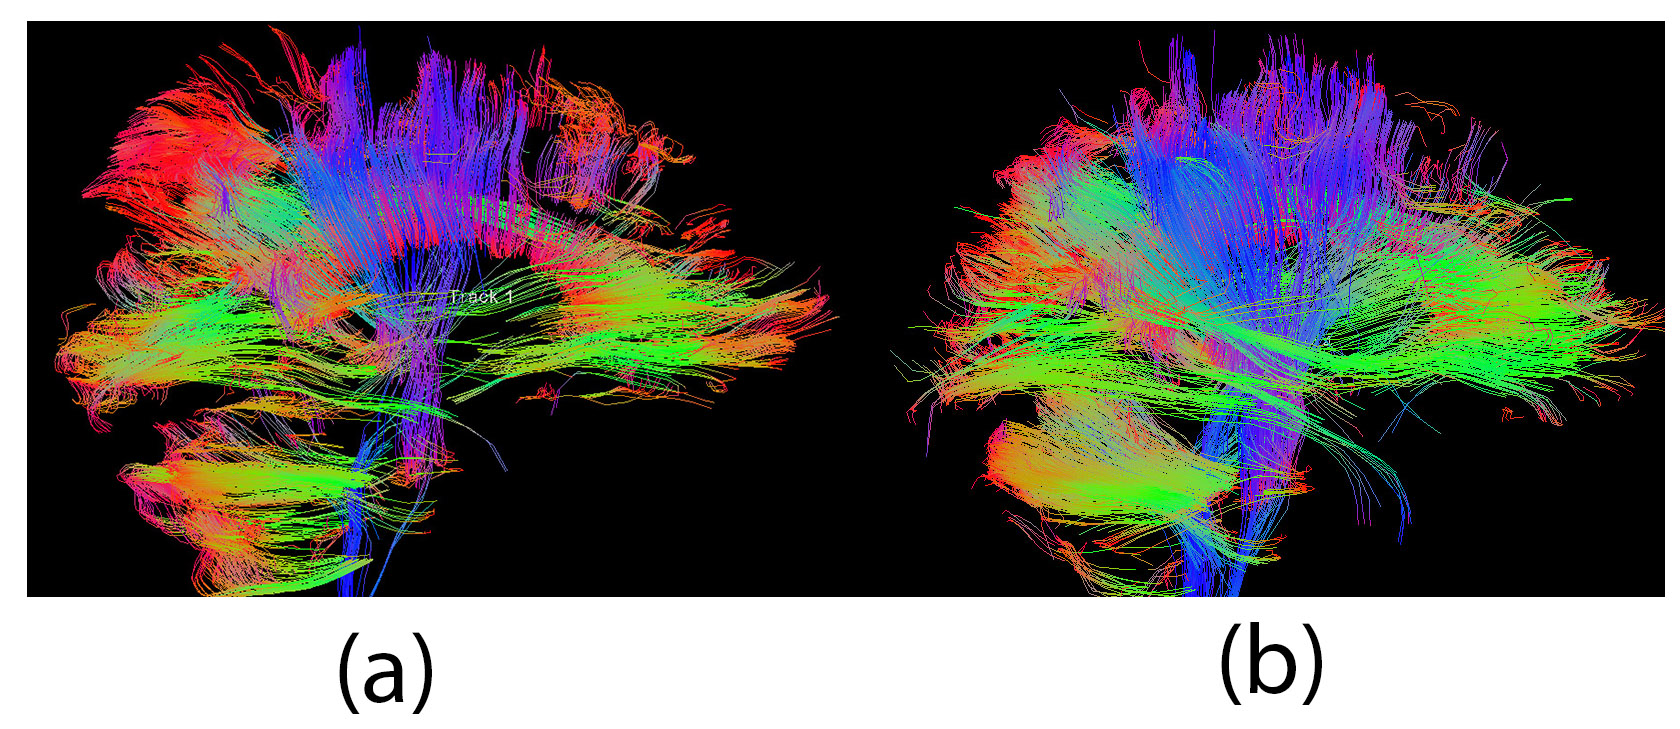
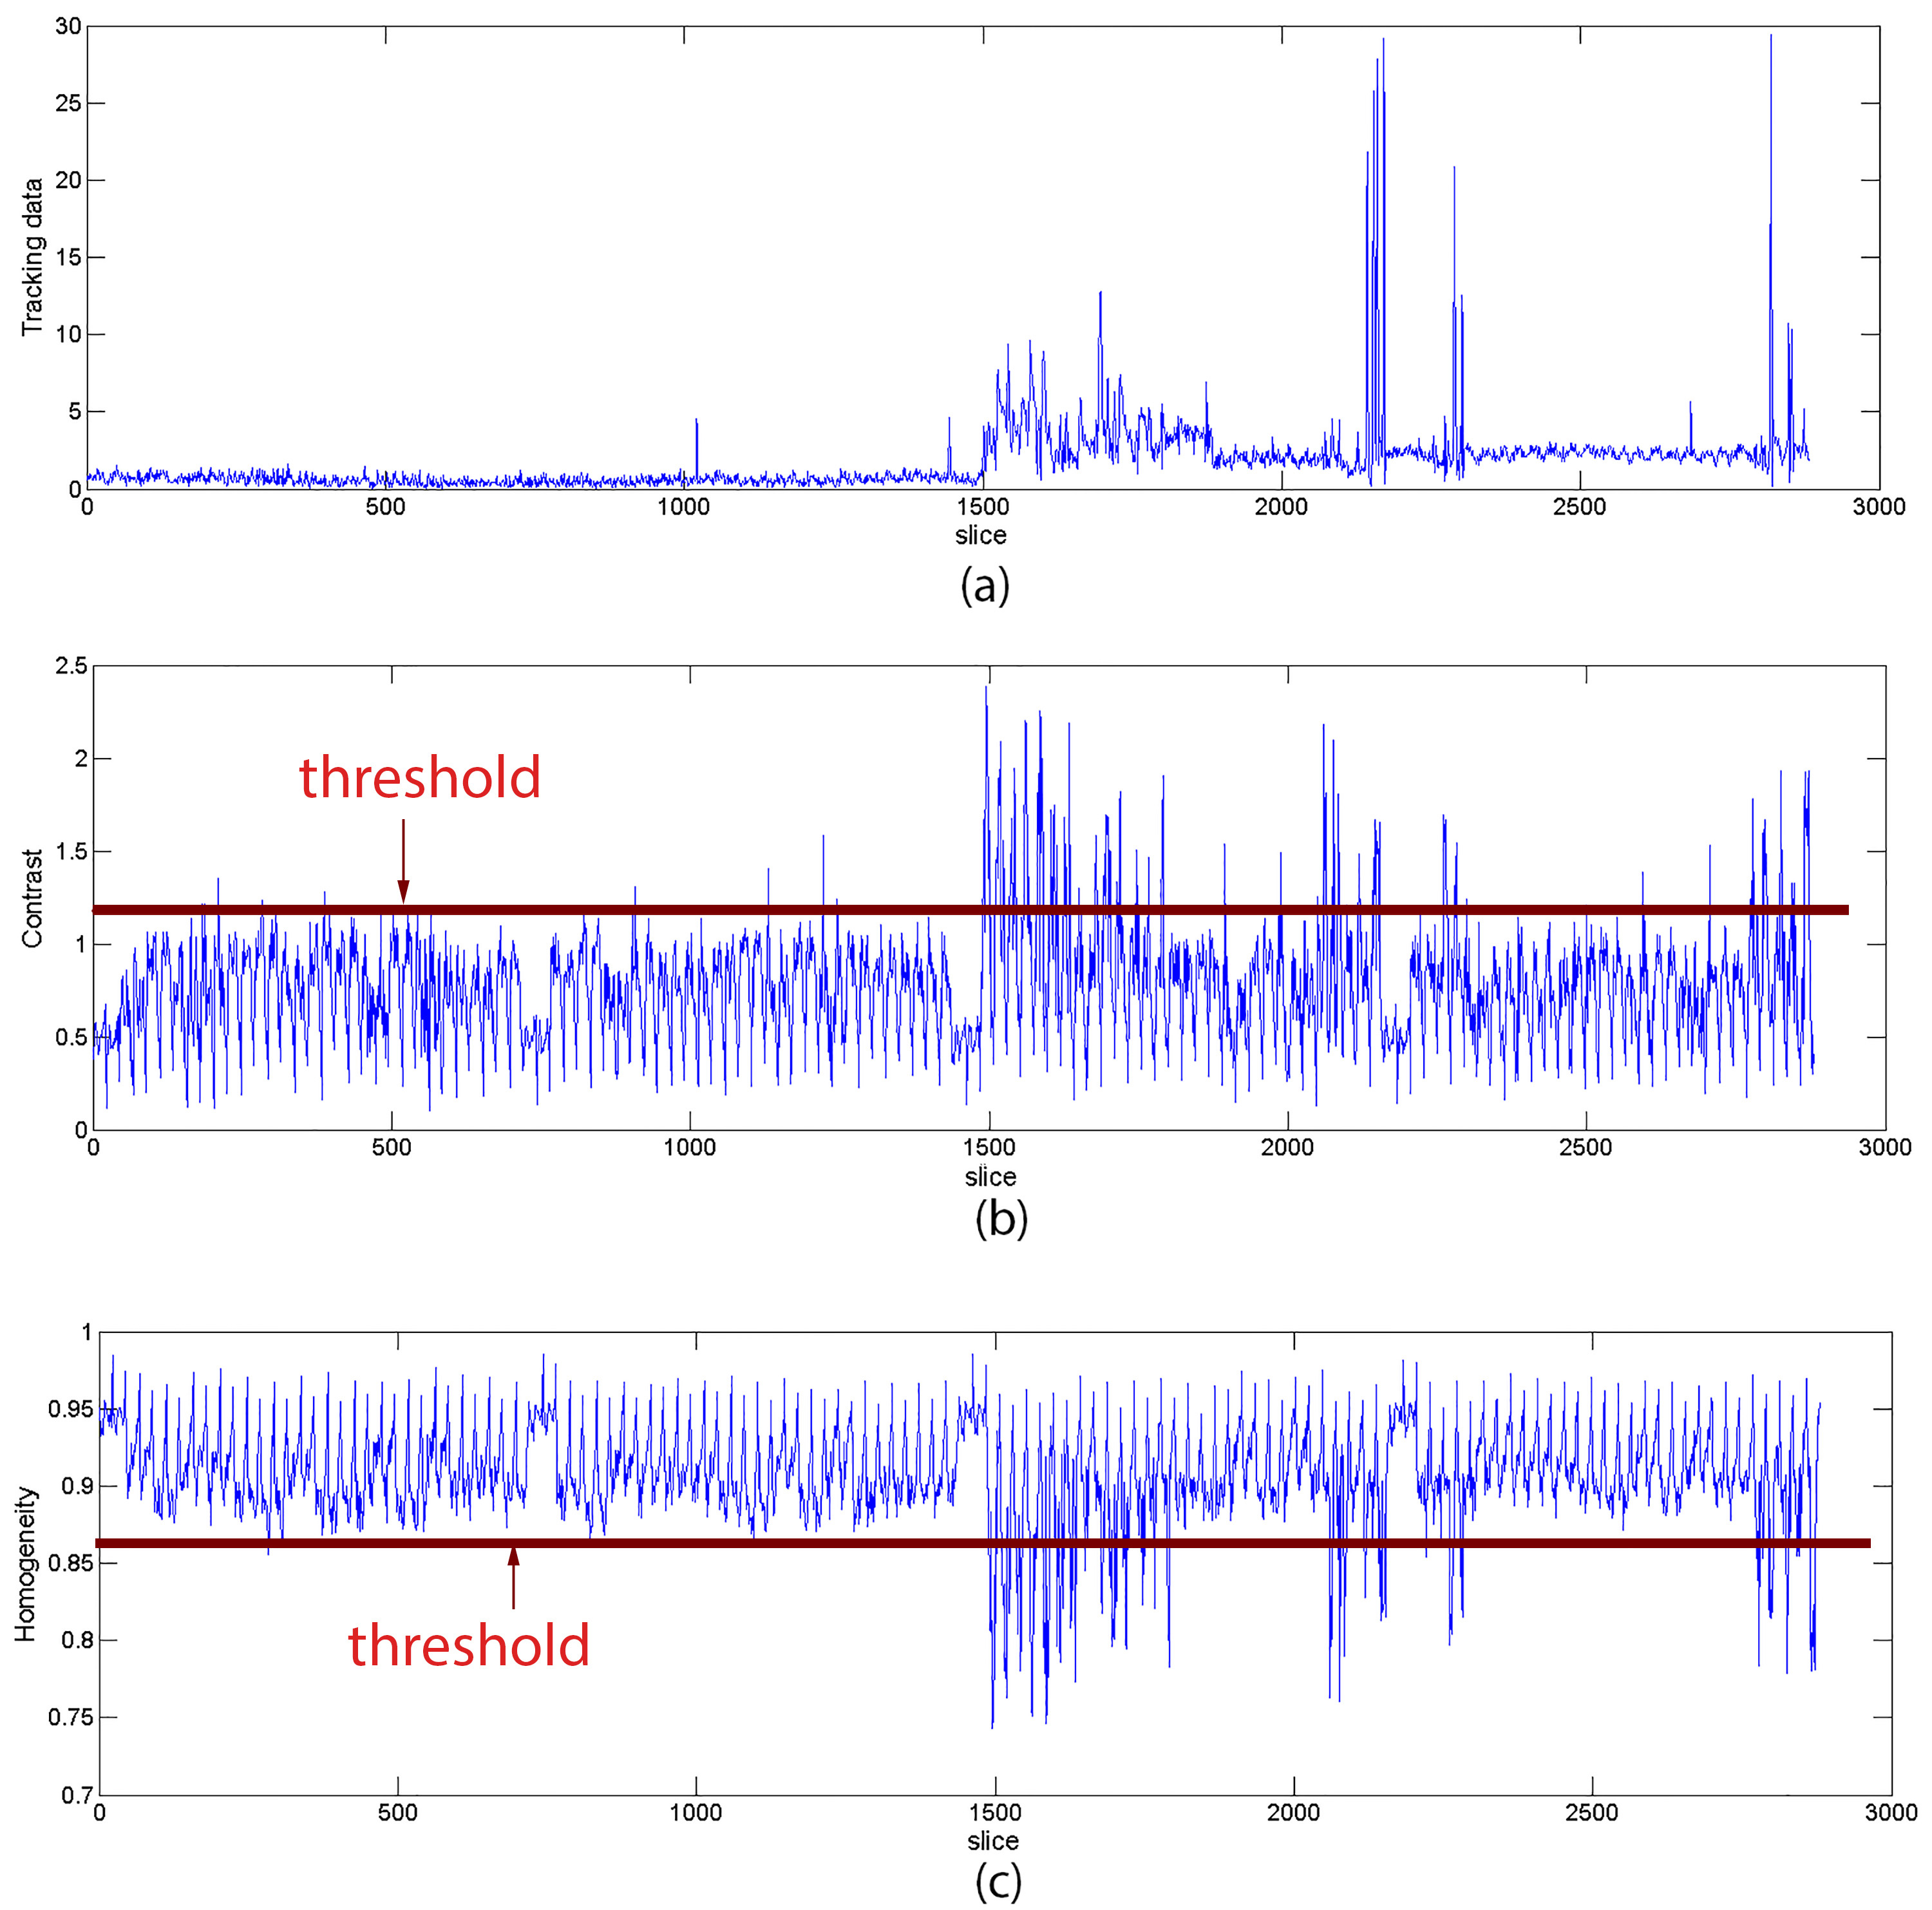
Fig. 1(b) shows the phase maps corresponding to the DW images in Fig. 1(a). Note that the phase maps are more capable than magnitude images to capture motion as the phase changes much more rapidly in case of motion than no-motion. This phase change is usually represented in the form of a noisy phase map or a phase map with many phase ripples. In Fig. 2, the top plot shows the average motion using the electromagnetic sensor whereas the bottom plot shows the contrast metric of the phase images above the chosen threshold (e.g., 1.2). And the bottom plot shows the homogeneity metric of the phase images below the chosen threshold (e.g., 0.86). Using the aforementioned method we deleted only the diffusion weighted slices corresponding to the rejected phase images. About 7.5% of the DWI data are rejected according to the data rejection algorithm. Then we reconstructed the diffusion tensor using only the motion-free slices and compared that tensor against the one that included all the data. Fig. 3 shows the FA maps of the DWI data with motion versus the FA map with motion-free data. Similarly, Fig. 4 shows the fiber tractography of a sagittal view with motion and no motion, where the same tracking parameters were used in both cases.Discussion
The proposed phase-map based motion detection algorithm provides a reliable indication of DWI data corruption due to motion, which is in agreement with motion tracked from an external electromagnetic tracking sensor. The proposed approach can be used to clean severely motion corrupted DTI data for more robust diffusion tensor estimation.Conclusion
The proposed method can be a robust and simpler alternative for automatic motion detection in DWI. Future work will be to apply the algorithm to prospective motion detection and reacquisition of those missing slices as well as the possibility of extracting the motion from those phase images to adjust the applied diffusion gradients accordingly.Acknowledgements
No acknowledgement found.References
[1] Z. Liu, Y. Wang, G. Gerig, S. Gouttard, R. Tao, T. Fletcher and M. Styner, "Quality control of diffusion weighted images," in Proc SPIE Int Soc Opt Eng, San Diego, California, USA., 2010.
[2] T. Benner, A. J. W. van der Kouwe and A. G. Sorensen, "Diffusion imaging with prospective motion correction and reacquisition," Magn Reson Med, vol. 66, no. 1, pp. 154-167, 2011.
[3] R. M. Haralick, K. Shanmugam and I. Dinstein, "Textural Features for Image Classification," IEEE Trans. Systems Man Cybernet., vol. 3, p. 610–621, 1973.
[4] D. K. Jones, M. A. Horsfield and A. Simmons, "Optimal Strategies for Measuring Diffusion in Anisotropic Systems by Magnetic Resonance Imaging," Magn Reson Med, vol. 42, pp. 515-525, 1999.
Figures