1274
Quantitative evaluation of prospective motion correction for structural imaging at 7T1Department of Biomedical Magnetic Resonance, Otto-von-Guericke University, Magdeburg, Germany, 2German Center for Neurodegenerative Diseases, Magdeburg, Germany, 3Center for Behavioral Brain Sciences, Magdeburg, Germany, 4Leibniz Institute for Neurobiology, Magdeburg, Germany
Synopsis
The problem of motion in MRI scan still remains prevalent for many applications and numerous solutions for motion correction in MRI have been proposed to improve the image quality in presence of motion. Prospective motion correction using an optical tracking system has the advantage that it allows to eliminate motion artifacts without prolonging the overall scan time. In this study, we scanned healthy subjects at 7T with high resolution structural imaging sequences for diverse range of contrasts, which are commonly used in neuroscience applications. The final results show an improved image quality and a great potential of prospective motion correction.
INTRODUCTION
Ultra high magnetic field strengths offer certain advantages for structural imaging such as a high SNR and resolution1. However, there is still a problem with long scan time, as for traditional MRI scans, and consequently a high sensitivity to motion artifacts. In this study, prospective motion correction (PMC) with an optical tracking system was used to acquire structural images for diverse range of contrasts and resolutions. The main goal of this work was to investigated the stability and robustness of the optical tracking system for PMC in MRI on multiple recruited subjects. For this purpose, the image quality of the corrected and uncorrected images was assessed qualitatively and quantitatively.METHODS
After written consent, 21 healthy subjects were scanned using a 7T MRI system (Siemens, Erlangen, Germany) with a 32-channel head coil (Nova Medical, Wilmington, USA) and were asked not to move during examination. For tracking rigid head motion, a single in-bore camera tracked position of a marker (MT384ib, Metria Innovation Inc., Milwaukee, WI,USA), which was rigidly attached to the subject’s upper jaw with an individually manufactured mouthpiece2. During scanning of each subject, every sequence was repeated twice, with and without PMC, and the order of acquisition PMC ON - PMC OFF was completely randomized. The following sequences were acquired: a 3D-MPRAGE sequence, T1-weighted (T1-w) images, full brain acquisition, 0.45x0.45x0.45 mm3, TR/TE/TI 2820/2.82/1050 ms, FA 5°; a 2D-TSE sequence, T2-weighted (T2-w) and PD-weighted (PD-w) images, TR/TET2-w / TEPD-w, 6000/59/9.9 ms, FA 130°, voxel size 0.28x0.28x1.0 mm3; a 2D-GRE sequence, T2*-weighted (T2*-w) images, with 3 different in-plane resolutions, 0.5x0.5/0.35x0.35/0.25x0.25 mm2, slice thickness 1.5 mm, TR/TE05/TE035/TE025, 680/16.6/15.1/16.6 ms, FA 30°. Totally, 252 volumes were acquired and all the motion patterns were recorded. The subjective image quality assessment (IQA) was performed by 2 MRI experts, who scored the overall image quality (scale 1-10, worst-best quality) and the presence of motion artifacts (scale 1-10, image completely corrupted by motion artifacts - image without motion artifacts). Finally, an objective IQA was performed, several focus metrics (GLLV - Gray Level Local Variance, GLVN- Normalized GLV and TENV - Tenengrad Variance)3 were considered to compare images acquired without and with PMC.RESULTS
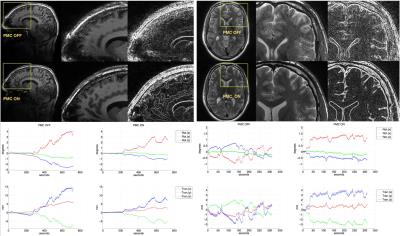
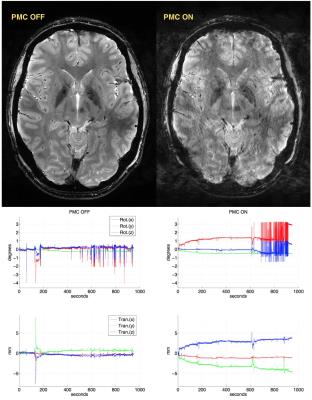
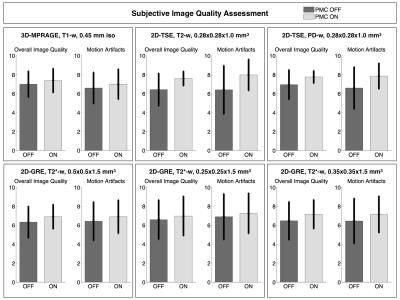
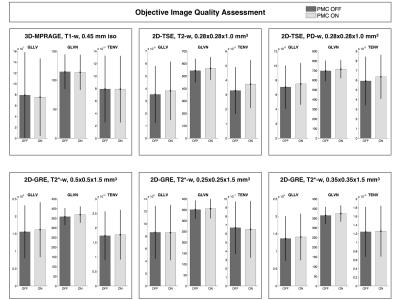
Tab.1 summarizes the motion quantification per subject. Exemplary, corrected and uncorrected images with the corresponding motion patterns are shown in the Fig.1. In the Fig.2 an additional example where the images acquired with the PMC are corrupted by motion artifacts is shown. Fig. 3 presents the subjective evaluation for all the images acquired, and Fig.4 the results of the objective IQA.DISCUSSION
From Tab.1 is evident that, in general, there were not large movements. The subjective IQA (Fig. 3) demonstrated a slightly better quality for the images acquired with PMC. Similar results were obtained with the objective IQA, except for the images acquired with the 3D-MPRAGE sequence, where the values of the prospectively motion corrected images were slightly lower than without motion correction. In this study (one of the largest PMC cohorts until today), subjective and objective IQA indicate that PMC improves the image quality. In this manner, PMC shows a great potential for numerous MRI applications in neuroscience and will be tested even further on patients in future work.Acknowledgements
This work was supported by the Initial Training Network, HiMR, funded by the FP7 Marie Curie Actions of the European Commission, grant number FP7-PEOPLE-2012-ITN-316716, and by the NIH, grant number 1R01-DA021146.References
1. Pohmann R, et al. Signal-to-noise ratio and MR tissue parameters in human brain imaging at 3, 7, and 9.4 Tesla using current receive coil arrays. Magn Reson Med. 2015; doi: 10.1002/mrm.25677.
2. Stucht D, et al. Highest Resolution In Vivo Human Brain MRI Using Prospective Motion Correction. PloS one 10, e0133921 (2015).
3. Pertuz S, et al. Analysis of focus measure operators for Shape-from-focus. Pattern Recognition,Vol. 46,Issue 5, May 2013, Pages 1415–14324.
Figures
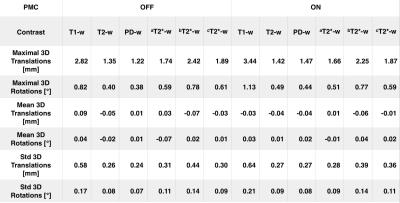
Tab.1: Statistical analysis of the subjects movement. The shown values are the means for all the subjects scanned.
a2D-GRE 0.5x0.5x1.5 mm3; b2D-GRE 0.25x0.25x1.5 mm3; c2D-GRE 0.35x0.35x1.5 mm3.
