1271
Registration-free analysis of diffusion MRI tractography data across subjects through the human lifespan1Athinoula A. Martinos Center for Biomedical Imaging, Department of Radiology, Massachusetts General Hospital and Harvard Medical School, Boston, MA, United States, 2Department of Psychology and Center for Brain Science, Harvard University, MA, United States, 3Department of Psychology, University of North Carolina at Chapel Hill, NC, United States, 4MIT Artificial Intelligence Laboratory, MIT, MA, United States
Synopsis
Diffusion MRI tractography produces massive sets of streamlines that need to be clustered into anatomically meaningful bundles. Conventional clustering techniques group streamlines based on their proximity in Euclidean space. We have developed an unsupervised method for clustering tractography streamlines based on their neighboring anatomical structures, rather than their coordinates in Euclidean space. In this work, we show how this approach can be extended to find corresponding clusters across subjects without inter-subject registration. We evaluate the approach on data from the MGH-Harvard-USC Lifespan Human Connectome Project, showing improved correspondence in tract clusters across subjects aged 8-90, without the need for registration.
Purpose
Tract clustering methods aim to group together similar streamlines from whole-brain tractography data. For group analysis, an individual's clusters can be compared to a tract atlas to identify known white-matter tracts [1], or correspondence of clusters across individuals can be established iteratively as each new subject is added to a data set [2,3]. Such methods rely on registering subjects to a common template space. This can be challenging when comparing individuals from healthy and diseased populations or from a wide age range. Here we propose a method for identifying corresponding tract clusters across subjects without the need for inter-subject registration, by relying on anatomical neighborhood information that is extracted in each subject's native space.Methods
We used data from 184 healthy subjects, ages 8-90, scanned for the MGH-Harvard-USC Lifespan Human Connectome Project [4]. T1-weighted images (3D MEMPRAGE, 1mm isotropic resolution) and diffusion-weighted images (2D EPI with FLEET-ACS, SMS=2, GRAPPA=3, 60 directions with $$$b=2500 s/mm^2$$$, 180 directions with $$$b=7500 s/mm^2$$$) were acquired in the MGH 3T Skyra Connectom scanner, featuring a maximum gradient strength of $$$300 mT/m$$$. The T1-weighted data was processed in FreeSurfer to extract cortical parcellations and subcortical segmentations [5,6]. The diffusion data was corrected for eddy-current and magnetic susceptibility artifacts. Generalized q-sampling imaging analysis and tractography was performed in DSI-studio [7] to obtain 200K streamlines per subject . We clustered each subject's streamlines using our recently proposed anatomical similarity metric [8]. This approach represents each streamline by the set of anatomical segmentation labels that the streamline goes through or next to, everywhere along the streamline's trajectory. The histograms of anatomical neighbors in different directions (e.g., left-right, anterior-posterior, etc) are computed and compared between streamlines to quantify their similarity. We define the anatomical similarity between two streamlines $$$\mathbf{f}_i$$$ and $$$\mathbf{f}_j$$$ as: $$w_{\mbox{A}} (\mathbf{f}_i,\mathbf{f}_j)= | L_i \cap L_j | \sum_{l=1}^{P} \langle \mathbf{H}_{il} , \mathbf{H}_{jl} \rangle,$$ where $$$H_{i,l}$$$ is the histogram of neighboring labels of streamline $$$\mathbf{f}_i$$$ in direction $$$l$$$, $$$L_i$$$ is the full set of neighboring labels for streamline $$$\mathbf{f}_i$$$, and $$$\langle\cdot,\cdot \rangle$$$ is the inner product. We used normalized cuts, a hierarchical clustering method, with the above similarity metric and with a conventional similarity metric that evaluates the Euclidean distance between streamlines. We obtained 200 clusters per subject with each method. In this work our goal was to find corresponding clusters across subjects. For this purpose we implemented the Hungarian algorithm [9], a one-to-one assignment algorithm that minimizes global cost. We used our anatomical similarity metric and the Euclidean similarity metric as a cost function for comparing clusters across subjects. To evaluate Euclidean distances of clusters from different subjects, we registered each subject's fractional anisotropy (FA) map to the FMRIB FA template using the diffeomorphic Demons algorithm [10] and applied the registration to the tractography streamlines. Importantly, our anatomical similarity metric relies on histograms of anatomical labels computed in each subject's native space, and thus does not require registration.Results
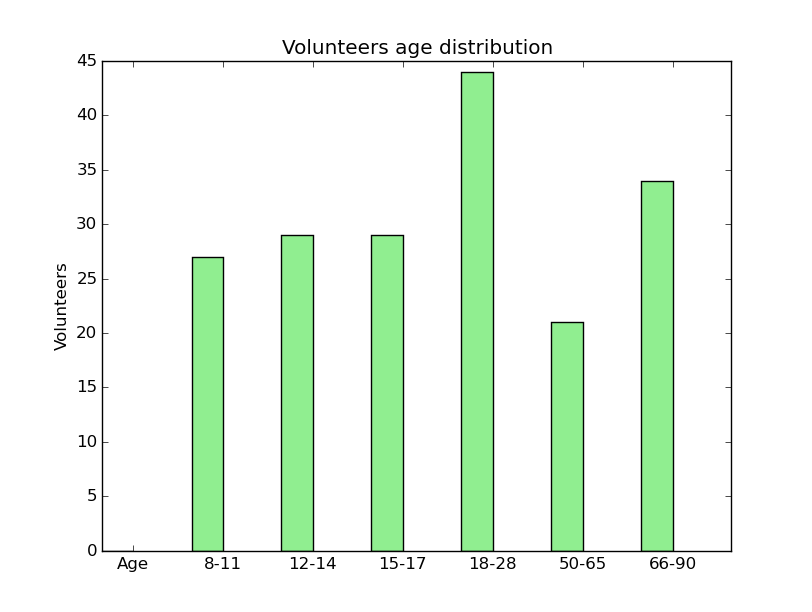
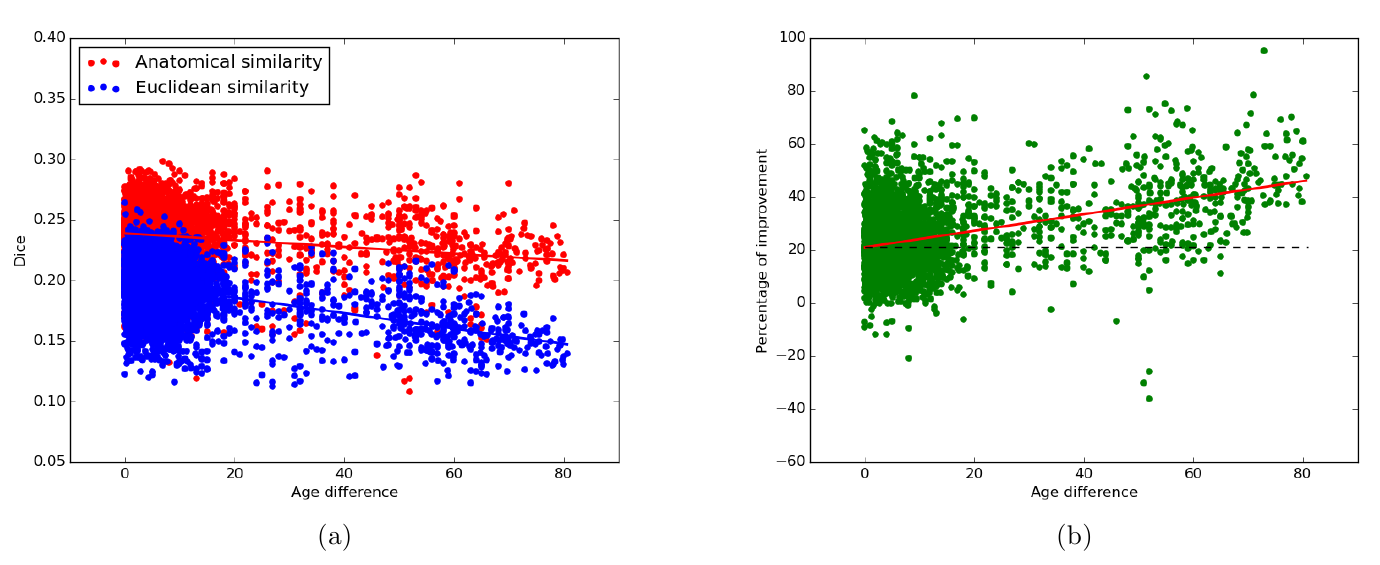
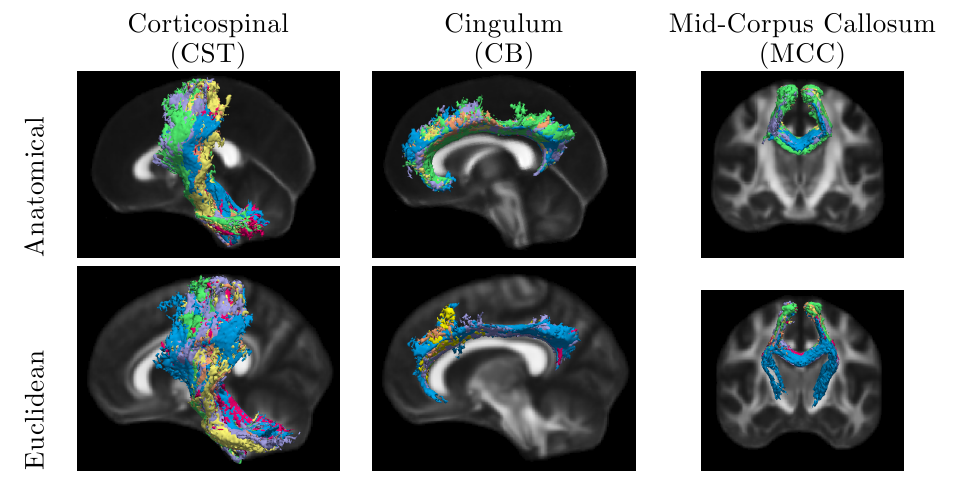
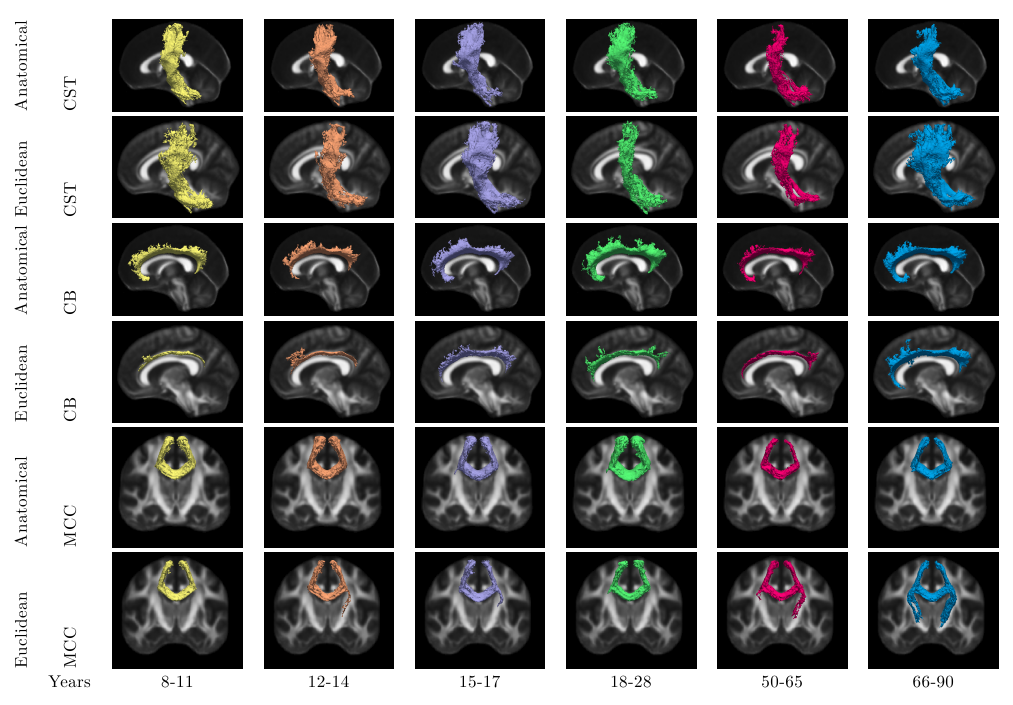
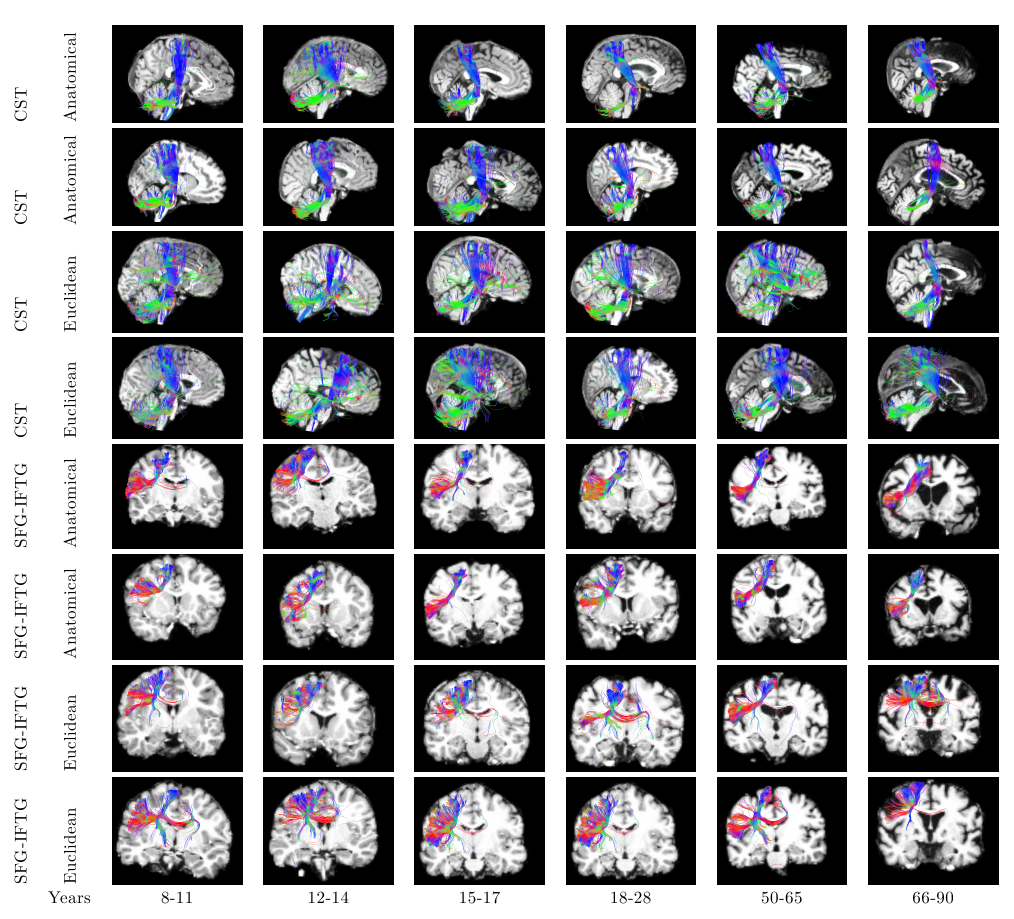
Figure 1 shows the age distribution of the subjects. Figure 2 shows the overlap of corresponding clusters across subjects in template space, quantified by the Dice coefficient ($$$\frac{2*|A.B|}{|A^2|+|B^2|}$$$) over the clusters' probability density images [11], as a function of the age difference between subjects. Each data point represents a pair of subjects. Figure 2(a) shows the Dice coefficient, averaged over all 200 clusters, for each pair of subjects with each similarity metric. Figure 2(b) shows the difference between the two metrics. Figures 3-5 show examples of clusters that go through specific anatomical regions. We display averages of the corresponding clusters from subjects within each age group. Figure 3 shows all age groups together and Figure 4 shows each age group separately. Isosurfaces represent voxels intersected by the clusters of at least 7 subjects. Figure 5 shows corresponding clusters from individual subjects.Discussion
As seen in Figure 2, clusters identified by the anatomical similarity metric have higher overlap across subjects than clusters identified by the Euclidean similarity. In addition, overlap deterioration as the age difference between subjects increases, is less pronounced when the anatomical similarity is used ($$$p<0.0001$$$ for similarity metric and age modeled with a GLM). Figures 3-5 illustrate that the anatomical similarity metric leads to clusters that are anatomically meaningful and more consistent across age groups.Conclusion
We have proposed a similarity metric for clustering tractography streamlines based on their anatomical neighbors. This provides an "anatomical signature'' of the clusters obtained in native space, which can be used to identify corresponding clusters across subjects without registration. We expect this method to facilitate individual and group analysis of tract-based biomarkers across the human lifespan.Acknowledgements
This research was supported by the Boston Adolescent Neuroimaging of Depression and Anxiety project (U01-MH108168) and the Harvard University Mind/Brain/Behavior Interfaculty Initiative Research Grant (to M.A. Sheridan & L.H. Somerville). Data were provided by the Human Connectome Project, MGH-USC Consortium (Principal Investigators: Bruce R. Rosen, Arthur W. Toga and Van Wedeen; U01MH093765) funded by the NIH Blueprint Initiative for Neuroscience Research grant; the National Institutes of Health grant P41EB015896; and was made possible by the resources provided by Shared Instrumentation Grants 1S10RR023401,1S10RR019307, and 1S10RR023043.References
[1] O'Donnell et al. Automatic tractography segmentation using a high-dimensional white matter atlas.IEEE Transactions on Medical Imaging, 26:1562–1575, 2007.
[2] Guevara et al. Robust clustering of massivetractography datasets. NeuroImage, 54(3):1975 – 1993, 2011.
[3] Tunc et al. Automated tract extraction via atlas based adaptiveclustering. NeuroImage, 102, Part 2:596 – 607, 2014.
[4] Fan et al. MGH-USC Human Connectome Project datasets with ultra-high b-value diffusion MRI. NeuroImage, 124, Part B:1108 – 1114, 2016.
[5] Fischl et al. Wholebrain segmentation: Automated labeling of neuroanatomical structures in the human brain. Neuron, 33(3):341 – 355, 2002.
[6] Fischl et al. Automatically parcellating the human cerebral cortex. Cereb Cortex, 14(1):11–22, 2004 Jan 2004.
[7] Yeh, Fang-Cheng, Van Jay Wedeen, and Wen-Yih Isaac Tseng, "Generalized-sampling imaging."Medical Imaging, IEEE Transactions on 29.9 (2010): 1626-1635.
[8] Siless et al. Hierarchical Clustering of Tractography Streamlines Based on Anatomical Similarity, pages 184–191. Springer International Publishing, Cham, MICCAI, 2016.
[9] Kuhn. The Hungarian Method for the assignment problem, Naval Research Logistics Quarterly, 2: 83–97, 1955.
[10] Vercauteren et al. Diffeomorphic demons: Efficient non-parametric image registration. Efficient non-parametric image registration. NeuroImage, 45(1, Supplement 1):S61 – S72, 2009. Mathematics in Brain Imaging.
[11] Roberts et al. Fiber density index correlates with reducedfractional anisotropy in white matter of patients with glioblastoma. American Journal of Neuroradiology, 26(9):2183–2186, 2005.
Figures