1267
Differentiated maturation of white matter tracts in early developing brain aged 0-3 yearsQinlin Yu1,2,3,4, Huiying Kang1,5, Qinmu Peng1,2, Minhui Ouyang1,2, Michelle Slinger1,2, Yun Peng5, Fang Fang3,4, and Hao Huang1,2
1Department of Radiology, Children’s Hospital of Philadelphia, Philadelphia, PA, United States, 2Department of Radiology, Perelman School of Medicine, University of Pennsylvania, Philadelphia, PA, United States, 3School of Psychological and Cognitive Sciences, Peking University, Beijing, People's Republic of China, 4Peking-Tsinghua Center for Life Science, Peking University, Beijing, People's Republic of China, 5Department of Radiology, Beijing Children’s Hospital, Capital Medical University, Beijing, People's Republic of China
Synopsis
The brain development in the first several years after birth is perhaps most dynamic. However, the studies on white matter maturation of infants and toddlers with relatively evenly distributed ages in 0-3 years are rare. Here, we charted white matter development in subjects 0-3 years-of-age through measurements of DTI-derived metrics at the tract level and tract-group level. A 3-stage maturational pattern was revealed for all white matter tracts. The differentiated maturation among the white matter tracts and tract groups was found using DTI measurements.
Purpose
The brain development in
the first several years after birth is perhaps most dynamic. The existing
studies on white matter maturation in infants and toddlers are limited by few
discrete time points [1] and by small sample size with DTI data that is
acquired across different sites [2]. The studies on white matter maturation in
the period of 0-3 years with relatively evenly distributed ages are rare. In
this study, we aimed to quantitatively delineate the maturational processes of white
matter tracts and tract groups for infants and toddlers, ages 0-3 years.Methods
Subjects and data acquisition: 68 infants and toddlers (37 females, age range from 2.0 to 37.2 months) were recruited. Diffusion MRI was acquired from a 3T Philips Achieva system using a single-shot EPI sequence. The dMRI imaging parameters were: TE = 100 ms, TR = 9300 ms, in-plane field of view = 256 x 256 mm2, in-plane imaging resolution = 128 x 128 mm2, slice thickness = 2 mm, slice number = 70, 30 independent diffusion encoding directions, b-value = 1000 sec/mm2, repetition = 2. Microstructural maturation of white matter tracts and tract groups: A digital white matter atlas JHU ICBM-DTI-81 (cmrm.med.jhmi.edu/) was used to parcellate white matter tracts and tract groups. Nonlinear registration, skeletonization and projection steps from TBSS from FSL (http://fsl.fmrib.ox.ac.uk/fsl/fslwiki/TBSS) were used to map the atlas labels to the white matter skeleton in the averaged FA maps in the atlas space, as shown in Fig. 1. The single-subject template used for nonlinear registration process in TBSS was identical to the template used for establishing the ICBM-DTI-81 atlas. Each skeleton voxel was categorized in one of the major tracts and one of the five tract groups: commissural, projection, brainstem, limbic and association tract group. Details of these procedures can be found in the literature [3]. The FA threshold at the white matter skeleton is 0.25 to keep only deep white matter with continuous skeleton voxels (shown in Fig 1b). Curve fitting: Average values of FA for each tract and tract group at the white matter skeleton and the subject ages were used for exponential fitting: FA = a•exp(-b•age) + c. To quantify developmental rates, three developmental sub-periods in 0-3 years were identified using the time points corresponding to the highest FA values. The top 1/9 and 1/3 of the highest FA values in the fitting curve were used as separation points, similar to the approach used in the literature [4]. In each sub-period, linear fitting was conducted for each tract and tract group to delineate the characteristic rapid-to-slow maturation of the white matter tracts.Results
Rapid-to-slow maturation: With genu of corpus callosum (GCC) as a representative white matter tract, exponential curve fits best for the cross-sectional age-related increases of FA measurements (Fig 2). In the three sub-periods during the age of 0-3 years, FA measurements increase rapidly initially, then slow down and reach a stage with plateaued maturation (Fig 2). Differentiated maturation of white matter tracts and tract groups: Distinctive FA developmental trajectories among the tracts and tract groups are shown in Fig 3 and Fig 4, respectively. FA values of the commissural tracts in the entire age range of 0-3 years are much higher than other tracts such as the superior longitudinal fasciculus (Fig 3). Fig 4 shows that the rate of FA increase of the commissural tract group is also much larger than other tract groups, while the rate of FA increase of limbic and association tract groups appear to be the smallest. Fig. 5 shows the timing and magnitude of maturational rate in all measured tract groups. The quantified FA maturational rate clearly reveals that the maturation in association and limbic tract groups develop more slowly than that of the commissural, projection and brainstem tract groups.Discussion and conclusion
The developmental period of 0-3 years is characterized by rapid-to-steady maturation for all white matter tracts and tract groups. The maturation in association and limbic tract groups develop more slowly than commissural, projection and brainstem tract groups. With relatively limited diffusion MRI data of infants and toddlers with evenly distributed cross-sectional ages, the present study on differentiated white matter maturation in the age of 0-3 years fills the knowledge gap of understanding white matter maturation from birth to adulthood. Among the white matter tracts, the FA values of commissural tracts increase faster than other tract groups. The quantitative white matter maturational trajectories of the normal developing brain will provide reference standards for “pre-“diagnostic risk assessment, filling a gap towards precision health for infants and toddlers.Acknowledgements
This study is funded by NIH MH092535, MH092535-S1 and HD086984.References
[1] Geng et al. (2012) NeuroImage 61: 542.
[2] Hermoye et al. (2006) NeuroImage 29: 493.
[3] Ouyang et al. (2016) HBM 37: 819.
[4] Lebel et al. (2008) NeuroImage 40: 1044.
Figures
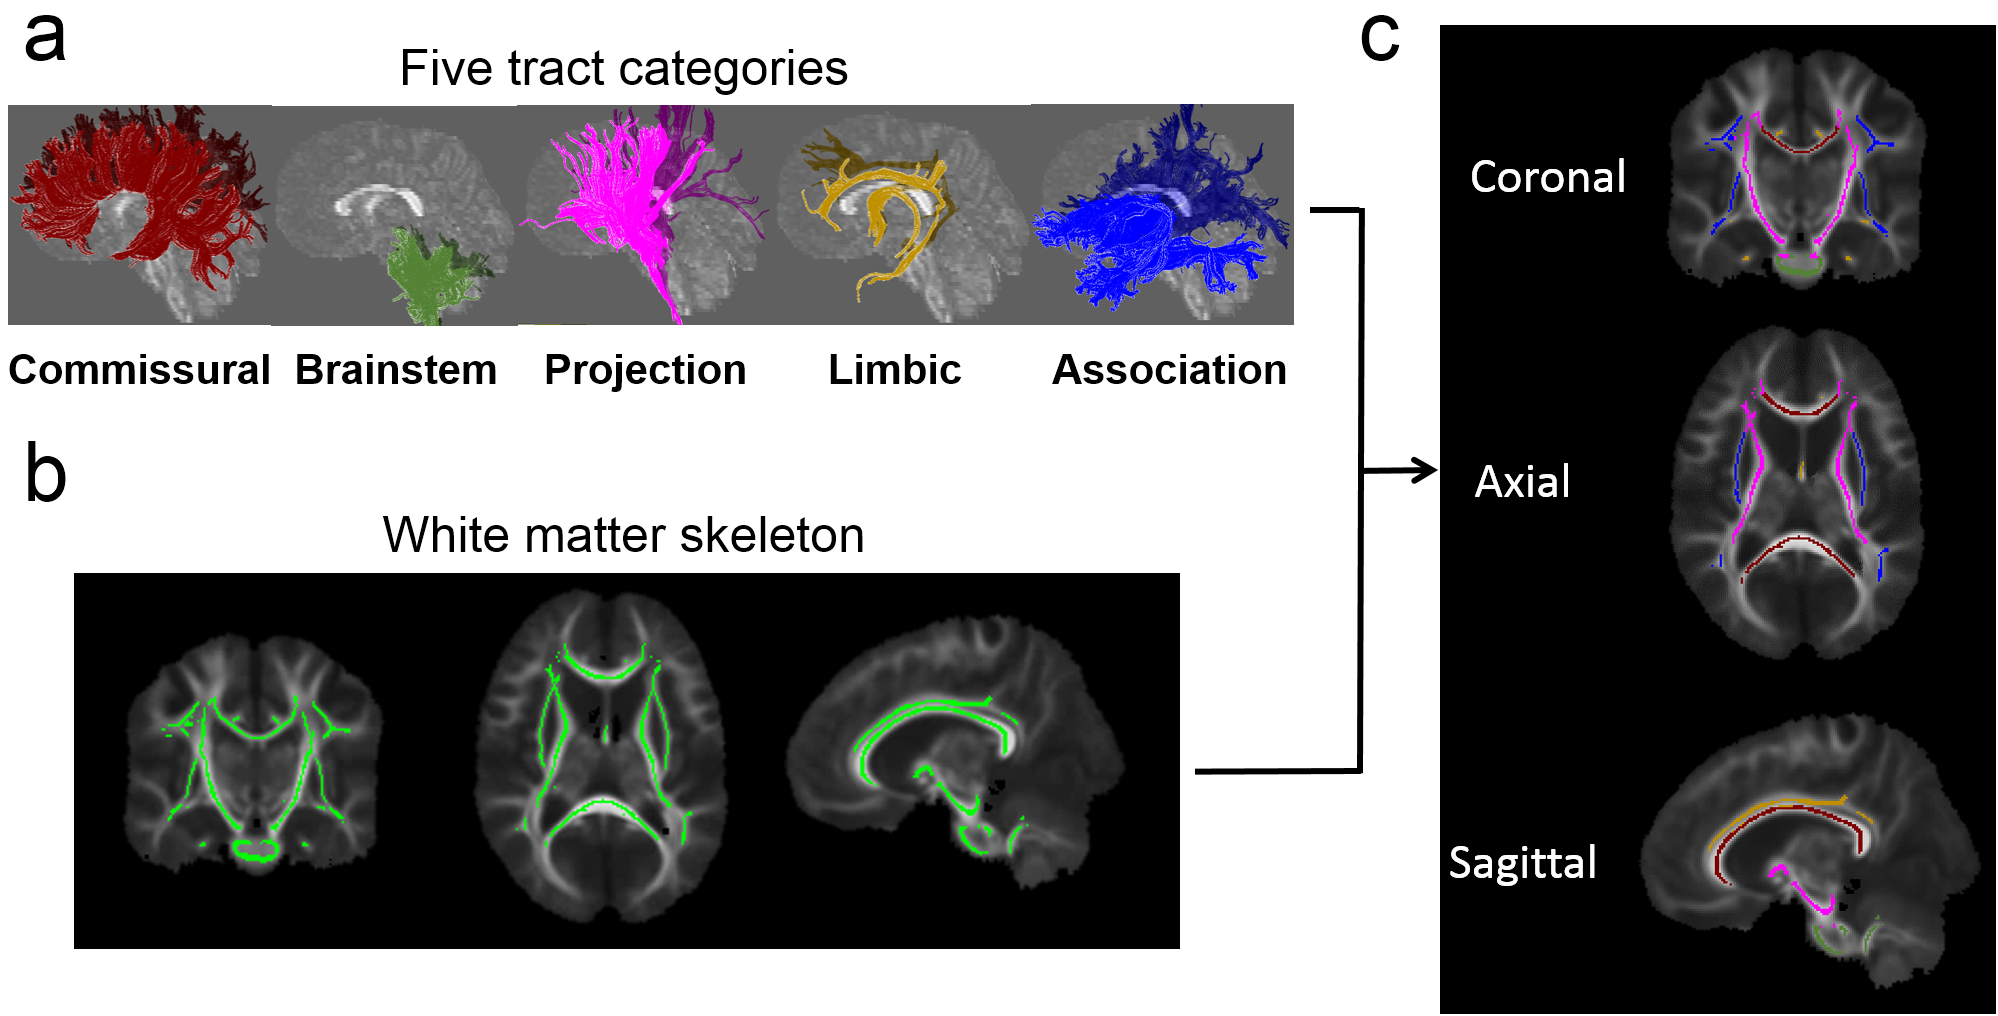
Figure 1: Flow chart of categorization
of five tract groups in white matter skeleton. (a) 3D reconstructed white
matter tract groups: commissural, brainstem, projection, limbic and association
tract groups in sagittal view. (b) The skeleton of the entire white matter. (c)
The white matter skeleton subdivided into 5 tract groups with the tract group
colors consistent to those shown in (a).
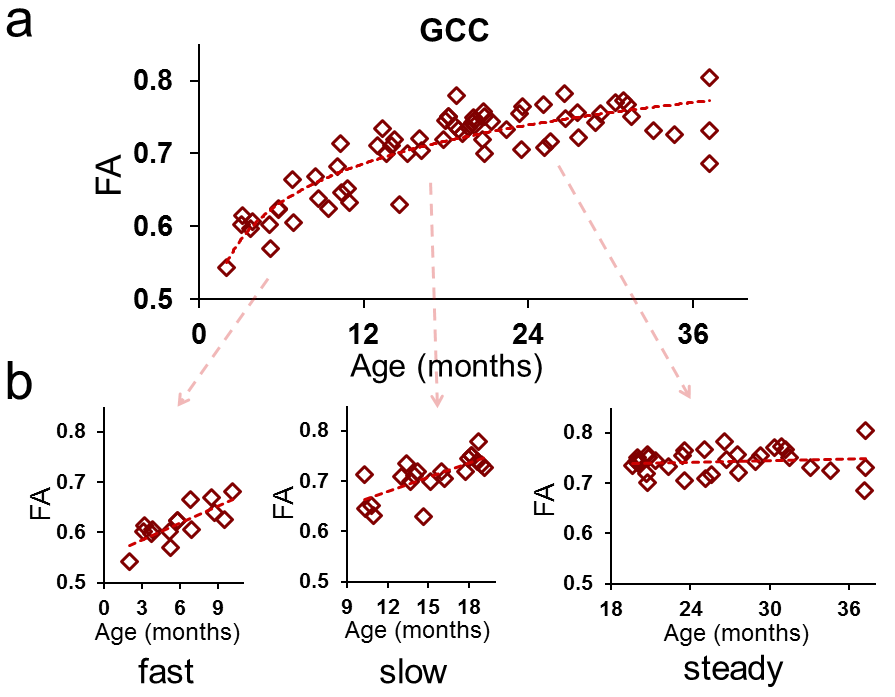
Figure 2: FA maturational
processes in a representative white matter tract (genu of corpus callosum or
GCC), (a) divided into 3 sub-periods in (b). In the first ten months FA
measurements of GCC increase fast, then slow down between 10th month and 20th
month, and reach a steady period lasting sixteen months from 20th month.
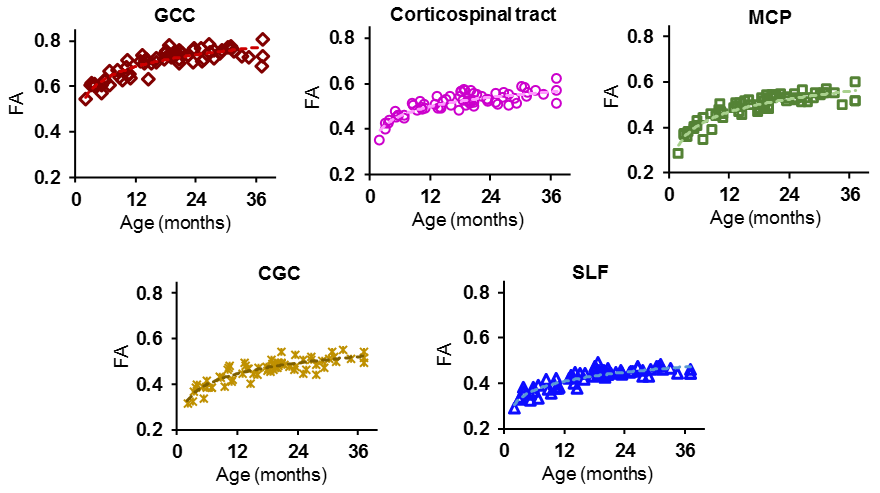
Figure 3: Differentiated
maturation among different white matter tracts with FA-age plot of a
representative tract from each of 5 tract groups. GCC = genu corpus callosum,
MCP = middle cerebellar peduncle, CGC = cingulum of the cingulate gyrus part,
SLF = superior longitudinal fasciculus.
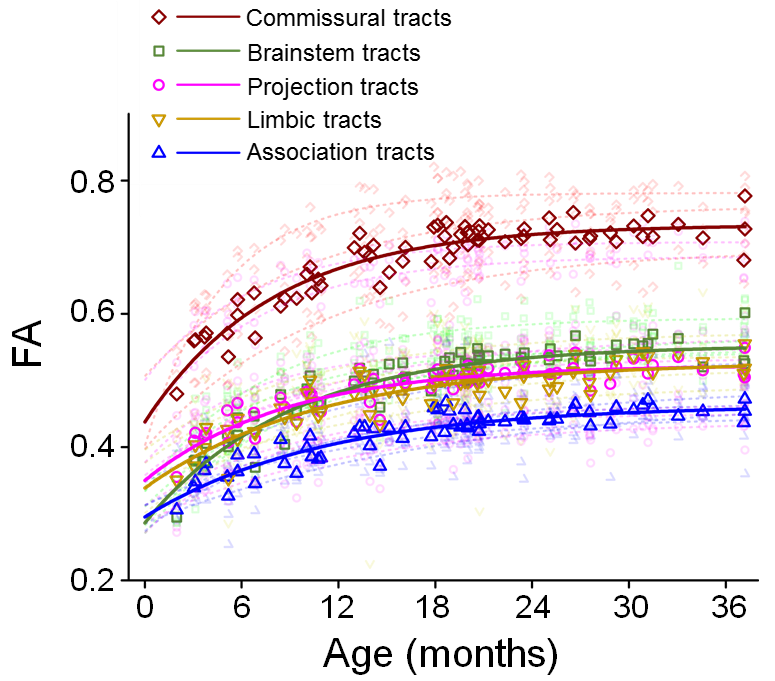
Fig. 4: Differentiated
maturation among different white matter tract groups. The fitted curves of FA
measurements averaged from the tract group were plotted in solid line and the
fitted curves of FA measurements from individual white matter tracts were
plotted in semi-transparent dashed lines in the same color.
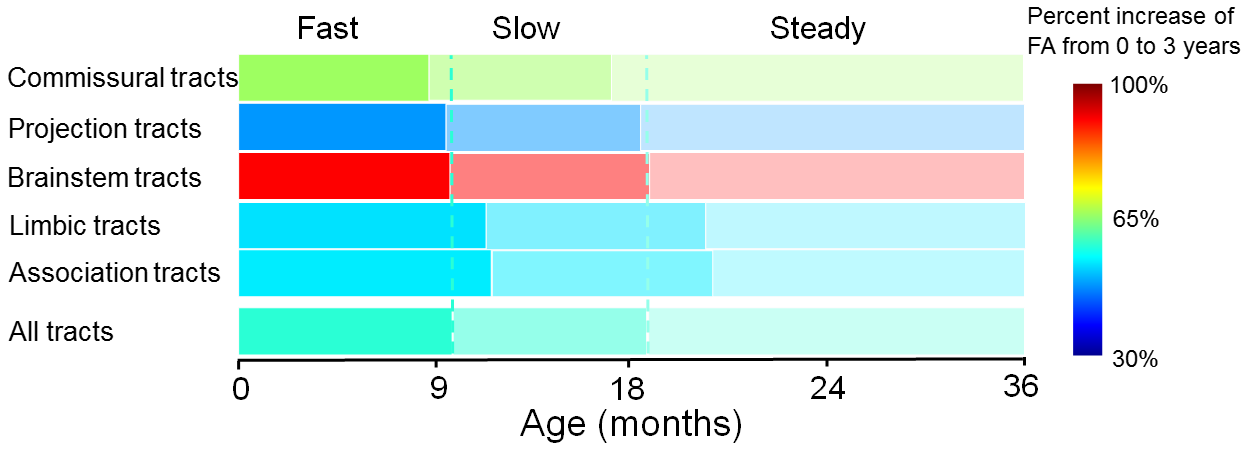
Figure
5: The maturational rate and timing vary by white matter tract group. The three
sub-periods were obtained by the segmenting process shown in Fig 2. The color bar
encodes the percentage of FA increases. The commissural and brainstem tracts
have a larger percent increase than projection, limbic and association tracts.
The commissural, projection and brainstem tracts mature earlier than limbic and
association tracts.