1265
Simultaneous Multi-Slice Phase Contrast Imaging for Pulse Wave Velocity Measurement in the Vessel1Siemens Healthcare, Columbus, OH, United States, 2Siemens Healthcare, Chicago, IL, United States, 3Application Development, Siemens Healthcare, Erlangen, Germany, 4Siemens Healthcare, Minneapolis, MN, United States, 5Center for Magnetic Resonance Research-Radiology, University of Minnesota, Minneapolis, MN, United States
Synopsis
Pulse wave velocity can be derived from sequential 2D phase contrast measurements in multiple breath-holds, resulting in a long scan time and patient discomfort. Physiological conditions, may change during the measurement series, leading to flow waveform shifts and hence errors in PWV estimation. We developed a prototype SMS cine-PC sequence to measure blood flow in multiple slices simultaneously and applied it to measure PWV in the aorta.
Purpose
Pulse wave velocity (PWV) is an important biomarker directly related to changes in aortic compliance and the presence of atherosclerosis. It is an independent predictor of cardiovascular mortality and stroke (1, 2). PWV can be derived from multiple sequential blood flow waveform measurements in different 2D planes transecting the aorta using the conventional 2D single-slice cine phase contrast (PC) sequence (3). Multiple breath-holds would normally be required to suppress respiratory motion artifacts, resulting in a long scan time and patient discomfort. Furthermore, physiological conditions, such as heart rate, intra-thoracic pressure, or blood pressure, may change during the measurement series, leading to flow waveform shifts and hence errors in PWV estimation. Recently, simultaneous multi-slice (SMS) imaging has been developed to allow simultaneously exciting and acquiring multiple parallel slices in one acquisition (4). In this study, we developed a prototype SMS cine-PC sequence to measure blood flow in multiple slices simultaneously. SMS imaging may help improve imaging efficiency of PC MR and remove the potential influences from physiological variations between multiple measurements. We validated the accuracy of the newly proposed SMS cine-PC sequence then applied it to measure PWV in the aorta.Methods
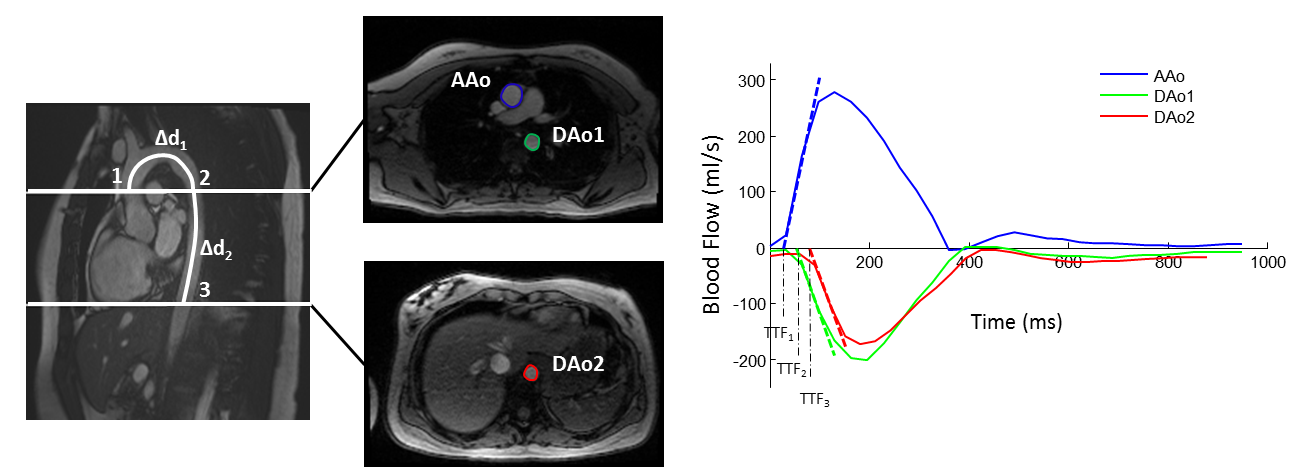
A 2D cine-PC sequence with retrospective ECG gating was modified in-house to enable SMS acceleration. A separate low resolution multi-slice GRE scan was added as the reference scan to calibrate the receiver coil sensitivities (5). Two slices are simultaneously acquired with CAIPIRINHA FOV/3 shift (4). Imaging parameters for cine-PC: TE/TR = 2.47/4.64 ms, temporal resolution = 37.36 ms, BW = 450 Hz/Pixel, FA = 15°, iPAT = 2, imaging matrix = 192×130, VENC = 150 cm/s, slice thickness = 6 mm with 90 mm slice distance. Imaging was performed on a Siemens 1.5T clinical MR scanner (MAGNETOM Aera, Siemens Healthineers, Erlangen, Germany) with body matrix and spine coils for signal reception. 5 volunteers were enrolled in the study (3 males, mean age 54.4±14.4). Two parallel slices transecting the aorta with the upper slice placed at the level of main pulmonary artery were acquired simultaneously by SMS cine-PC in a single breath-hold and by the conventional 2D single-slice cine-PC in two separate breath-holds as comparison (Figure. 1a). The total acquisition time for SMS-PC and single-slice cine-PC was 20 seconds with a heart rate of 60 beats/min. Background phase correction was applied to the phase images by first-order fitting of the static tissue using orthogonal regression. Three velocity waveforms were derived; one from the ascending aorta (AAo) and two from the descending aorta (DAo1 and DAo2). Time-to-foot (TTF) was extracted from the velocity waveforms by fitting a line to the upslope portion of the waveform and was defined as the intersection of the fitted line with the late diastolic baseline (Figure. 1b). PWVs between AAo and DAo1 and between DAo1 and DAo2 were calculated separately as:
PWVAAo, DAo1 = ∆d1/(TTF1 – TTF2)
PWVDAo1, DAo2 = ∆d2/(TTF2 – TTF3)
∆d1 and ∆d2 are the distance between the vessel cross sections, typically around 100 mm. The time difference between TTF is around 10-20 ms. The global mean PWV was determined as Mean(PWV) = (PWVAAo, DAo1 + PWVDAo1, DAo2)/2. The absolute difference between PWVAAo, DAo1 and PWVDAo1, DAo2 (∆PWV) was also calculated to check the consistency of the PWV measured across the aorta.
Results
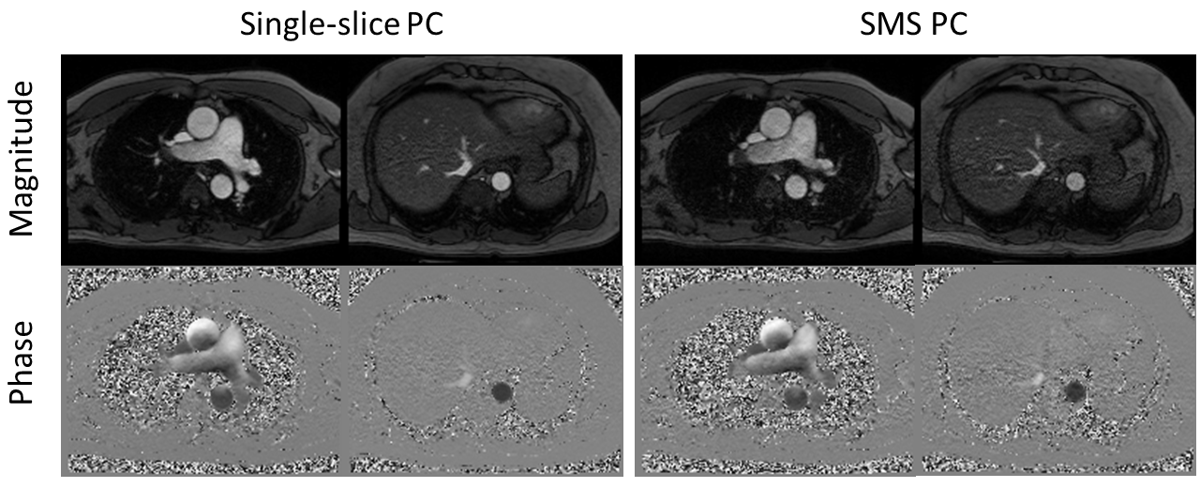
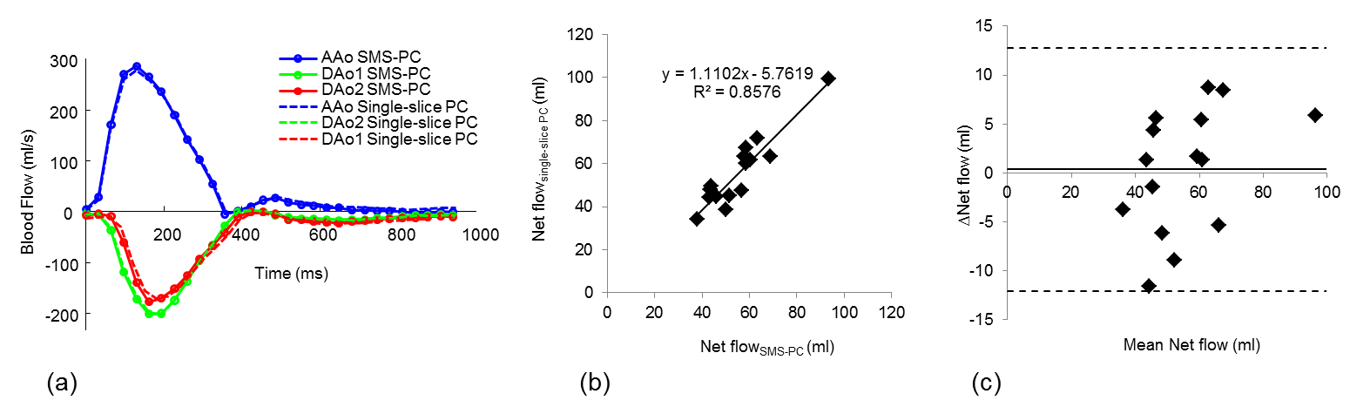
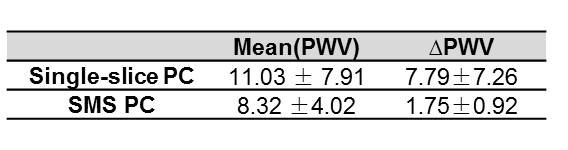
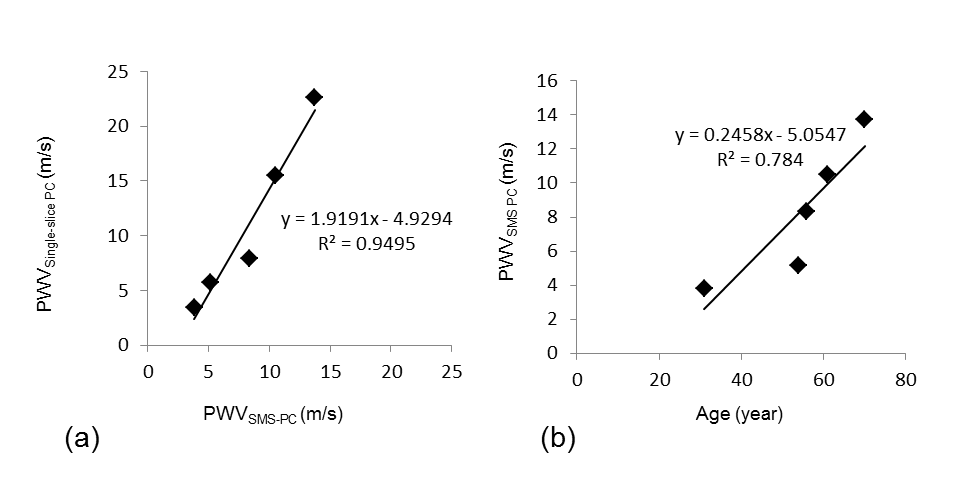
The representative magnitude and phase images from the upper and lower slice exhibit similar image quality compared to those obtained by single-slice PC (Figure 2). ROIs were drawn on AAo, DAo1 and DAo2 to quantify blood flow. Figure 3a shows similar flow curves measured by SMS-PC and single-slice PC. There were no significant differences between net flow measured by SMS-PC and that measured by single-slice PC (p = 0.83) (Figure 3b,c). The mean(PWV) and ∆PWV from SMS-PC and single-slice PC were in Table 1. The measurements were not significantly different (p = 0.21, Figure 4a), while ∆PWV was lower using SMS-PC, suggesting that there might be some physiological variations during the data acquisition when the two slices are acquired separately using the conventional acquisition. Figure 4b suggested that there is a strong correlation of PWV with age.Conclusion and Discussion
We developed a SMS-PC sequence that enables simultaneous blood flow measurements at multiple slices within a single acquisition. Compared with the conventional single-slice technique, SMS imaging effectively reduced the total acquisition time by the factor of slice acceleration and eliminates velocity variability due to physiological changes between the single-slice measurements. Thus SMS-PC has the potential to improve consistency and accuracy blood flow and PWV measurements.Acknowledgements
No acknowledgement found.References
(1) Farrar et al Circulation 1991;83:1754–1763.
(2) Wentland AL et al. Cardiovasc Diagn Ther 2014;4(2):193-206.
(3) Lehmann ED. Pathol Biol (Paris) 1999;47:716–730.
(4) Barth M et al. MRM 2016;75(1):63-81.
(5) Wang, ISMRM 2013
Figures