1260
Improving left ventricular 4D Flow MRI analysis using intensity based image registration with cine-bSSFP images1Department of Medical and Health Sciences, Linköping University, Linköping, Sweden, 2Center for Medical Image Science and Visualization (CMIV), Linköping University, Linköping, Sweden, 3Department of Physiology, Linköping University, Linköping, Sweden
Synopsis
Characterization of blood flow through the left ventricle (LV) using 4D Flow MRI requires accurate segmentation of the underlying anatomy. The combination of poor resolution and low contrast in 4D flow MR images, however, makes the LV segmentation challenging and prone to observer bias. We propose an image registration based approach that allows reliable and automatic correction of LV segmentations in 4D Flow images using the high contrast in routinely acquired 2D cine-MR images. The proposed approach is shown to achieve high in plane spatial accuracy and comparable values of blood flow parameters when evaluated against manually obtained expert segmentations of 4D flow MR images.
Purpose
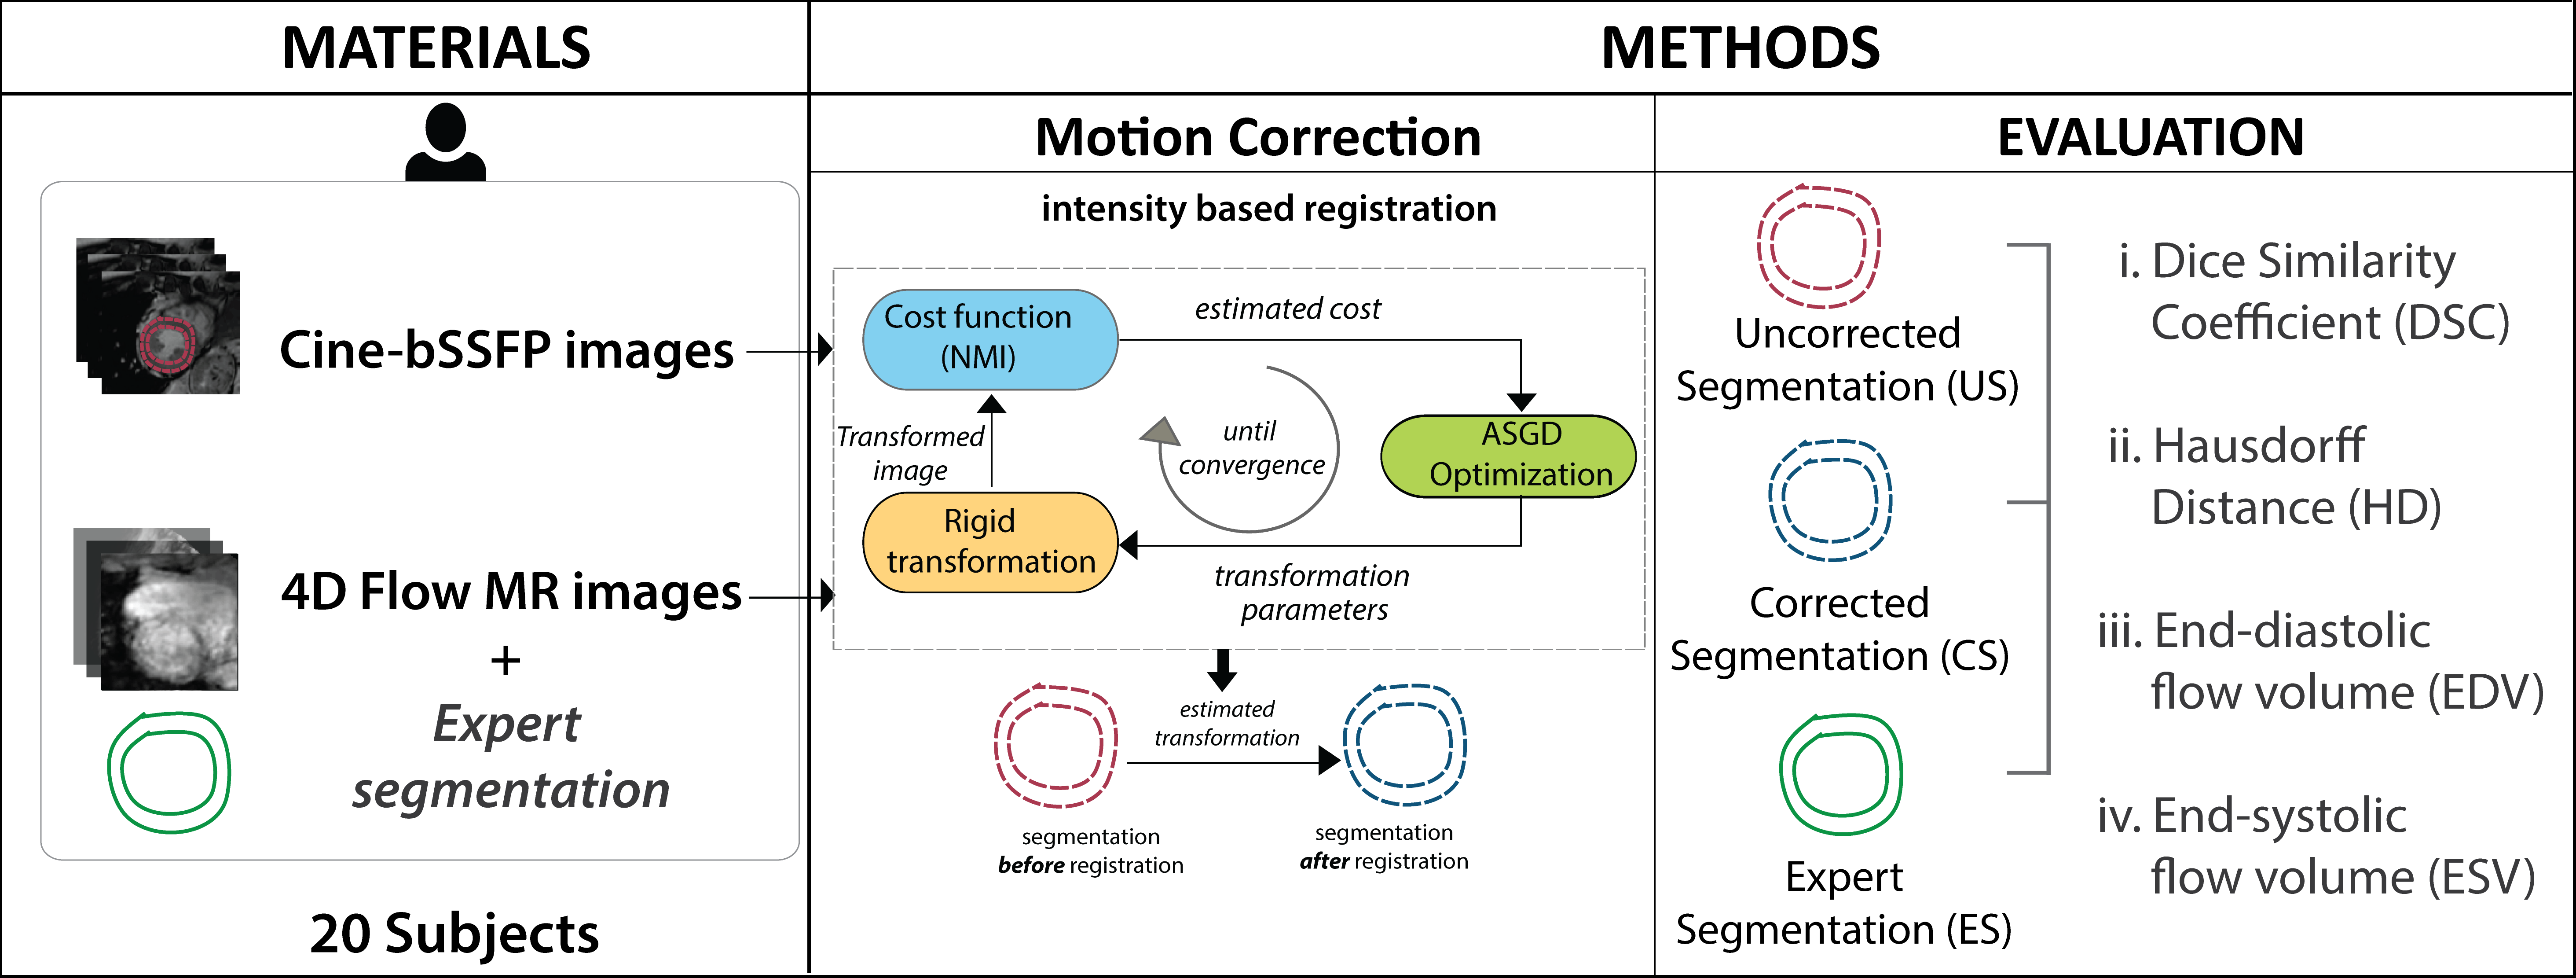
Quantification of left ventricular (LV) blood flow from 4D Flow MRI requires accurate LV segmentation, which is hampered by low contrast between blood and myocardium. Cine balanced Steady-State Free Precession (cine-bSSFP) images are often used as surrogates for the desired segmentation. They are routinely included in standard cardiac MR acquisitions, and offer higher in-plane resolution and better contrast than the 4D Flow MR images. Cine-bSSFP images, however, suffer from motion artifacts due to patient movement and respiration, and as such, require a robust alignment to the corresponding 4D Flow MR images for reliable LV segmentations and subsequent blood flow analysis. We propose an intensity based registration approach with optimized parameters for the current application to perform such an alignment.Method
The 4D Flow and cine-bSSFP MR images were brought into spatial alignment using a transformation, $$$\hat{T}$$$, estimated by maximizing a cost function or similarity measure, $$$\phi$$$, as described in the following equation1:
$$\hat{T}=\arg\max _{T}\phi(T(I_{t}),I_{r}),\quad\quad(1)$$
where, $$$I_{r}$$$ and $$$I_{t}$$$ represent reference (4D Flow) and target (cine-bSSFP) images, respectively.
An intensity based rigid registration approach was adopted as it does not require a prior feature extraction (landmark positions, surfaces, etc.), and is less susceptible to noise and outliers2. Although the underlying signal in both cine-bSSFP and 4D Flow images comes from MR and represents the same anatomical regions, the intensities differ considerably between these images. Normalized mutual information, being relatively insensitive to such intensity differences, was used as the similarity measure in equation 1.
To make the proposed method unsupervised, we used an adaptive stochastic gradient descent optimization strategy3. It performs computationally efficient random data sampling for gradient calculation without the need to select the step-size a priori. Additionally, a coarse-to-fine multi-resolution scheme was implemented to avoid local minima and to achieve fast convergence. Figure 1 shows an overview of the method and its validation.
The proposed method was evaluated in 20 subjects: 10 healthy volunteers with no history of prior or current cardiovascular disease, and 10 patients with ischemic cardiomyopathy (CMP) or idiopathic dilated CMP. MRI examinations were performed on a clinical 3T Philips Ingenia scanner (Philips Healthcare, Best, the Netherlands). A short-axis stack of cine-bSSFP images was acquired at end-respiratory breath-holds with resolution of 1x1 mm and slice thickness of 8 mm. 4D Flow data was acquired during free-breathing using navigator and retrospective cardiac gating. Scan parameters included: Velocity encoding (VENC) 120 cm/s, acquired temporal resolution of 52.8 ms, spatial resolution 2.8 mm isotropic and elliptical k-space acquisition.
The evaluation of the method was performed using three variants of an expert drawn segmentation: uncorrected (US), automatically corrected (CS), and expert corrected (ES). US refers to the original LV segmentation on cine-bSSFP images, which were transformed with $$$\hat{T}$$$ in equation 1 to obtain CS. Alignment of US by an expert to match LV anatomy in 4D Flow images resulted in ES. These segmentations were used to assess both the geometric accuracy of the method and its effect on blood flow analysis. A 2-sided Wilcoxon signed rank test was used for significance testing. Geometric accuracy was assessed with two measures: Dice similarity coefficient4 (DSC) and Hausdorff distance5 (HD). Blood flow analysis employed particle tracing to analyze the left ventricular flow connectivity6 and to compute end-diastolic (EDV) and end-systolic (ESV) volumes.
Results
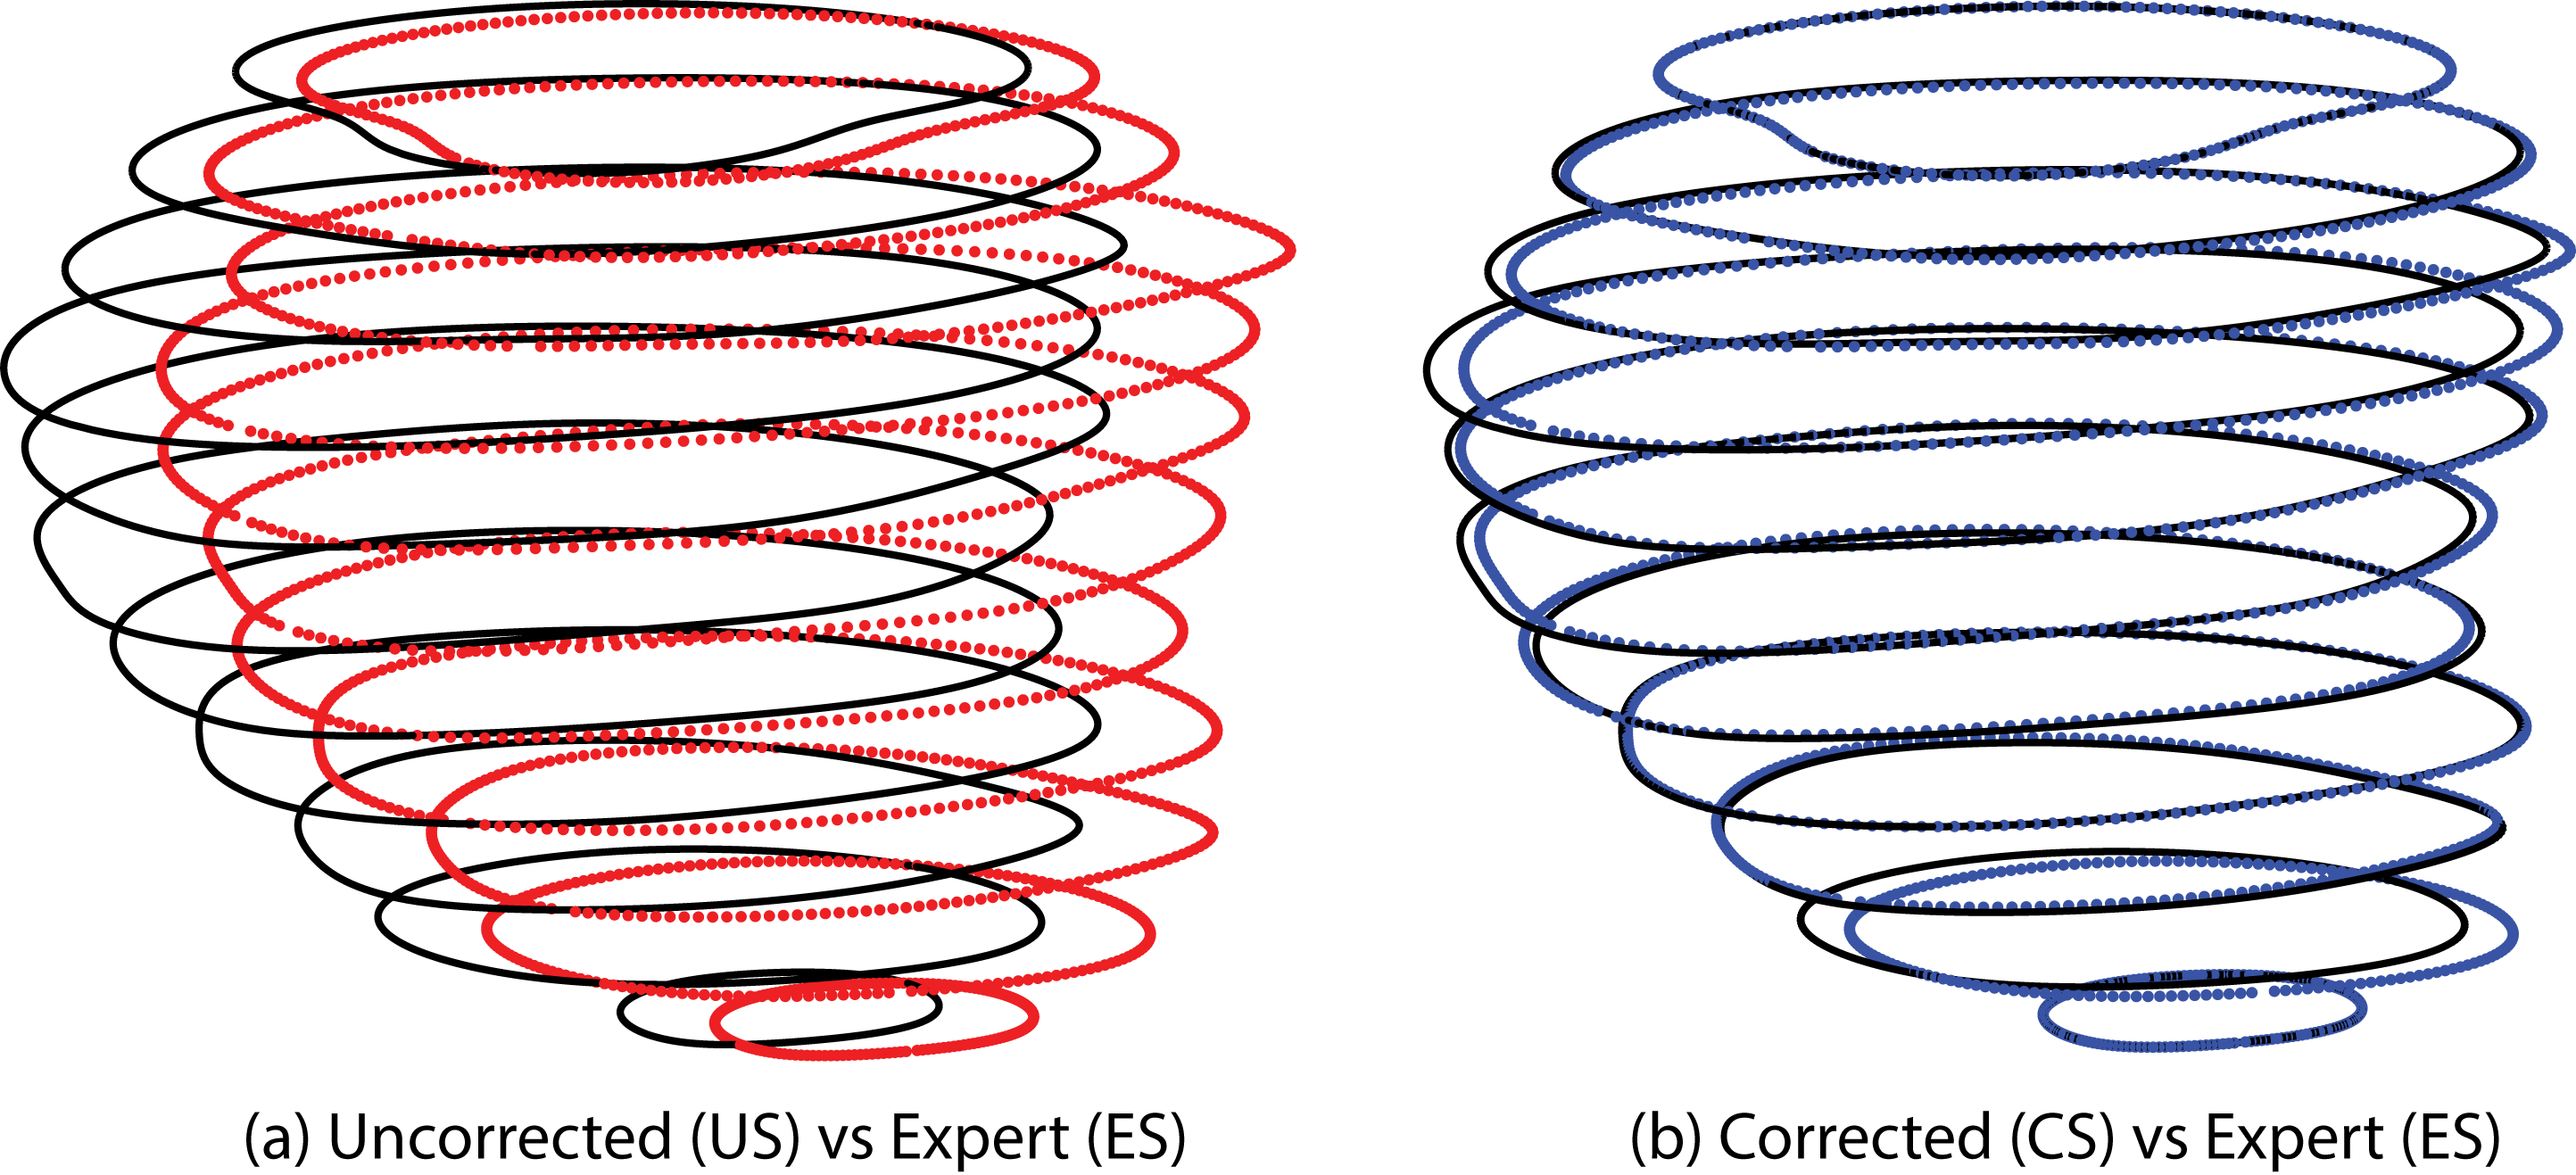
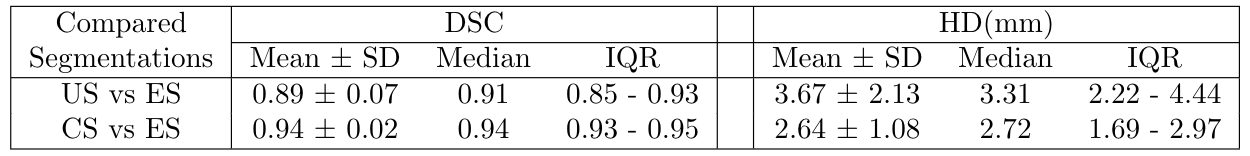
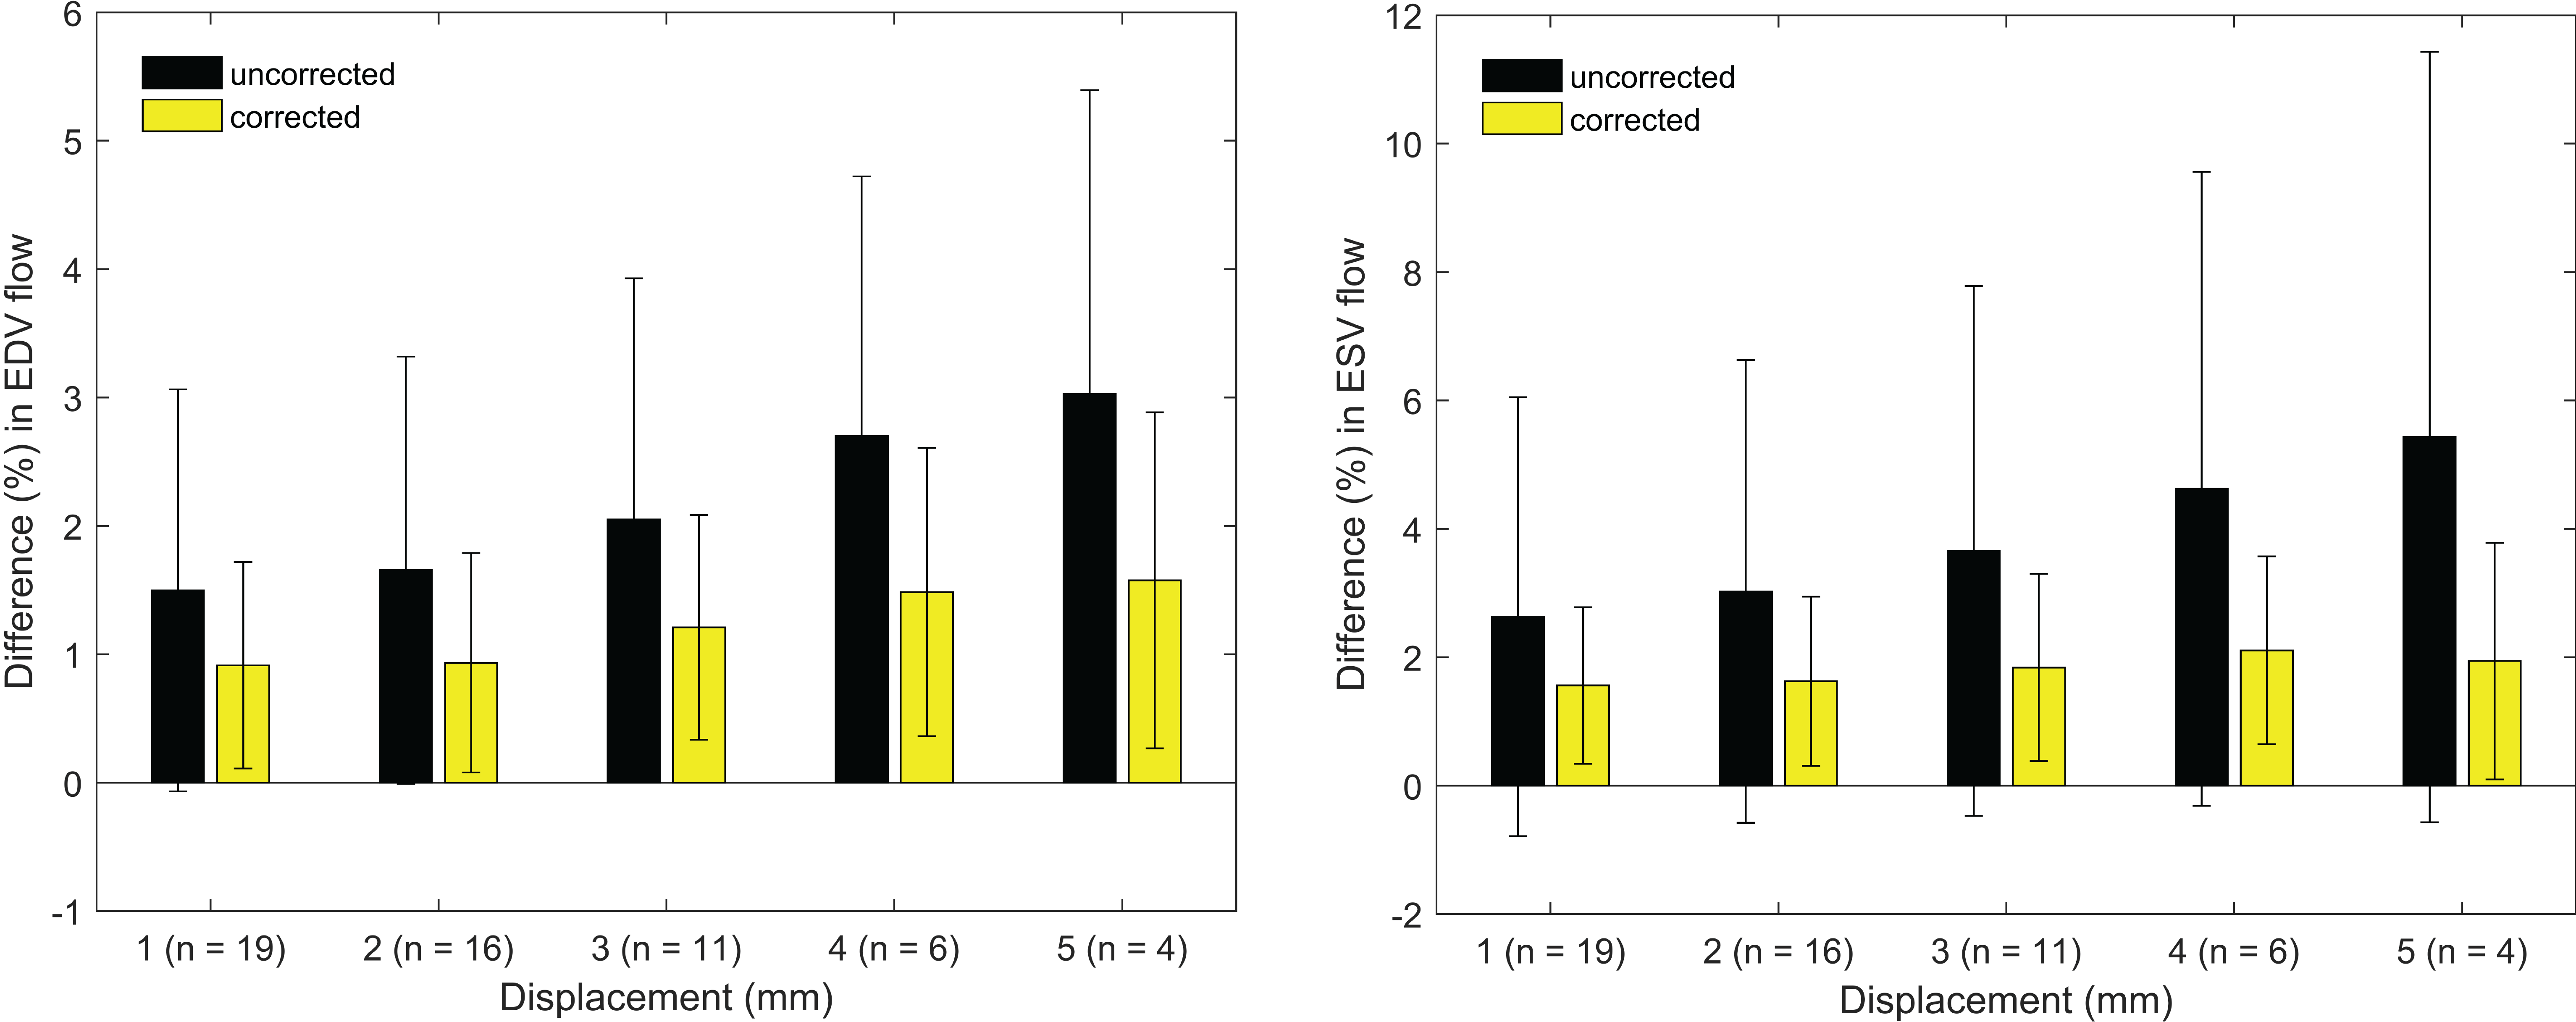
Correction with the proposed approach resulted in reduced in-plane misalignments (Figure 2) also reflected by average DSC and HD of 94% and 2.6 mm, respectively (Table 1). A similar pattern was indicated by region wise measures in Figure 3. Differences with respect to ES in EDV and ESV increased significantly (p<0.01) with higher displacements (Figure 4).Discussion
The proposed method is particularly suitable for clinical use due to its preclusion of any manual preprocessing, elimination of intra-observer bias and fast processing time (2-3 min/subject).
Its potential was demonstrated by significant (p<0.01) improvements in geometric accuracy for the entire cohort. Of particular importance were the lower variations in both DSC and HD that showed its robustness. Mid-ventricular and basal regions showed better performance compared to the apex, which had poor visibility, thus hampering its segmentation even by an expert.
Improved geometric accuracy also led to insignificant differences (p>0.8) in both EDV and ESV, obtained using ES and CS. Furthermore, compared to the US, the variation in such differences remained consistently low with CS, also for the cases with high displacements.
Conclusion
We proposed an unsupervised intensity based registration approach for improving LV segmentations in 4D Flow MRI. Evaluation of the proposed method resulted in geometric accuracy and blood flow differences on par with an expert.Acknowledgements
This work was supported by the European Research Council [grant number 310612], the Swedish Heart and Lung foundation [grant number 20140398], the Swedish Research Council [grant number 621-2014-6191].References
1. Klein S, Staring M, Murphy K, Viergever MA, Pluim JP. Elastix: a toolbox for intensity-based medical image registration. IEEE transactions on medical imaging 2010;29(1):196–205. 15.
2. Gupta V, Kirisli HA, Hendriks EA, van der Geest RJ, van de Giessen M, Niessen W, Reiber JH, Lelieveldt BP. Cardiac MR perfusion image processing techniques: A survey. Medical Image Analysis 2012;16(4):767 – 785
3. Qiao Y, Lew B, Lelieveldt B, Staring M. Fast Automatic Step Size Estimation for Gradient Descent Optimization of Image Registration. IEEE Trans Med Imaging 2015;35(2):391–403.
4. Dice LR. Measures of the Amount of Ecologic Association Between Species. Ecology 1945;26(3):297–302. 21.
5. Hausdorff F. Set Theory. American Mathematical Soc., 1957. 22.
6. Eriksson J, Carlhäll CJ, Dyverfeldt P, Engvall J, Bolger AF, Ebbers T. Semi-automatic quantification of 4d left ventricular blood flow. Journal of Cardiovascular Magnetic Resonance 2010;12(1):1–10.
Figures