1258
4D Flow MRI in the Post-Myocardial Infarction Left Ventricle1Medical Physics, University of Wisconsin - Madison, Madison, WI, United States, 2Medicine, Cornell University, New York, NY, United States, 3Radiology, University of Wisconsin - Madison, Madison, WI, United States
Synopsis
Left ventricular thrombus (LVT) formation is a serious complication of anterior ST segment elevation myocardial infarction (MI) that impacts prognosis. LVT has been linked to blood stasis in the LV apex, but conventional predictors of LVT formation are limited. This study employed 4D-flow MRI as a new means of quantifying MI induced alterations in LV flow physiology. Among a mixed cohort of post-MI subjects and controls, 4D-flow MRI demonstrated MI to be associated with increased flow stagnance in the LV apex. These findings will inform use of 4D-flow MRI in future studies to predict longitudinal risk for post-MI LVT.
Purpose
Left ventricular thrombus (LVT) is a serious complication of anterior ST segment elevation myocardial infarction (MI). LVT typically localizes to the LV apex in patients with contractile dysfunction and can be transient (e.g. due to transient contractile dysfunction early post-MI), and potentially resolvable via anticoagulation. Informed therapeutic decision-making requires an accurate means of identifying patients at greatest risk for LVT, but conventional LVT predictors are limited. Previous work in the left atrium has demonstrated correlations between blood stasis and thrombus formation1, but LV flow dynamics after MI has not been systematically studied. We hypothesize that physiologic reductions in apical blood flow are augmented after anterior MI, providing a potential nidus for LVT formation. In this feasibility study, we employed 4D Flow MRI to characterize post-MI LV apical flow physiology.Methods
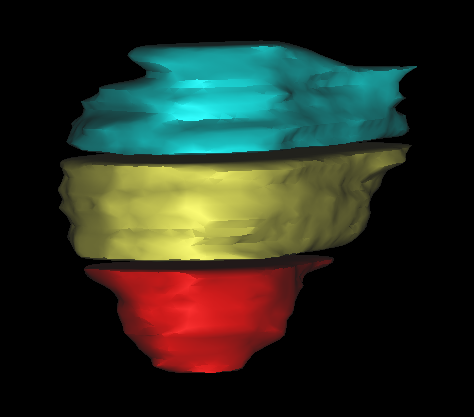
6 subjects (3 post anterior MI [3M,68±1 yo, LAD infarct related artery], 3 normative controls [2M,1F,53±5 yo] were imaged on a clinical 1.5T or 3.0T system (Optima MR450/Discovery MR750, GE Healthcare). 4D Flow cardiac MRI was performed with an ECG-gated, radially-undersampled acquisition (PC-VIPR2, TR/TE=5.8/1.9ms; FA=12°; VENC=150m/s; FOV=32x32x32cm; resolution=1.25mm isotropic; scan time=578s; temporal resolution=74ms). The LV was segmented from time-averaged magnitude images (PC-VIPR) using Mimics (Materialize). The segmented LV was divided into 3 equidistant regions (base, mid, apex; Fig. 1). A custom MATLAB tool was used to perform a histogram analysis of velocity magnitude during diastole and systole in each region.Results
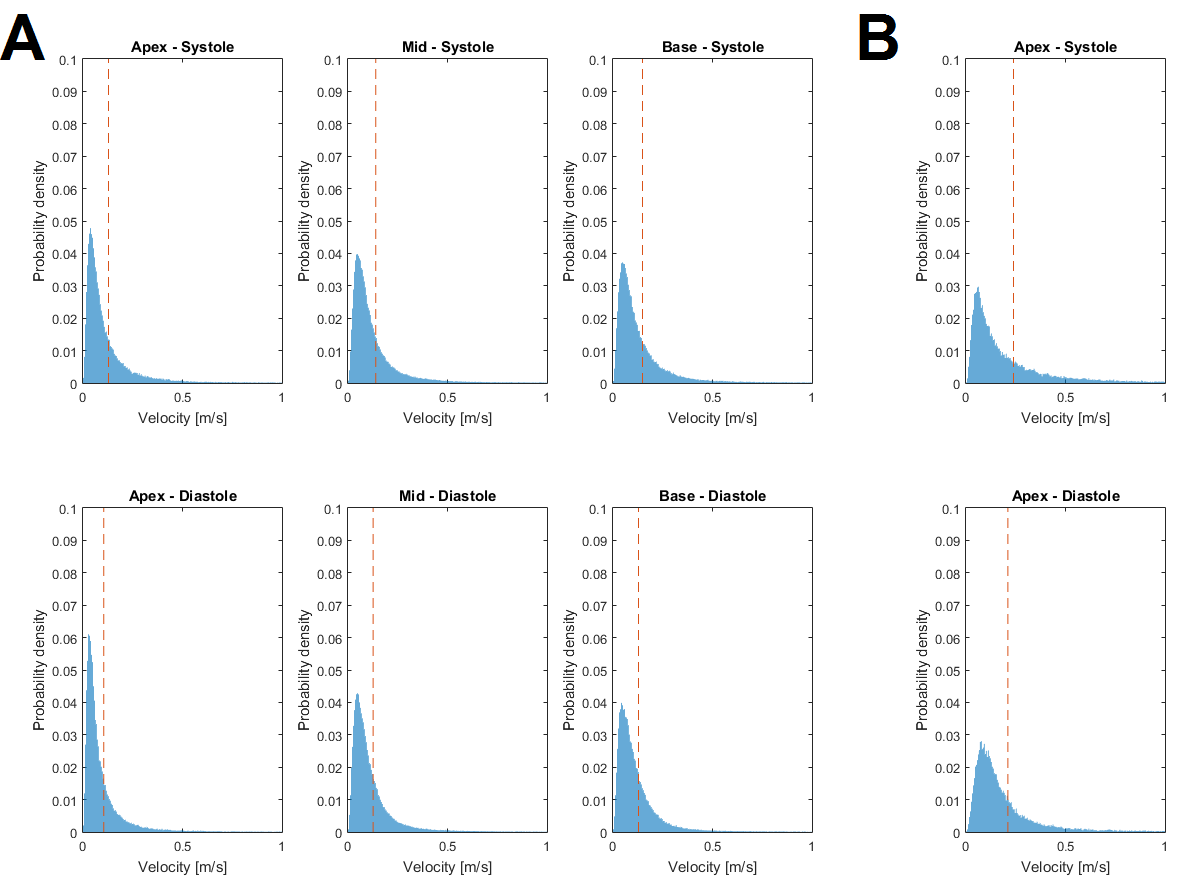
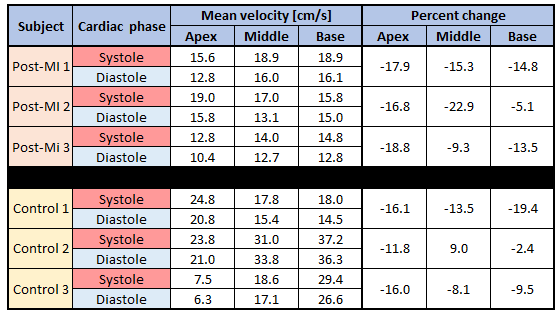
Post-MI patients demonstrated an increased skew of their histograms towards zero velocity between systole and diastole in the apex. A skew towards lower velocities was also observed in the basal and mid LV, but it was less pronounced than the apex (Fig. 2A). Normative controls tended to show an increased mean velocity at both systole and diastole relative to post-MI subjects (except for control #3), and a reduced drop in velocities between the two phases (Fig. 2B). Fig. 3 summarizes mean velocity values at systole and diastole for each LV segment. In the basal and mid LV, no notable differences were observed between post-MI patients and controls. In the LV apex, post-MI subjects showed an average decrease in mean velocity of 18% compared to 15% in healthy controls.Discussion
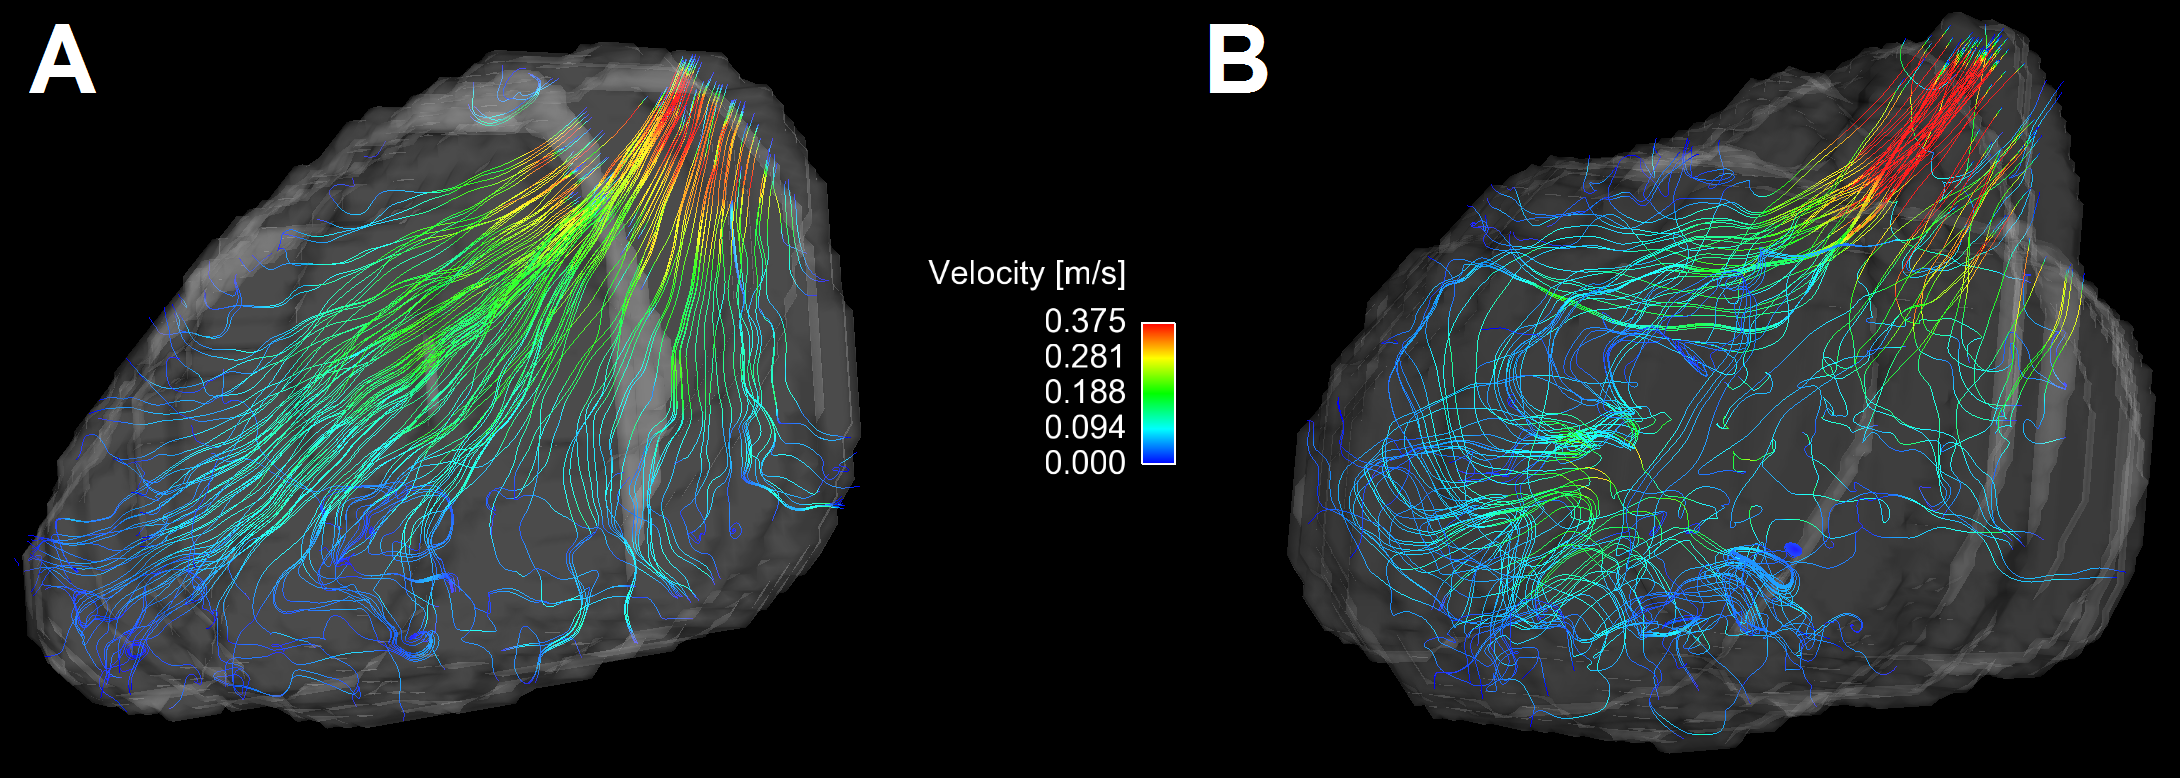
The histogram skew towards lower velocities in the apex of the post-MI patients was consistent with increased flow stagnance in this region. These findings were reinforced by streamline visualizations in the LV of the post-MI subjects. During systole (Fig. 4) post-MI subjects demonstrated slow, vortical flow in the apex and mid regions of the LV whereas healthy controls showed more efficient filling and clearance of blood out through the aortic valve from all LV regions. Some heterogeneity was observed in the velocity characteristics of both groups, but it was not feasible to characterize this variance given the small group sizes. Larger patient recruitment will be performed in the future to provide the statistical power for more meaningful comparisons. Additional 4D flow derived quantitative hemodynamic parameters, such as vorticity in the LV, can possibly augment the current analysis.Conclusion
This pilot study demonstrates feasibility of MRI 4D flow derived velocity histogram analysis for detection of post-MI reductions in apical blood flow. Larger scale longitudinal studies inclusive of histogram analyses and quantitative flow indices are warranted to determine the utility of 4D flow for prediction of post-MI LVT.Acknowledgements
We gratefully acknowledge research support from GE Healthcare.References
1. Fluckiger JU, Goldberger JJ, Lee DC, Ng J, et al. Left atrial flow velocity distribution and flow coherence using four-dimensional FLOW MRI: a pilot study investigating the impact of age and Pre- and Postintervention atrial fibrillation on atrial hemodynamics. JMRI. 2013;38(3):580-587.
2. Johnson KM, Lum DP, Turski PA, Block WF, et al. Improved 3D phase contrast MRI with off-resonance corrected dual echo VIPR. MRM. 2008;60(6):1329-1336.
Figures