1257
Simultaneous MultiSlab 4D Flow MRI for Quantification of Hemodynamics in the Carotid Bifurcation at 7 Tesla1University of Minnesota Medical School, Center for Magnetic Resonance Research, Minneapolis, MN, United States, 2Physikalisch-Technische Bundesanstalt (PTB), Braunschweig and Berlin, Germany, 3Department of Radiology, Northwestern University, Feinberg School of Medicine, Chicago, IL, United States, 4Biomedical Engineering, Northwestern University, McCormick School of Engineering, Chicago, IL, United States
Synopsis
Simultaneous Multislice (SMS) imaging, also termed "Multiband" (MB), was integrated into slab-selective 4D flow MRI to quantify blood hemodynamics simultaneously in both carotid bifurcations at 7T. Therefore, sagittal oriented MB 4D flow acquisitions with 0.8mm isotropic resolution were performed in 4 volunteers using a dedicated carotid coil. The same protocol was then repeated twice, but only a single slab ("SingleBand" - SB) targeting the left or right carotid bifurcation was excited. Peak velocity and net flow quantification was performed for reconstructed MB and SB data on 3 planes each, one before and two after the bifurcation.
Purpose
The aim of this work is to demonstrate the feasibility of quantifying carotid hemodynamics at 7T using 4D flow MRI and to investigate the feasibility of accelerating the acquisition using the concept of simultaneous MultiSlice (SMS) imaging (1,2), also termed "MultiBand (MB)". With MB imaging two sagittal slabs covering right and left carotid arteries were excited simultaneously. A dedicated 8-channel TX/RX coil in combination with B1+ shimming was used. The impact of this technique on velocity and flow quantification was studied in 4 healthy volunteers.Methods
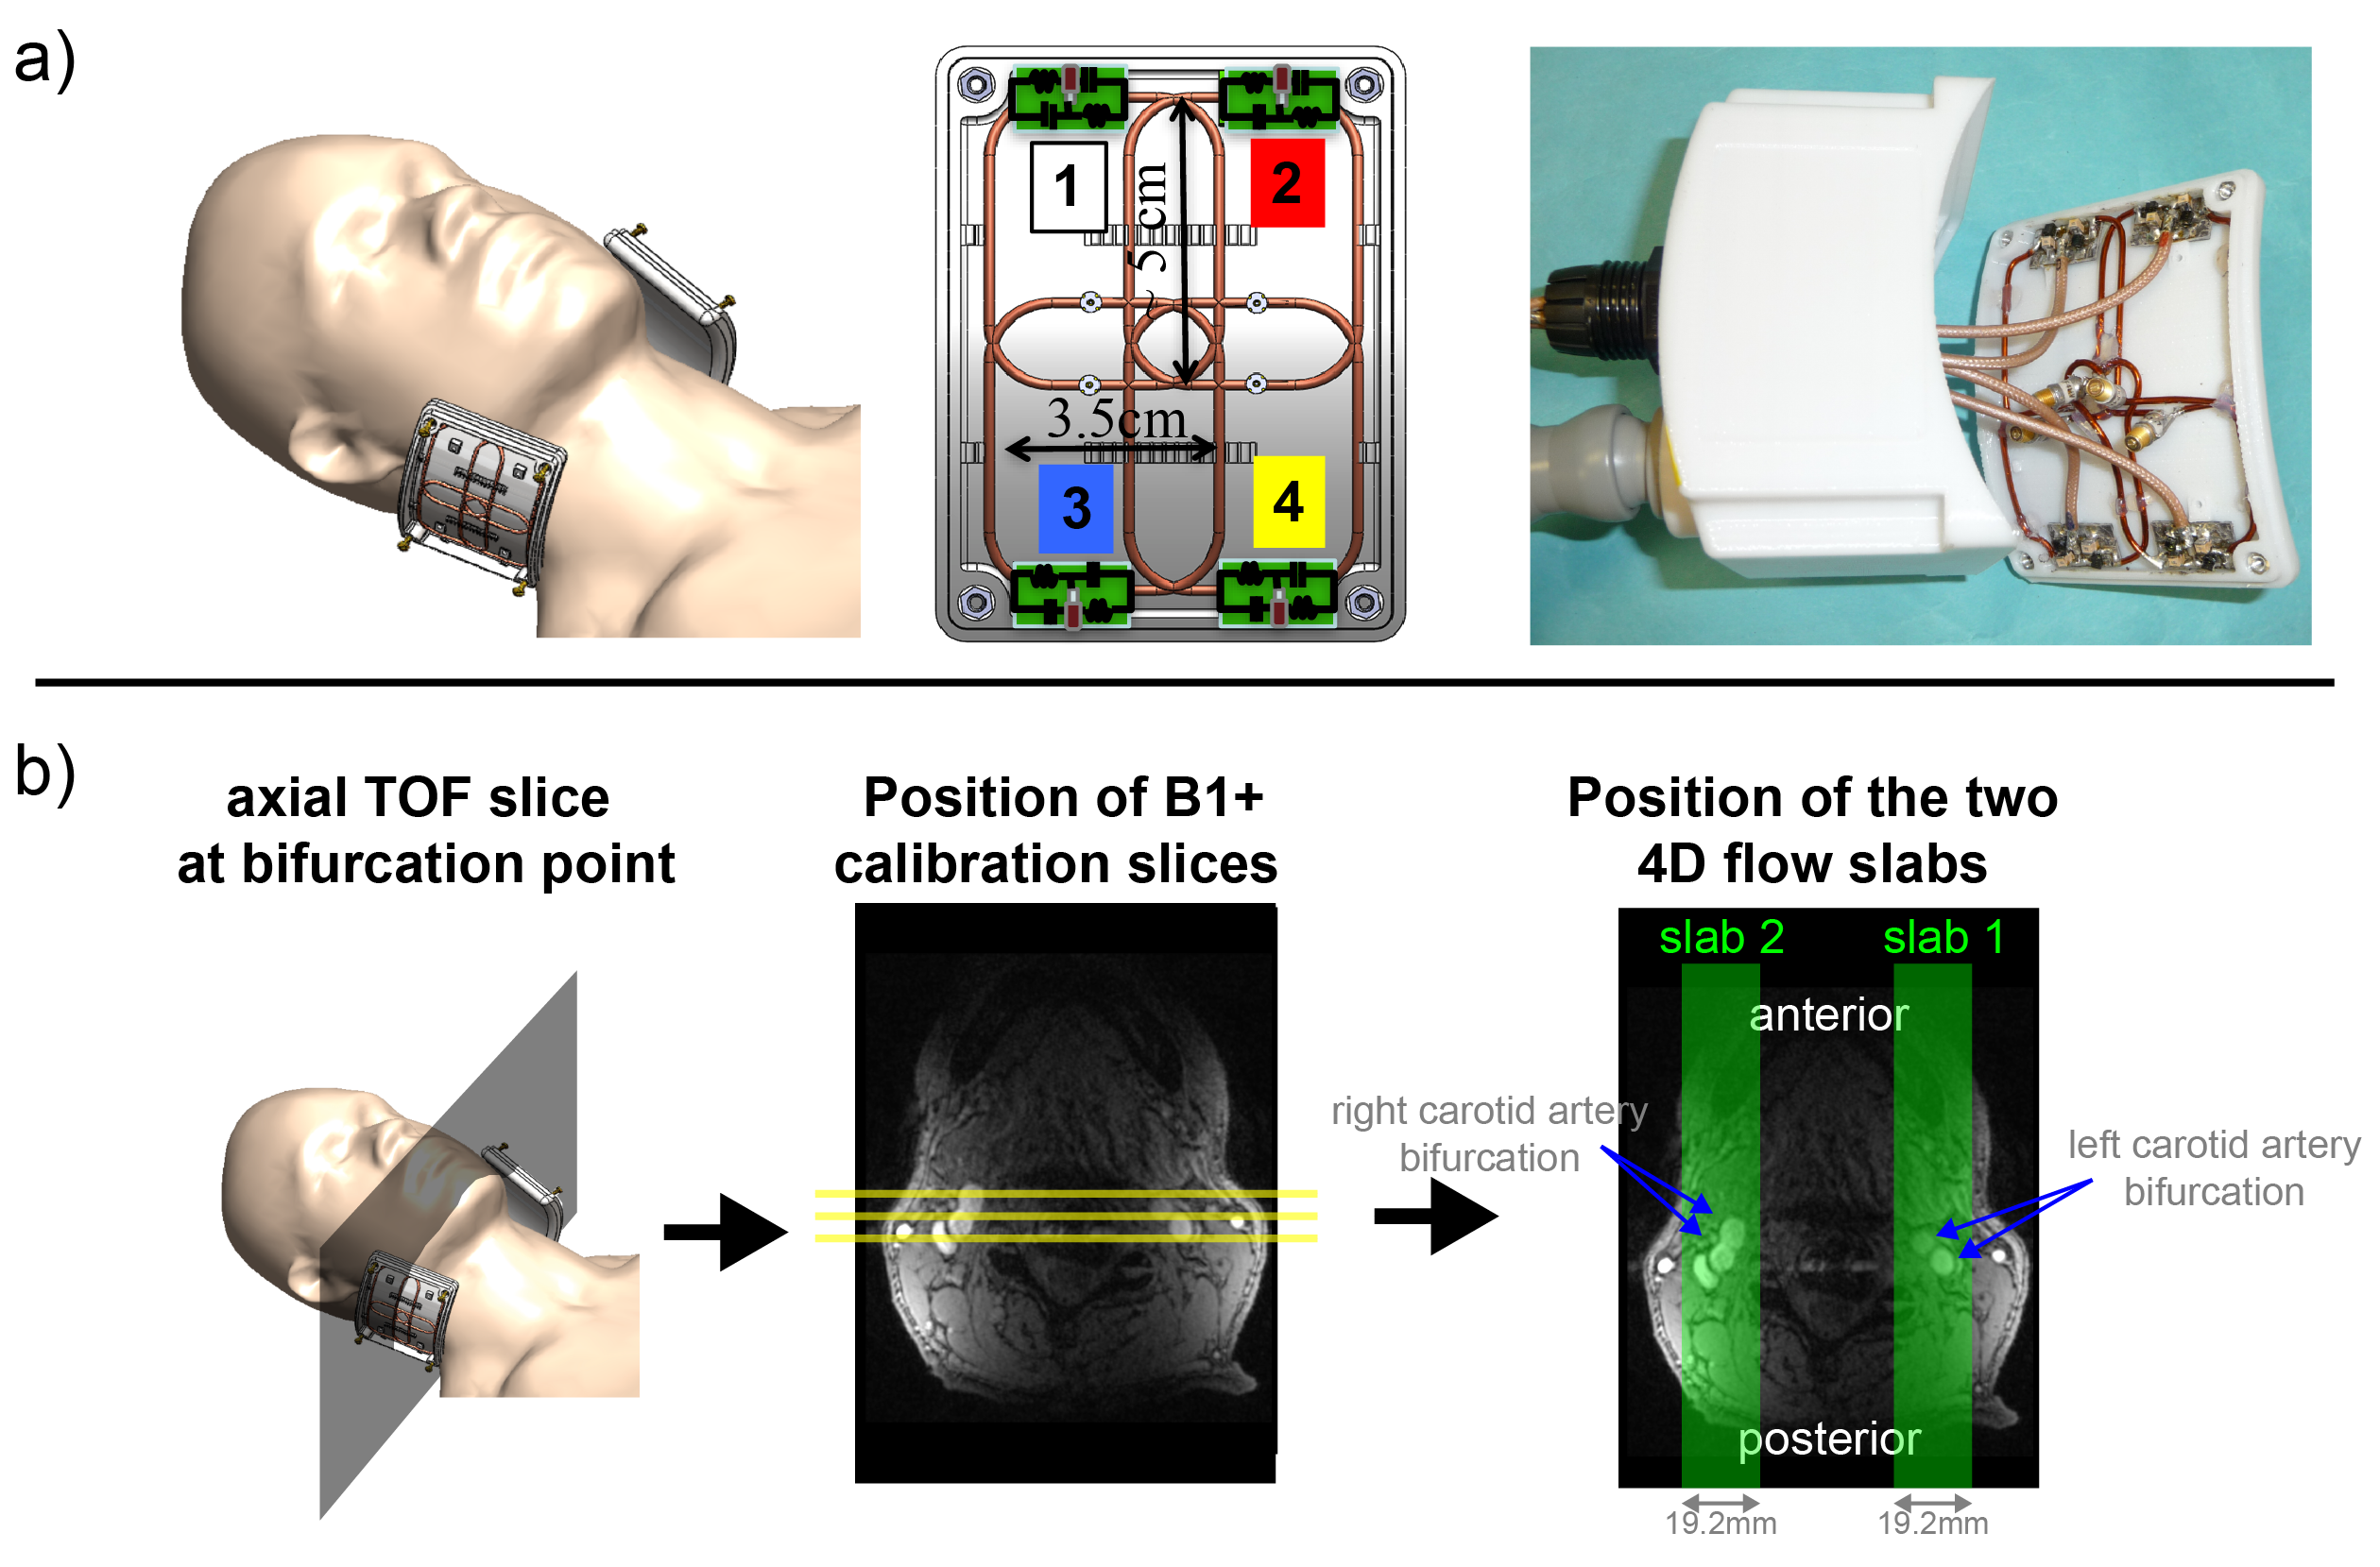
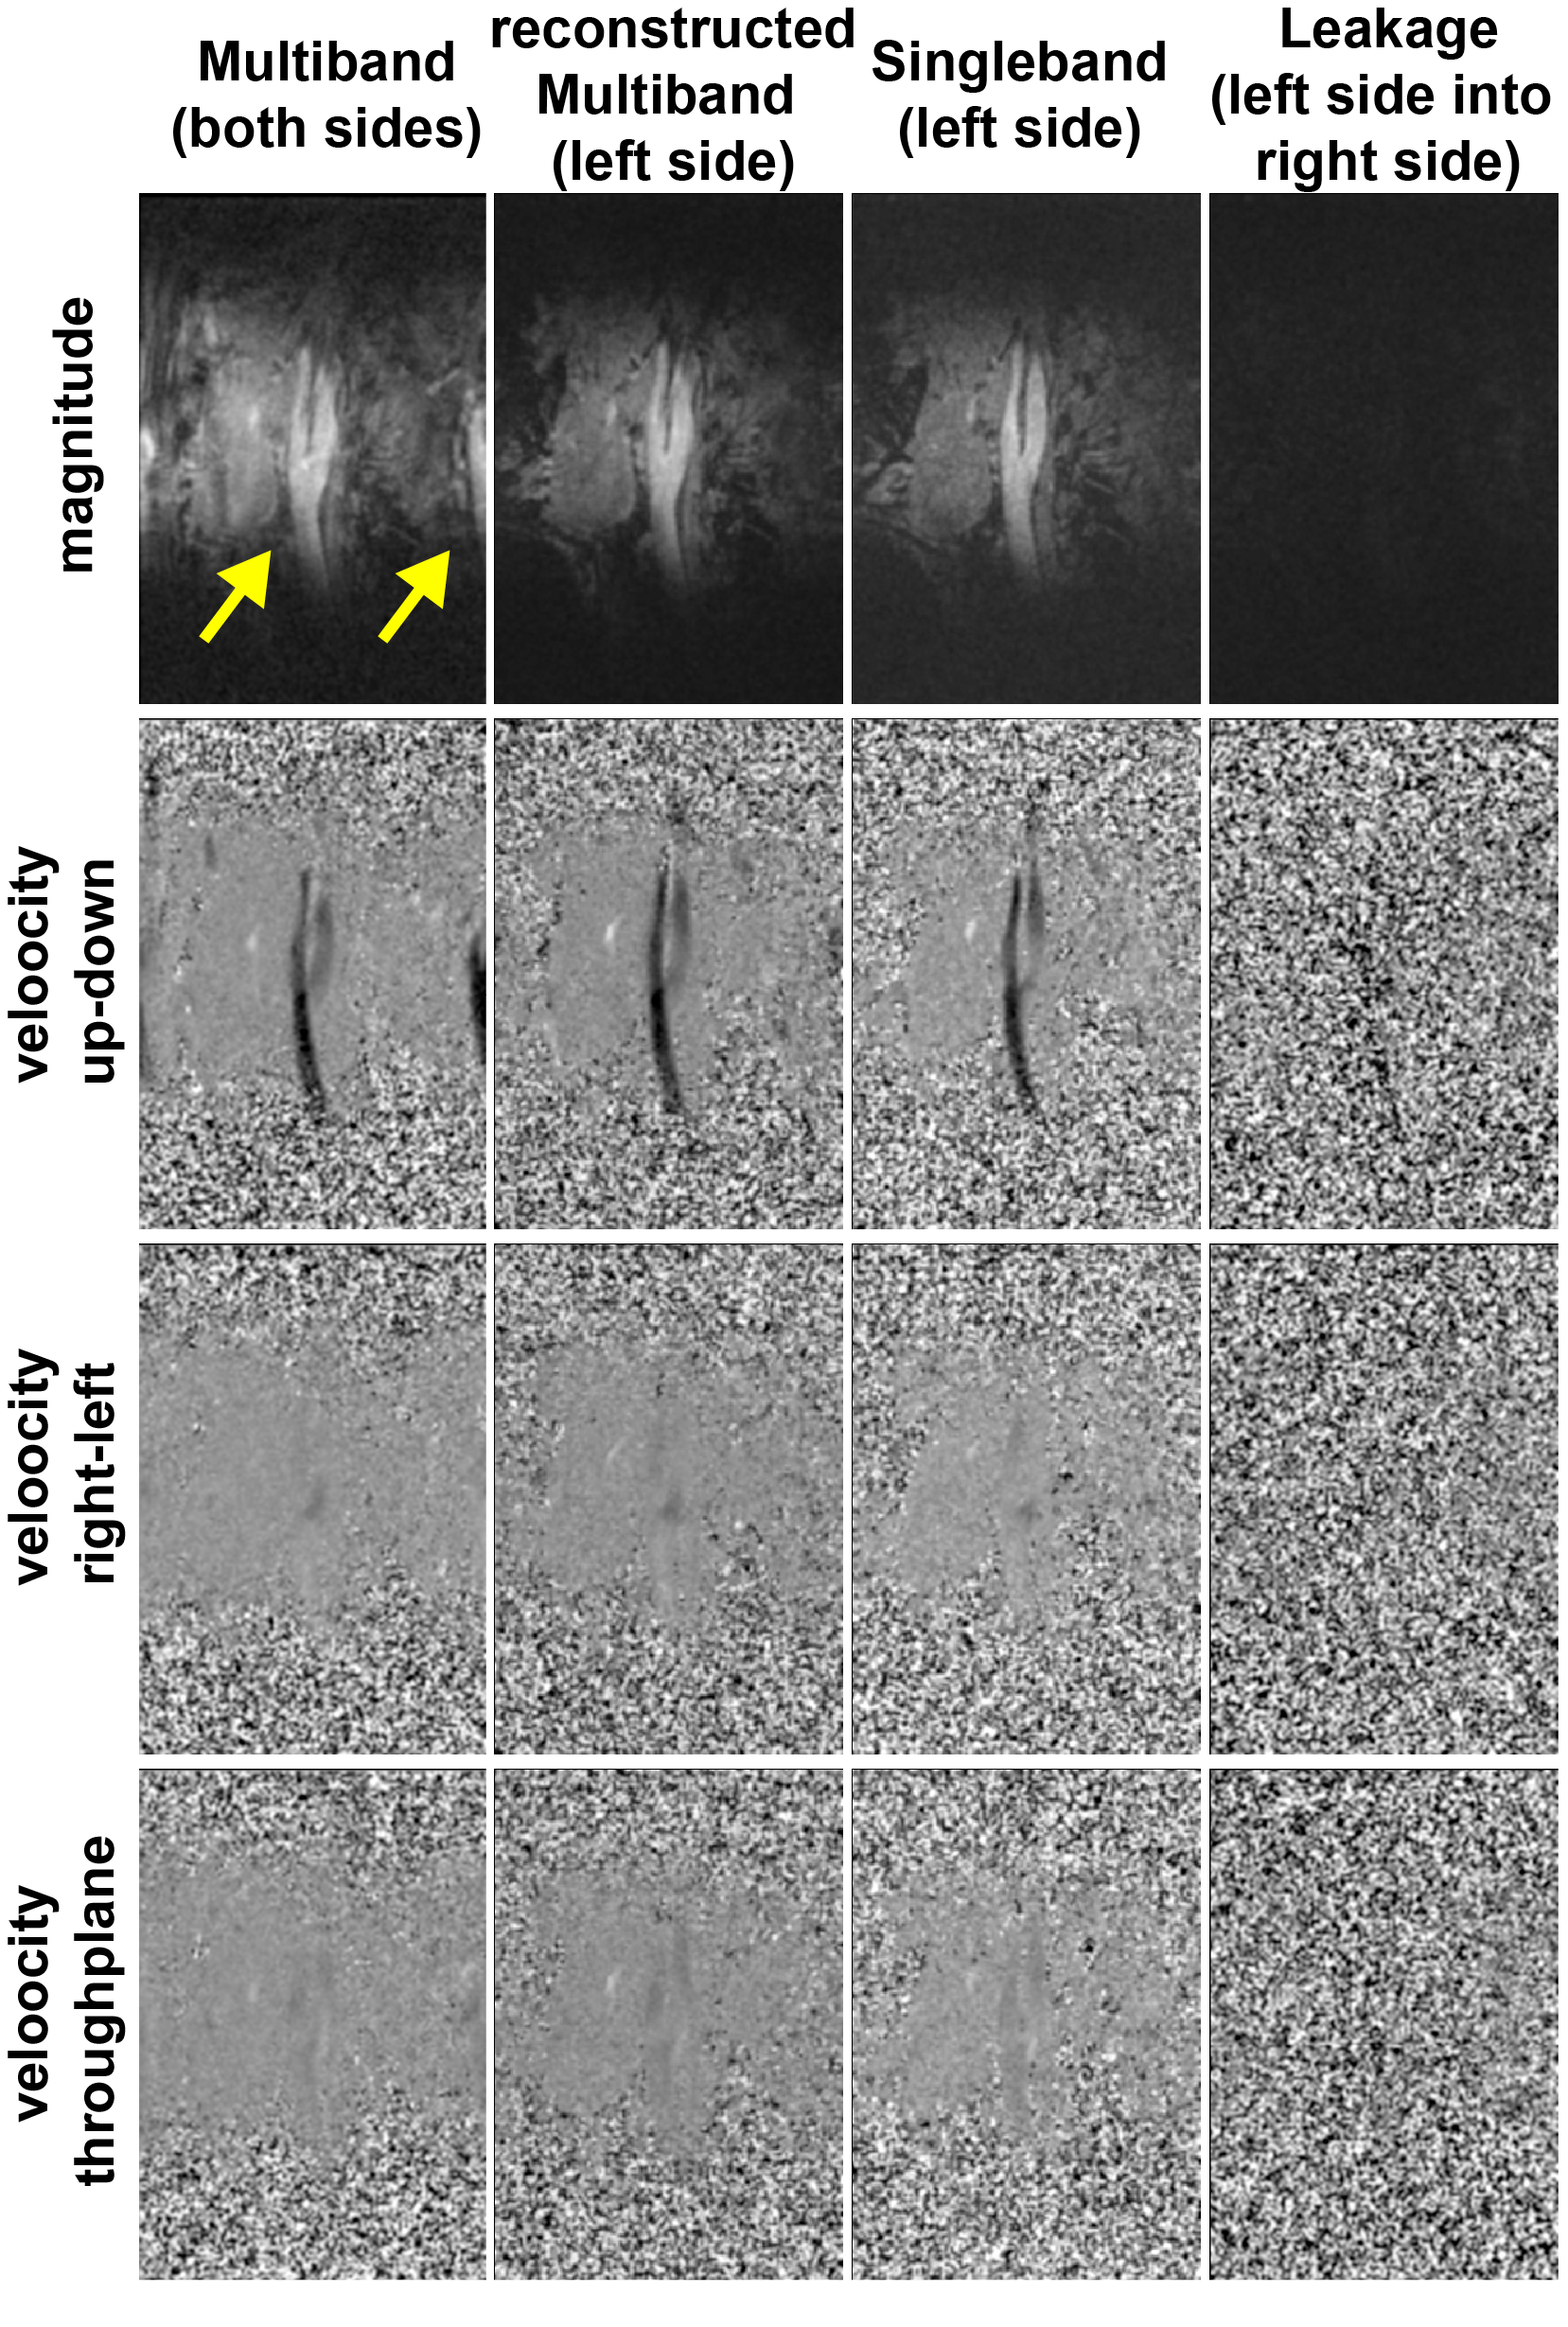
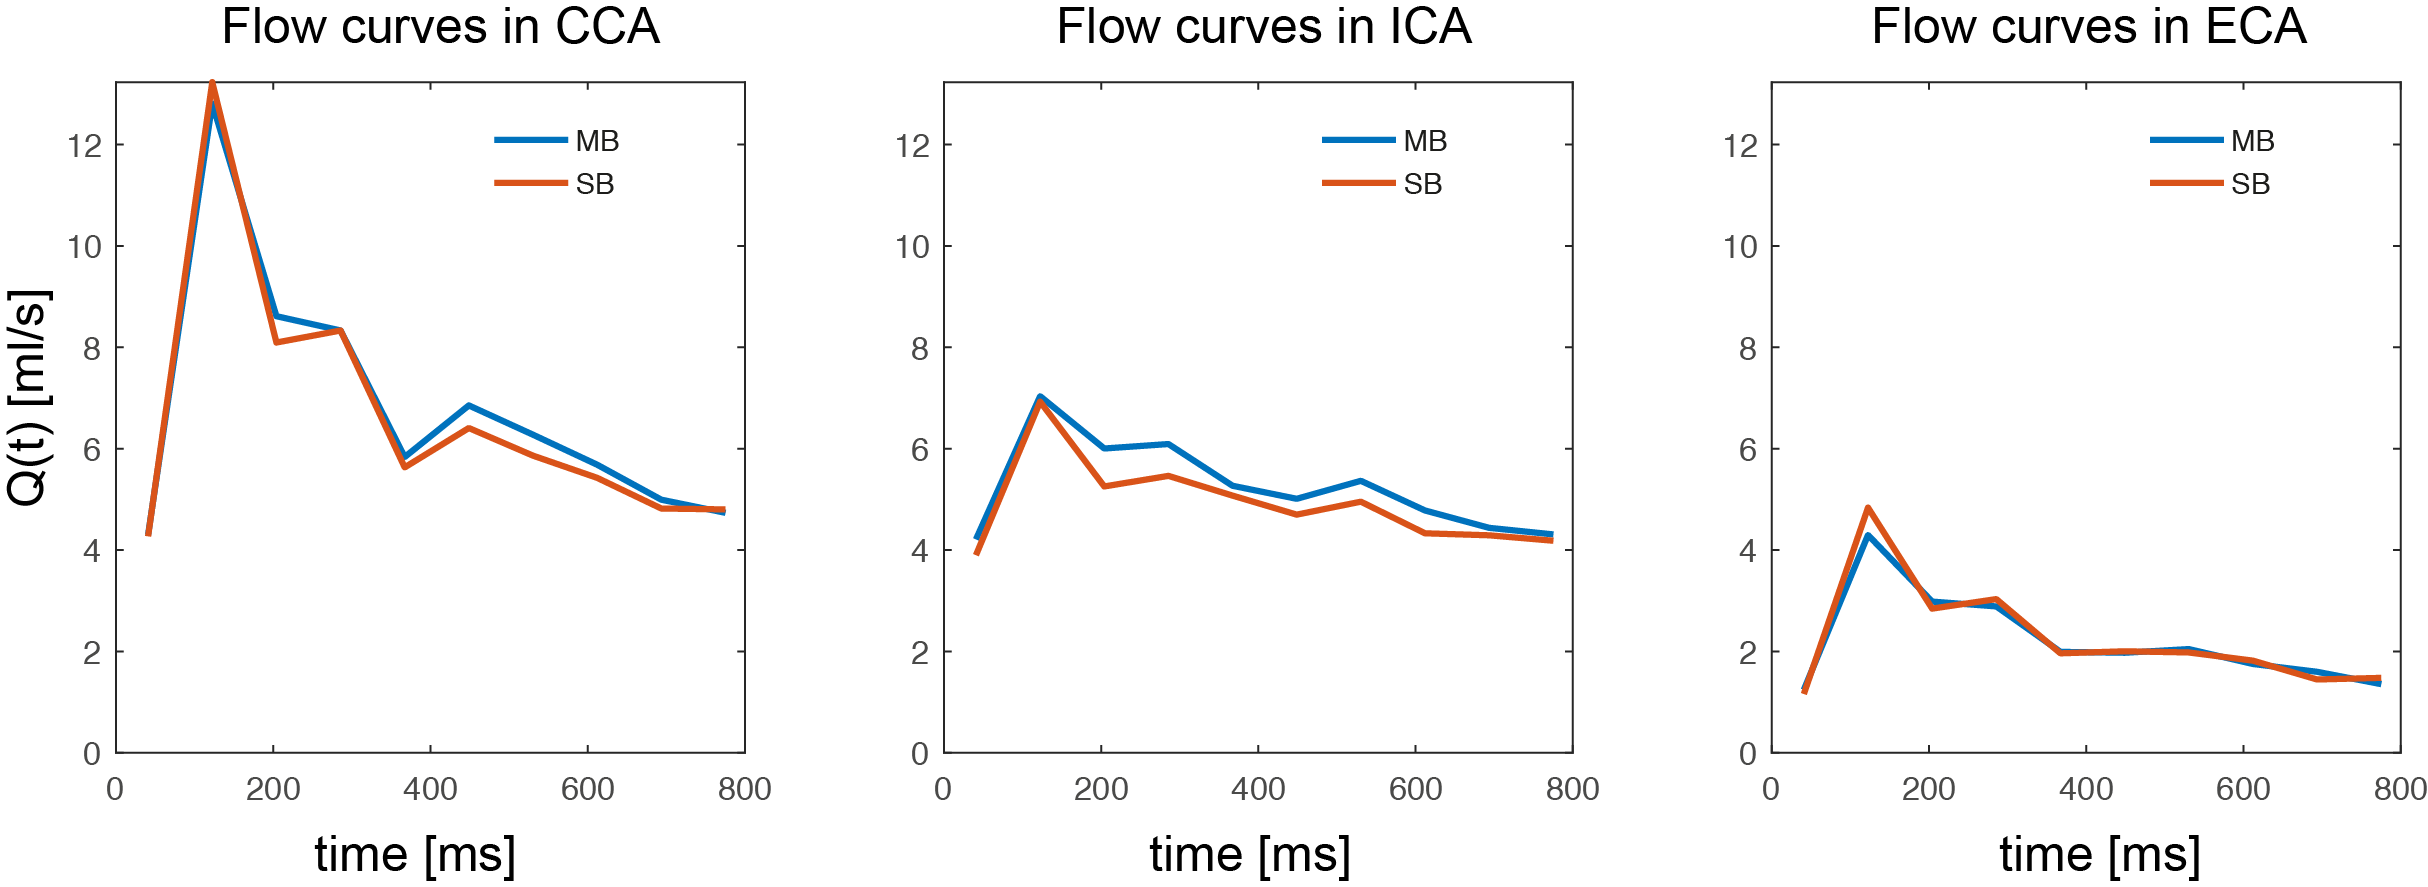
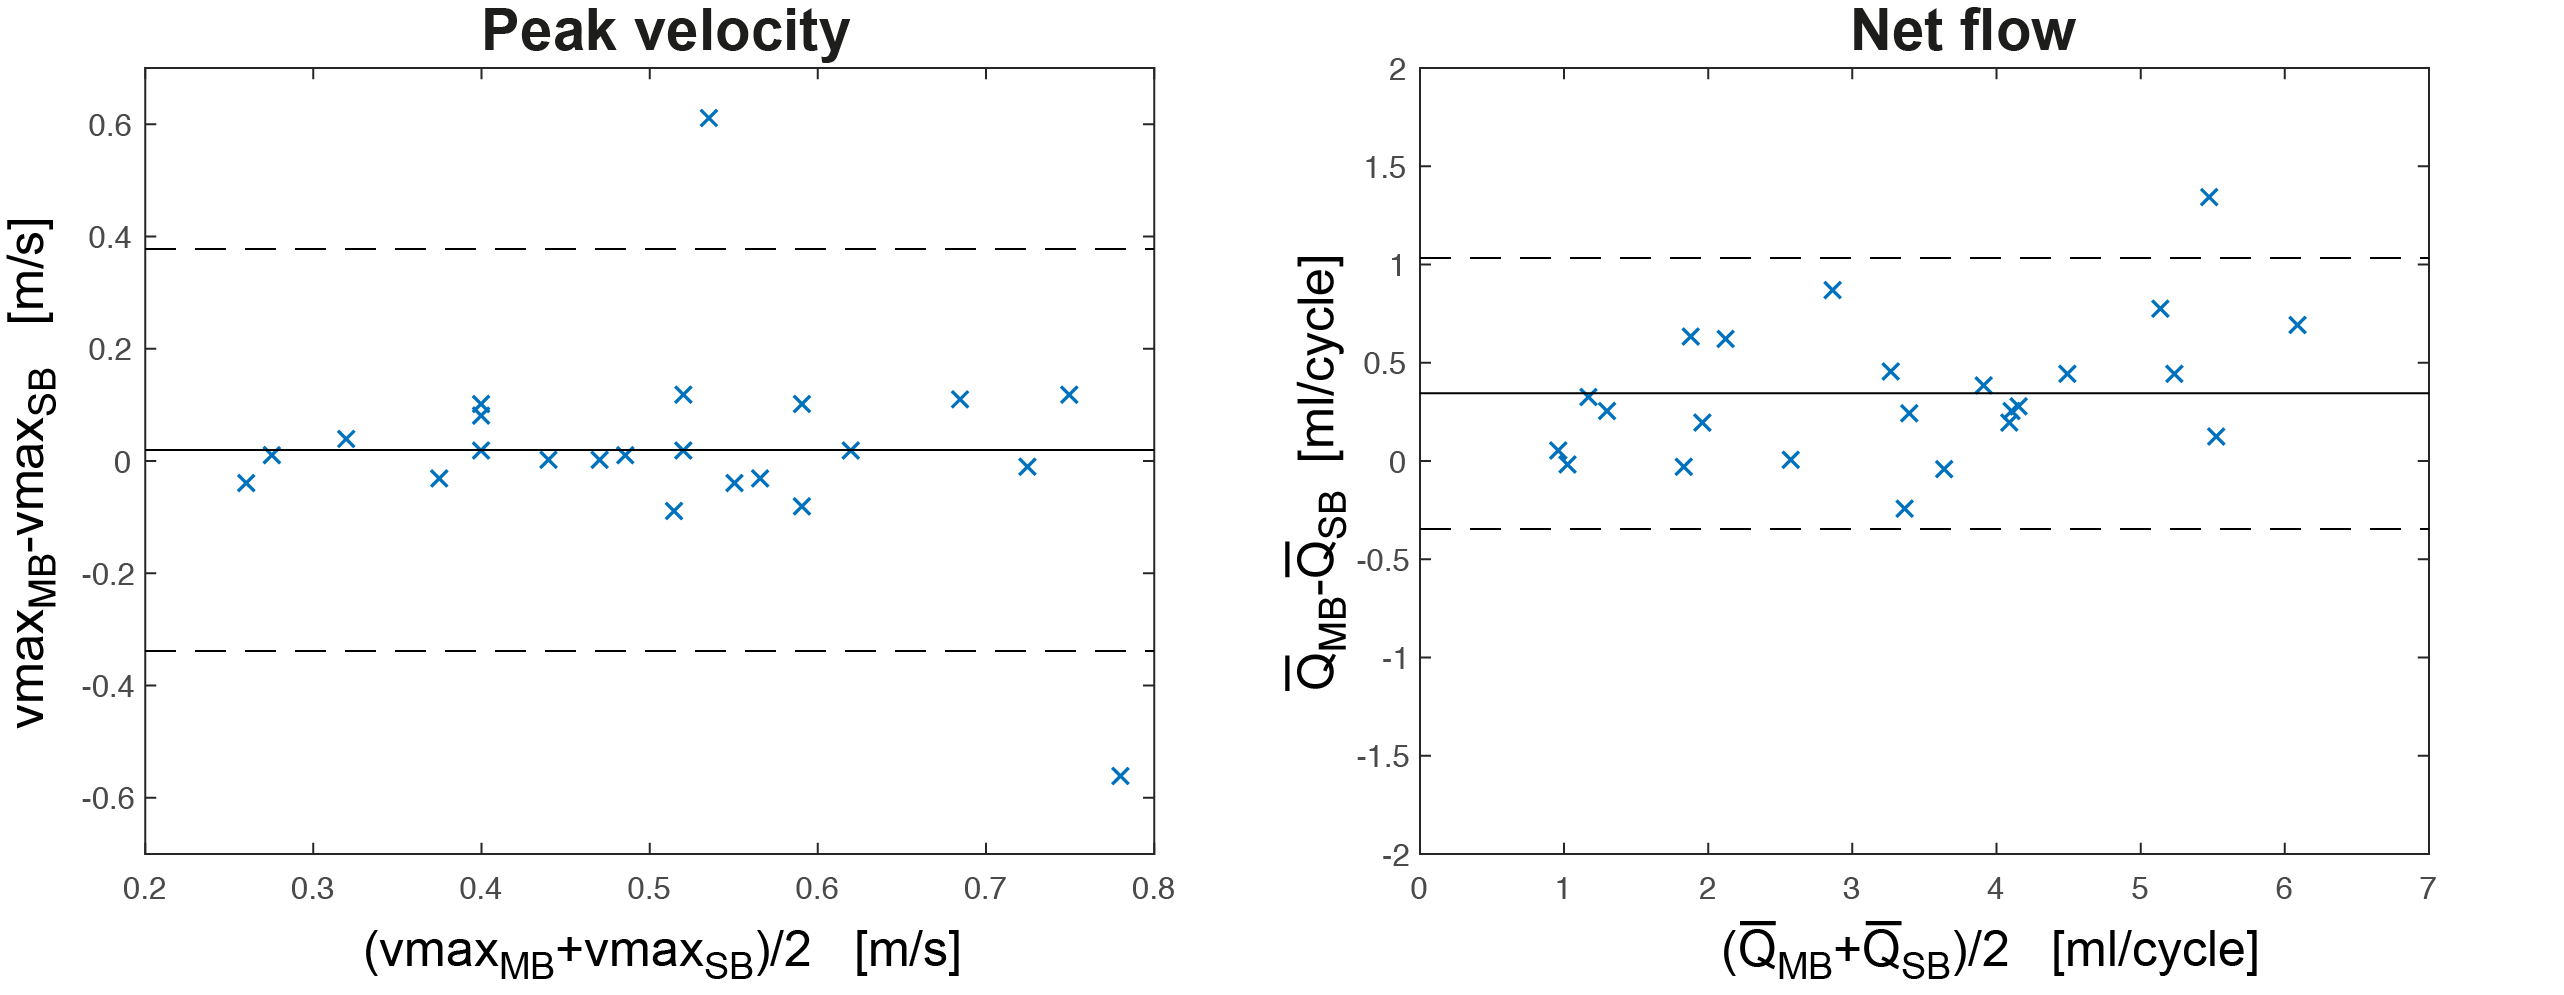
All scans were performed at 7 Tesla (Siemens, Germany) equipped with an RF shimming system (CPC, USA). A custom-build 8-channel carotid coil was used, which consists of two elements each containing a 2x2 TX/RX loop array (Fig.1a). 4 healthy subjects (3f, age: 36.6y±18.7y) were scanned after written consent according to an approved IRB protocol. Axial time-of-flight scans were performed for localization. B1+ maps were obtained using a gradient-echo (GRE) based fast B1+ estimation method (3) on three 8 mm distant coronal slices covering both carotid bifurcations (Fig.1b) (TR/TE=50ms/3.8ms, FOV=160x160mm2, matrix=128x128, thickness=4mm, 1:08 min). Six ROIs (both sides, three slices) were drawn manually to cover both bifurcations. MB pulses were calculated to simultaneously excite two 19.2mm thick sagittal slabs covering both carotids (Fig.1b) using a band-joint B1+ shim MB pulse design (4), that first summed the two SINC pulses (1ms duration, BWTP=4) before applying a B1+ shim solution. The latter was calculated to maximize the transmit efficiency (5) within the ROIs. CAIPIRINHA (6) was applied to shift the right slab by FOV/2. A 4D flow protocol with the following parameters was acquired: TR/TE=6.8ms/3.9ms, temporal resolution=81.6ms, 3 segments, resolution=0.8mm (isotropic), 9-10 cardiac phases, VENC=100cm/s, FOV=160x100x19.2mm3, RO-direction=HF, no acceleration). This protocol was acquired three times: using MB pulses exciting both slabs and using SB pulses exciting only left or right bifurcation. Data was unwrapped using a slice-GRAPPA reconstruction (7), whose kernels were obtained from two 15 seconds non-flow-encoded 3D GRE acquisitions. Signal Leakage was quantified as in (8). Data postprocessing included noise masking and calculation of the phase-contrast angiogram used for masking velocities within vessel boundaries (9,10). Peak velocity (vmax), time-resolved flow curves (Q(t)) and mean flow ($$$\bar{Q}$$$) were quantified in commercial software (Ensight, USA) using 3 measurement planes located in the common carotid artery (CCA), internal carotid artery (ICA) and external carotid artery (ECA). In addition, MB data was retrospectively 2-fold undersampled in PE direction (iPAT2) for subject 1, resulting in a total acceleration of R=4 (neglecting autocalibration lines). Reconstruction was done by a sequential GRAPPA/slice-GRAPPA algorithm. Bland-Altman diagrams of vmax and Q were plotted for MB versus SB data and differences in vmax and ($$$\bar{Q}$$$) were tested using a paired t-test.Results
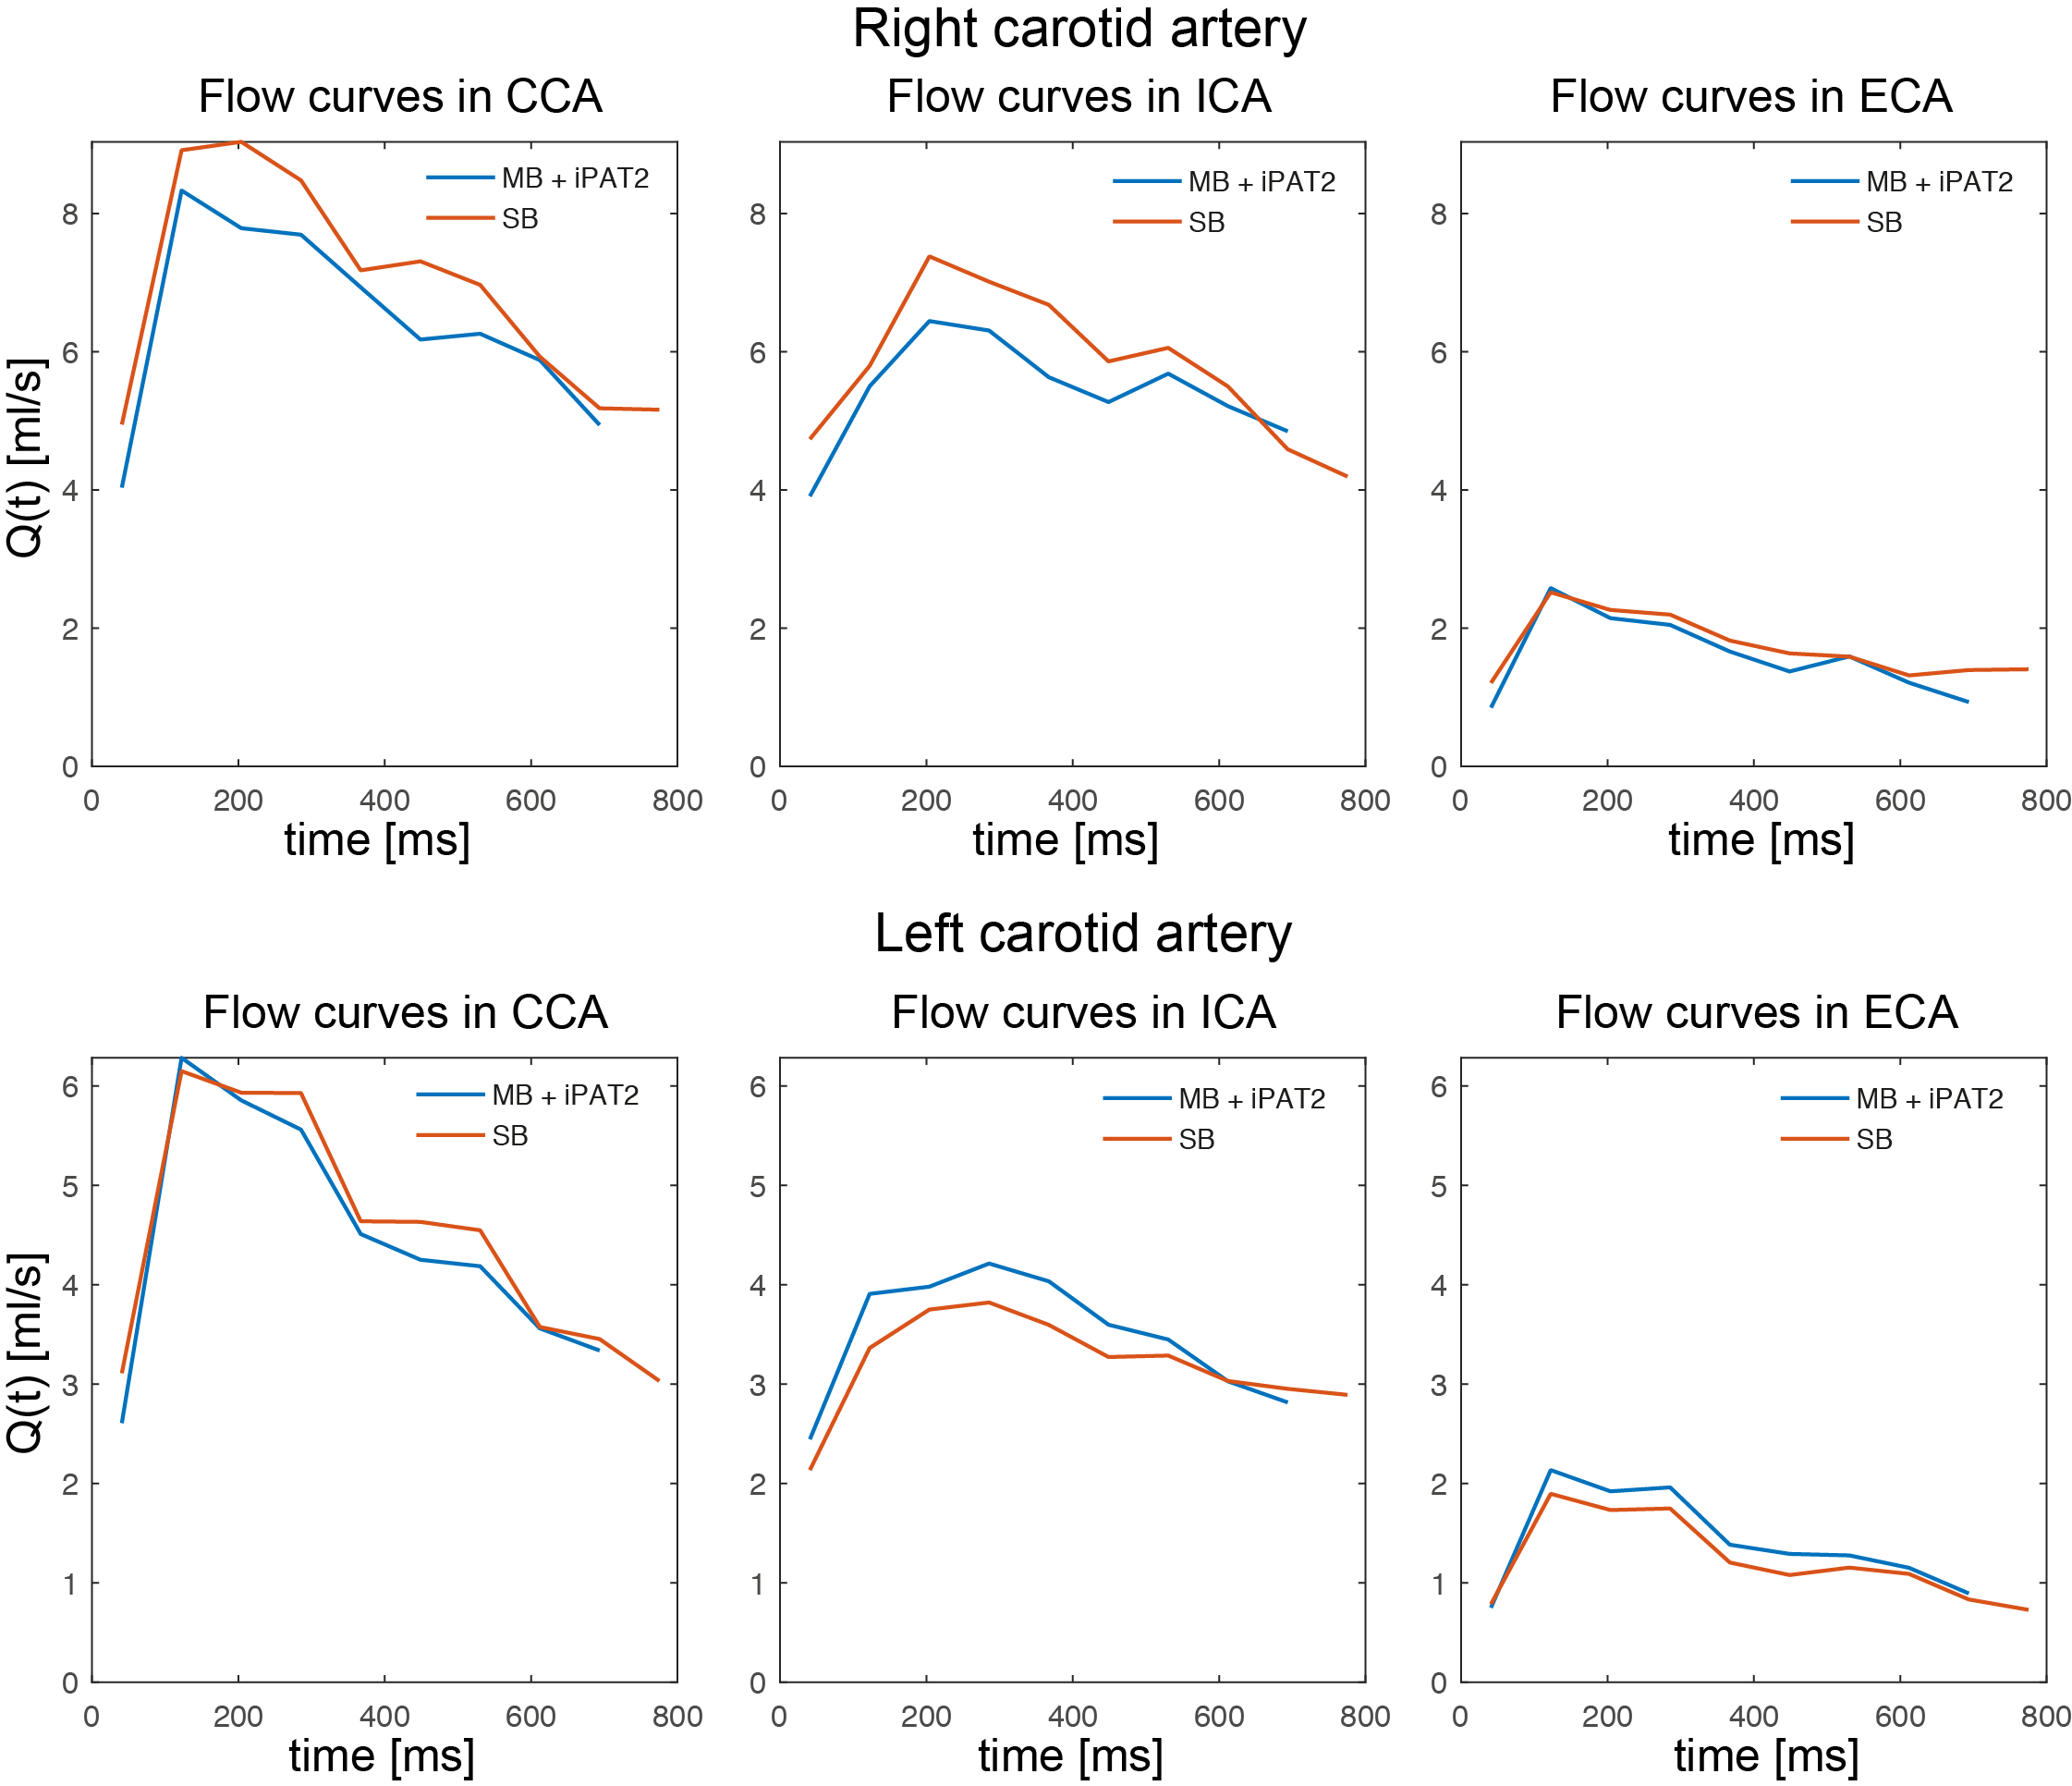
Fig.2 shows original and reconstructed MB data (magnitude and phase differences). Leakage of the signal from one slab to the other was barely visible and its 99th percentile did not exceed twice the background noise level. Quantification of Q(t) is shown exemplarily for volunteer 4 in Fig.3, revealing similar flow curves for MB as for SB data. Differences in and vmax are displayed for all volunteers at all measurement locations in Fig.4 revealing no differences (p>0.05) in peak velocity. Average $$$\bar{Q}$$$ showed 11% difference between the methods, which was statistically significant (p<0.05). Two-fold additional acceleration in PE direction visibly affected the noise in magnitude and phase, but resulted in comparable quantitative values as illustrated for volunteer 1 in Fig.5.
Discussion and Conclusion
In this work we apply 4D flow MRI for the first time in the carotid arteries at 7T using a local TX/RX coil and we demonstrate the possibility of using MB for efficient acquisition. Combination with inplane-GRAPPA allowed for an approximately 4-fold acceleration. Since we observed similar vmax, but a significant difference in Q, we hypothesize that the difference is attributed to the velocity masking, which was done individually based on the calculated PC-MRA. This can be analyzed and addressed by segmenting the carotid artery based on the SB dataset and applying the same segmentation to a reconstructed artificial MB dataset, generated by the complex sum of both SB datasets (8). Note, that since MB and SB acquisitions had identical gradient switching we deliberately did not correct for eddy currents to limit impacts of differences in phase correction on the quantification. In conclusion, MB 4D flow is feasible and allows for additional acceleration of 4D flow for specific targets, which is also applicable at lower field strength.Acknowledgements
This work was supported by NIH grant P41 EB015894 and AHA grant 16SDG30420005.References
(1) Larkman et al. J Magn Reson Imaging. 2001;13(2):313-7. (2) Feinberg et al. Proceedings ISMRM 2016:320. (3) Van de Moortele et al. Proceedings ISMRM 2009:367. (4) Wu et al, Magn Reson Med. 2013;70:630. (5) Schmitter et al. J Magn Reson Imaging. 2016;44(2):486. (6) Breuer et al. Magn Reson Med. 2005;53:684. (7) Setsompop et al. Magn Reson Med. 2012 67:1210. (8) Schmitter et al. Magn Reson Med. 2016 (in press) doi: 10.1002/mrm.26180. (9) Bernstein et al, J Magn Reson Imaging. 1992;2(5):583-8. (10) Bock et al. Proceedings ISMRM 2007:3138
Figures