1254
Brain-Structure-Specific Metabolite Quantification of MEGA-LASER 3D MRSI data1School of Health Sciences, Purdue University, West Lafayette, IN, United States, 2Department of Radiology and Imaging Sciences, Indidana University School of Medicine, Indianapolis, IN, United States, 3Department of Biomedical Imaging and Image-guided Therapy, High Field MR Center, Medical University of Vienna, Vienna, Austria, 4Martinos Center for Biomedical Imaging, Massachusetts General Hospital, Harvard Medical School, Boston, MA, United States
Synopsis
To overcome box-shaped ROIs and enable brain-structure-specific comparison of metabolite levels across patient groups, a fully-automated brain-structure-specific metabolite quantification approach was developed and applied to the analysis of MEGA-LASER 3D MRSI data. Structure-specific GABA, Glx, NAA and tCho levels and their hemispheric variation in healthy volunteers was studied. The four metabolite levels varied significantly across different brain regions, but did not differ between left and right hemispheres. Correlations between the left and right hemisphere metabolite levels were observed only for some structures.
Introduction
Fast MRSI techniques, which have been developed to achieve higher resolution and higher spectra quality1,2,3, have provided practical approaches to investigate brain metabolism in healthy condition and in central nervous system diseases4,5,6. The larger spatial coverage and higher resolution compared to single voxel MRS offer more options to choose non-box shaped regions of interest (ROIs). To date, in most studies, ROIs are manually determined by the data analysist, which may introduce inconsistencies.. A recent study used SPM-defined ROIs5. Here, a fully-automated brain-region-specific approach was developed for the quantification of structure-based brain metabolite levels, including GABA, which were acquired from MEGA-LASER 3D MRSI7 with real-time motion correction and shim update, as well as LASER localization to minimize field inhomogeneity and chemical shift artifacts. Using this approach, the distribution of metabolite levels in terms of 1) regional and hemispherical differences and 2) correlations of the metabolite levels between left and right hemispheres, was investigated.Methods:
21 healthy male subjects were recruited for the study (mean age±SD:42±11yrs). All MRI/MRS acquisitions were conducted on a 3T Siemens Tim Trio MRI scanner equipped with a 32-channel head coil. T1-weighted MPRAGE images were acquired for anatomical information. The Volume of Interest (VOI) of the 3D MEGA-LASER MRSI acquisition was centered on the basal ganglia region and included the thalamus. Other parameters for MRSI examinations include: TR/TE=1600/68ms, acquisition time=19:44min, nominal acquisition resolution=2.89ml. All spectra were quantified with LCModel V6.3-1B8. Metabolite levels of GABA+ (GABA+co-edited macromolecules) and glutamine+glutamate (Glx) from difference spectra, and N-acetylaspartate (NAA) and glycerophosphocholine+phosphocholine (tCho) from edit-OFF spectra were included in the analysis. All metabolite values were normalized to total creatine (tCr) levels. Metabolite maps within the VOI were generated from LCModel fitting results using a Matlab-based package(MathWorks,Inc.,Natick,MA,USA) and interpolated and registered to MPRAGE images using Medical Imaging NetCDF (MINC). MPRAGE images were processed with Freesurfer9,10 to segment the brain structures. The structures of interest (SOI) were determined based on two criteria: 1) the average size of the structure within the VOI is larger than 2.89ml, which is the acquisition resolution; 2) more than 80% of the size of the total structure should be included in the VOI. For each subject, SOI masks were generated and registered to the metabolite maps. The mean metabolite levels from each SOI were calculated.
Two-way analysis of variance (ANOVA) was used to test the regional and hemispherical difference in metabolite level, with the interaction term set as region*hemisphere. Post-hoc Tucky tests were performed to determine the regions with significantly different metabolite levels. The association of the metabolite levels between left and right side of each brain structure were examined with Pearson correlation tests. Bonferroni correction for multiple comparisons was applied in the post-hoc Tucky tests and correlation tests.
Results:
All spectra showed good data quality with clearly resolved GABA+ peaks and high SNR. Representative metabolite maps of GABA+, Glx, NAA and tCho are shown in Fig.1. The selected SOIs included the thalamus, caudate, putamen, globus pallidus, mid-anterior cingulate, mid-posterior cingulate, precuneus, and intraparietal sulcus shown in Fig.2. The boxplots of the metabolite levels from left and right side of each of these brain structures are shown in Fig.3. Two-way ANOVA results for the 4 metabolite levels are listed in Table 1.a. All metabolite levels show a significant regional difference. Only GABA+/tCr, NAA/tCr and Glx/tCr show a simple effect from the hemisphere. The interaction effect is not significant for any metabolite. The correlation results between metabolite levels from left and right side of each brain structure are listed in Table 1b, with the correlation coefficients marked with Bonferroni-corrected significance levels. Not all brain regions show significant correlations in all measured metabolite levels between left and right hemisphere. Putamen and globus pallidus don’t show any correlation between hemispheric values for any metabolite measured in this study.Conclusion and Discussion:
Our study proposed a novel and fully-automated brain-structure-specific approach on the analysis of MEGA-LASER 3D MRSI data. The approach was applied to obtain brain structure specific GABA and Glx levels in healthy volunteers. All structure-specific metabolite levels were within the range of the values from similar regions reported by a study using the same sequence but with manual voxel selection11. Regional variations of the metabolite levels and no hemispheric difference within each region are in line with other reports using single voxel MRS12,13. The lack of correlation for all measured metabolite levels between the two hemispheres in some brain regions could be explained by neurochemical asymmetry of the brain14.Acknowledgements
The study was supported by NIEHS R01 ES020529References
1. Zhu H, Barker PB. MR spectroscopy and spectroscopic imaging of the brain. Methods Mol Biol. 2011;711:203-226.
2. Strasser B. Povazan M, Hangel G et al., (2+1)D-CAIPIRINHA accelerated MR spectroscopic imaging of the brain at 7T. Magn Reson Med. 2016; DOI 10.1002/mrm.26386
3. Lam F, Ma C, Clifford B et al., High-resolution H-MRSI of the brain using SPICE: data acquisition and image reconstruction. Magn Reson Med. 2016;76:1059-1070
4. Pagan FL. Butman JA, Dambrosia JM, Hallett M. Evaluation of essential tremor with multi-voxel magnetic resonance spectroscopy. Neurology.2003;60:1344-1347
5. Schreiner SJ, Kirchner T. Wyss M et al., Low episodic memory performance in cognitively normal elderly subjects is associated with increased posterior cingulate gray matter N-acetylaspartate: a 1H MRSI study at 7 Tesla. Neurobiol. Aging. 2016;48:195-203
6. Audoin B, Ibarrola D, Malikova I et al., Onset and underpinnings of white matter atrophy at the very early stage of multiple sclerosis – a two-year longitudinal MRI/MRSI study of corpus callosum. Multiple Sclerosis. 2007;13:41-51
7. Bogner W, Gagoski B, Hess A.T et al., GABA imaging with real-time motion correction, shim update and reacquisition of adiabatic spiral MRSI. Neuroimage 2014;103: 290-302
8. Provencher SW, Estimation of metabolite concentrations from localized in vivo proton NMR spectra. Magn. Reson. Med. 1993;30(6): 672-679
9. Fischl B, Salat DH, Busa E et al., Whole brain segmentation: automated labeling of neuroanatomical structures in the human brain. Neuron 2002;33:341-355.
10. Fischl B, Salat DH, van der Kouwe AJ et al., Sequence-independent segmentation of magnetic resonance images. Neuroimage. 2004a;23 Suppl 1: S69-84.
11. Hnilicova P, Povazan M, Strasser B et al., Spatial variability and reproducibility of GABA-edited MEGA-LASER 3D-MRSI in the brain at 3T. NMR Biomed. 2016; DOI: 10.1002/nbm.3613
12. Grewal M, Dabas A, Sharan S et al., GABA quantitation using MEGA-PRESS: regional and hemispheric difference. J Magn Reson Imaging. 2016; DOI: 10.1002/jmri.25324
13. Emir UE, Auerbach EJ, Van De Moortele PF et al., Regional neurochemical profiles in the human brain measured by H MRS at 7T using local B1 shimming. NMR Biomed. 2012;25:152-160
14. Toga AW., Thompson PM. Mapping brain asymmetry. Nat. Rev. Neuroscience. 2003;4:37-48
Figures
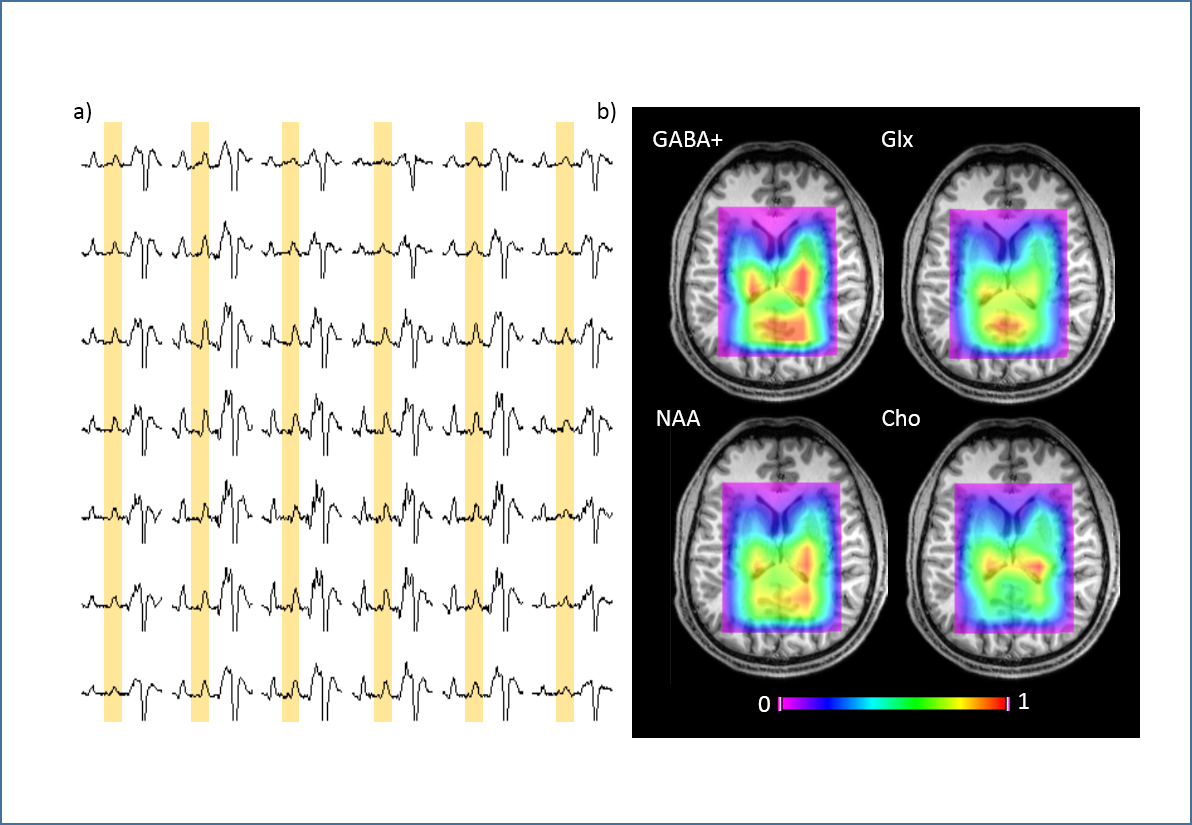
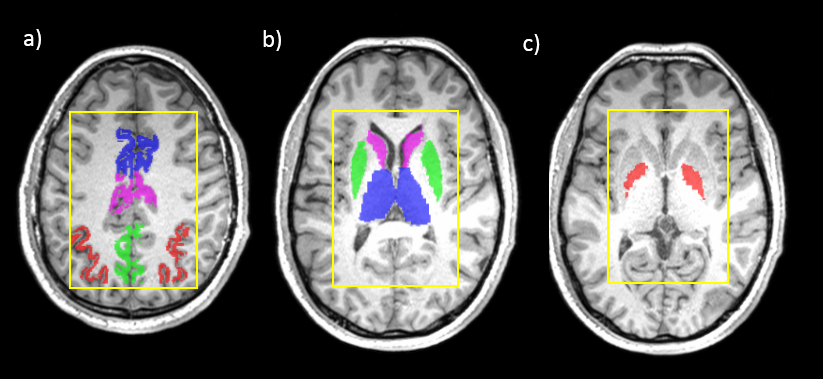
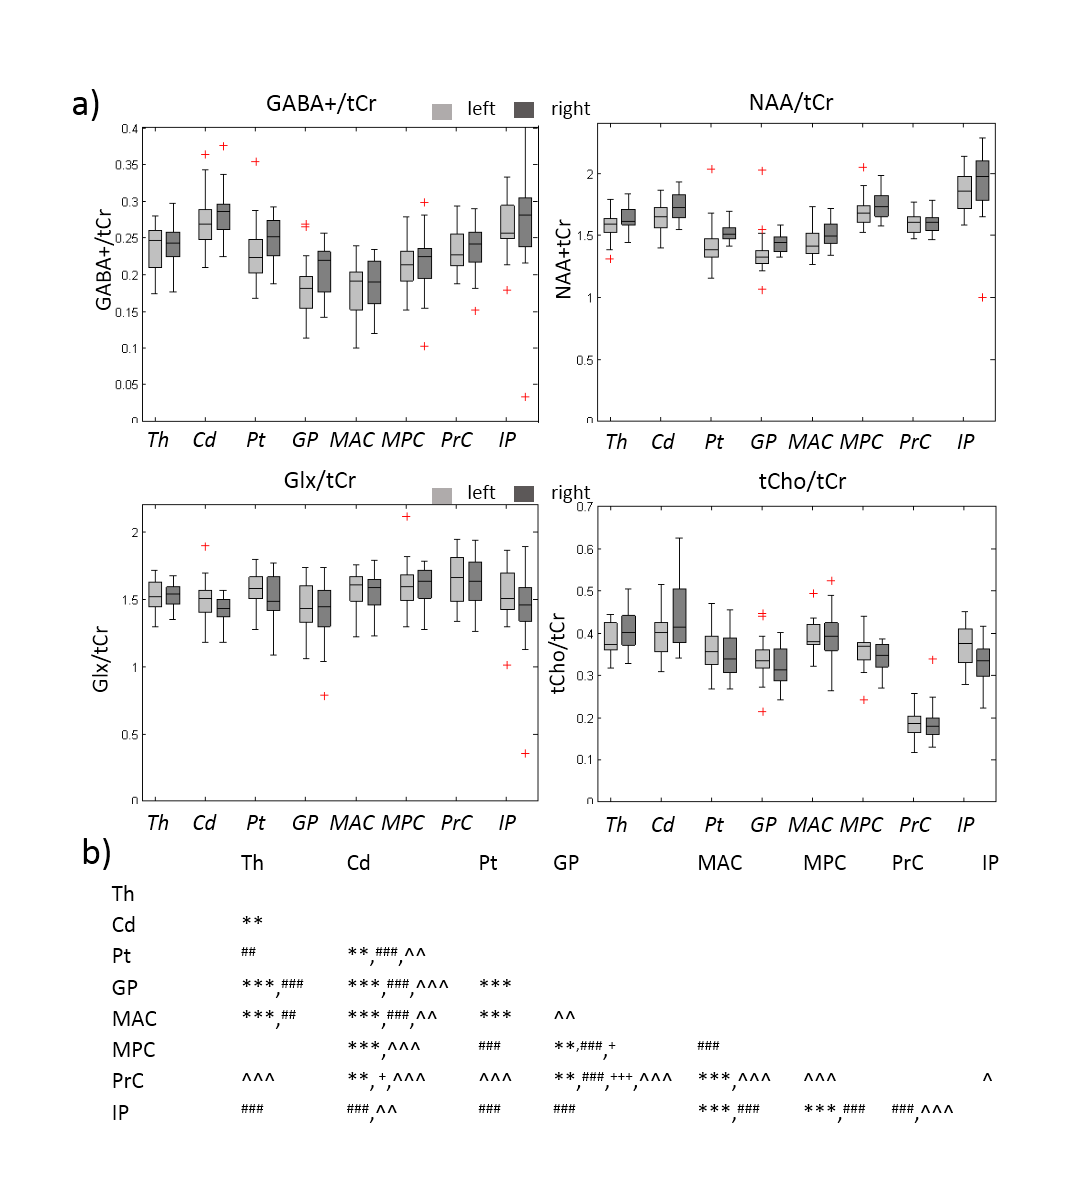
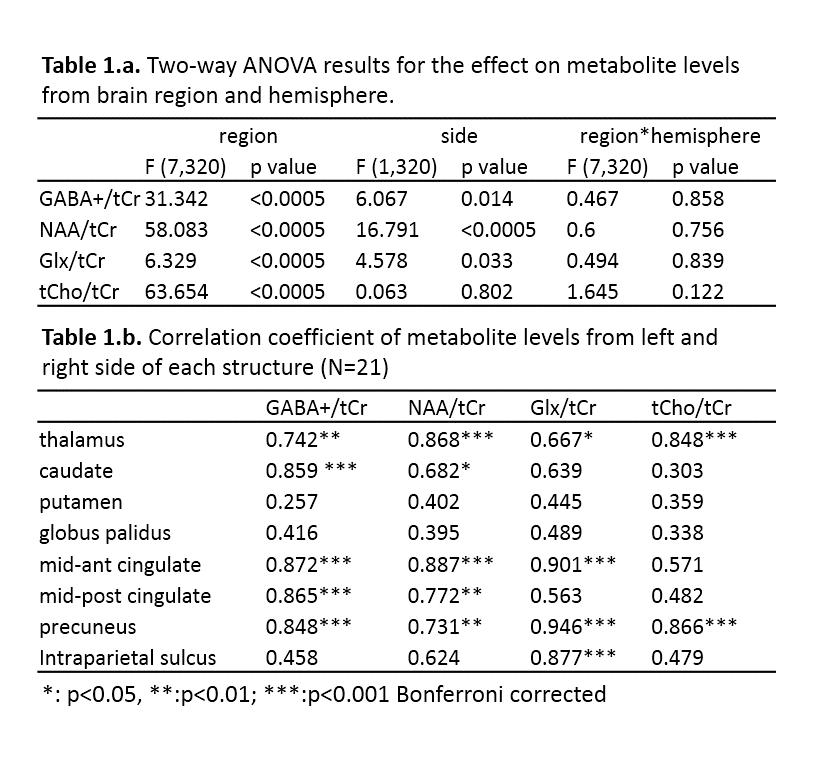
Table 1.a. Two-way ANOVA results for the effect on metabolite levels from brain region and hemisphere.
Table 1.b. Correlation coefficient of metabolite levels from left and right side of each structure (N=21)