1250
Fast non-water suppressed metabolite cycled 1H FID MRSI at both 3T and 9.4T1MPI for Biological Cybernetics, Tuebingen, Germany, 2IMPRS for Cognitive and Systems Neuroscience, Eberhard University of Tuebingen, Tuebingen, Germany, 3Institute of Physics, Ernst-Moritz-Arndt University Greifswald, Greifswald, Germany
Synopsis
The purpose of this study is to use a metabolite cycling scheme combined with FID MRSI, acquire and compare spectra and metabolite maps from both water suppressed and non-water suppressed FID MRSI at 9.4T and 3T.
Introduction
Common practice in spectroscopic imaging of the human brain is to use water suppression schemes to eliminate the water peak and reliably detect metabolites1-2. However, it has previously been shown (in single voxel spectroscopy) that the water suppression can decrease the signal from metabolites that exchange magnetization with water3. The metabolite cycling technique can overcome this problem and also facilitates a simultaneously acquired water reference for frequency, eddy current and phase correction as well as signal normalization3-6. However, due to strong B1 inhomogeneity and SAR limits at higher field strengths, using metabolite cycling for metabolite mapping is more challenging than water suppression and hence has not been demonstrated before.
The purpose of this study is to implement a metabolite cycling scheme for FID MRSI1-2 that does not prolong the scan time due to SAR restrictions and is robust against B1+ inhomogeneity. Spectra and metabolite maps from non-water suppressed FID MRSI at 9.4T and 3T were then cross-validated against water suppressed data.
Methods
A total of 7 healthy volunteers were scanned for this study (three on 3T and four on 9.4T). The studies were done on a Siemens whole-body 9.4T human scanner with an in-house developed 16Tx/31Rx coil6 (average B1+ of 16uT) and on a Siemens Prisma 3T magnet with integrated body coil and a 64 channel Tim head receive coil. Both water suppressed and non-water suppressed spectroscopic images were acquired from the brain of each volunteer in the same session. A numerically optimized 3-pulse water suppression (BW=180Hz) with a total duration of 62ms was combined with FID MRSI. The non-water suppressed datasets were acquired with a hyper-pulse8 adiabatic asymmetric inversion pulse (implemented and optimized for use on 3T and 9.4T separately):
$$ω(t)=Ω_0 \frac{\sqrt{z(1-z)}}{az+b}$$
where
$$t = \ln \frac{z^b}{(1-z)^{a+b}}$$
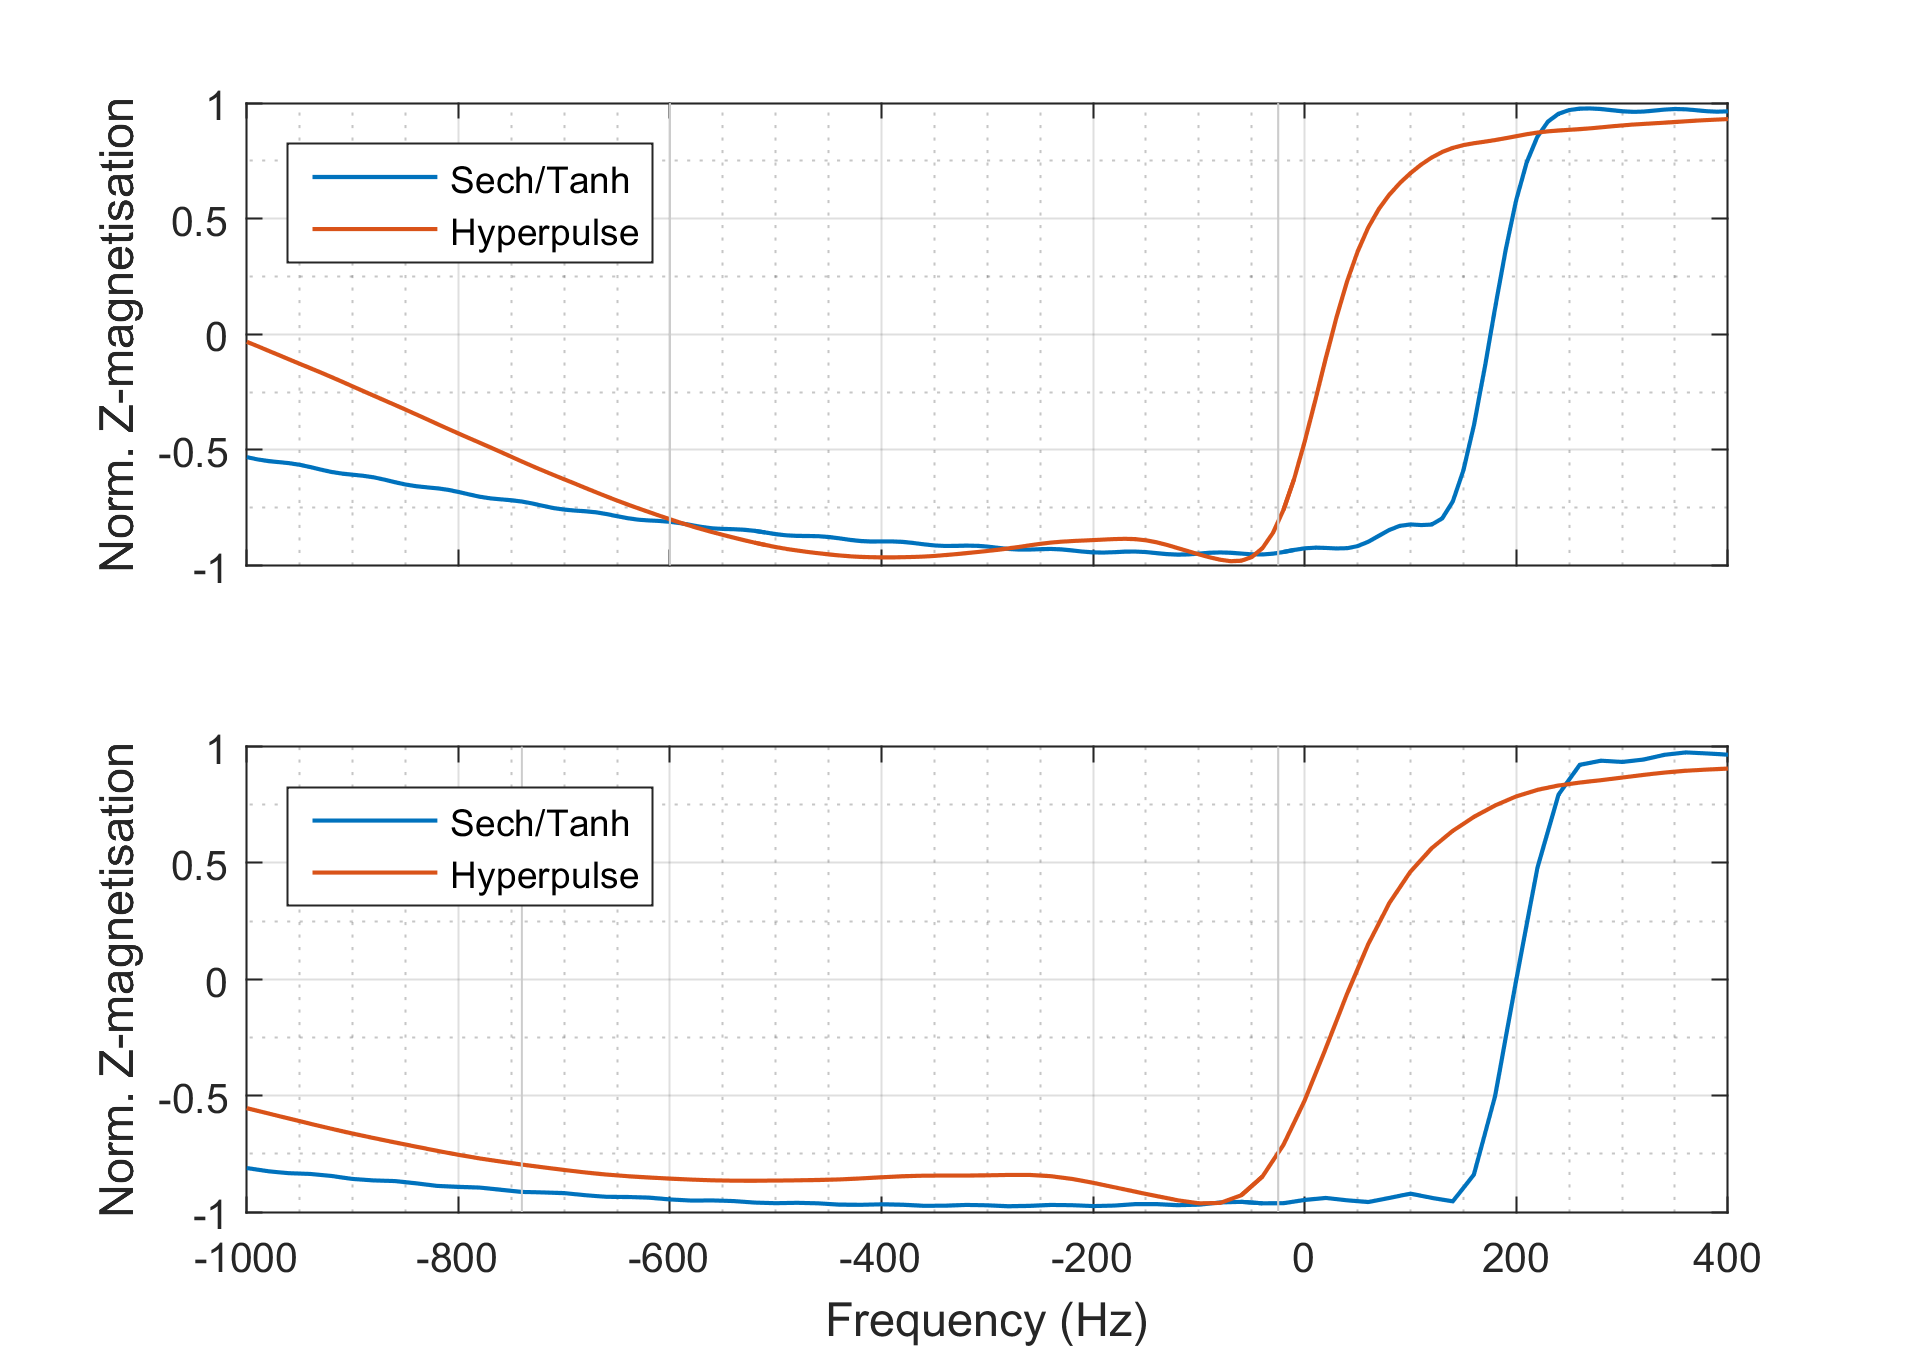
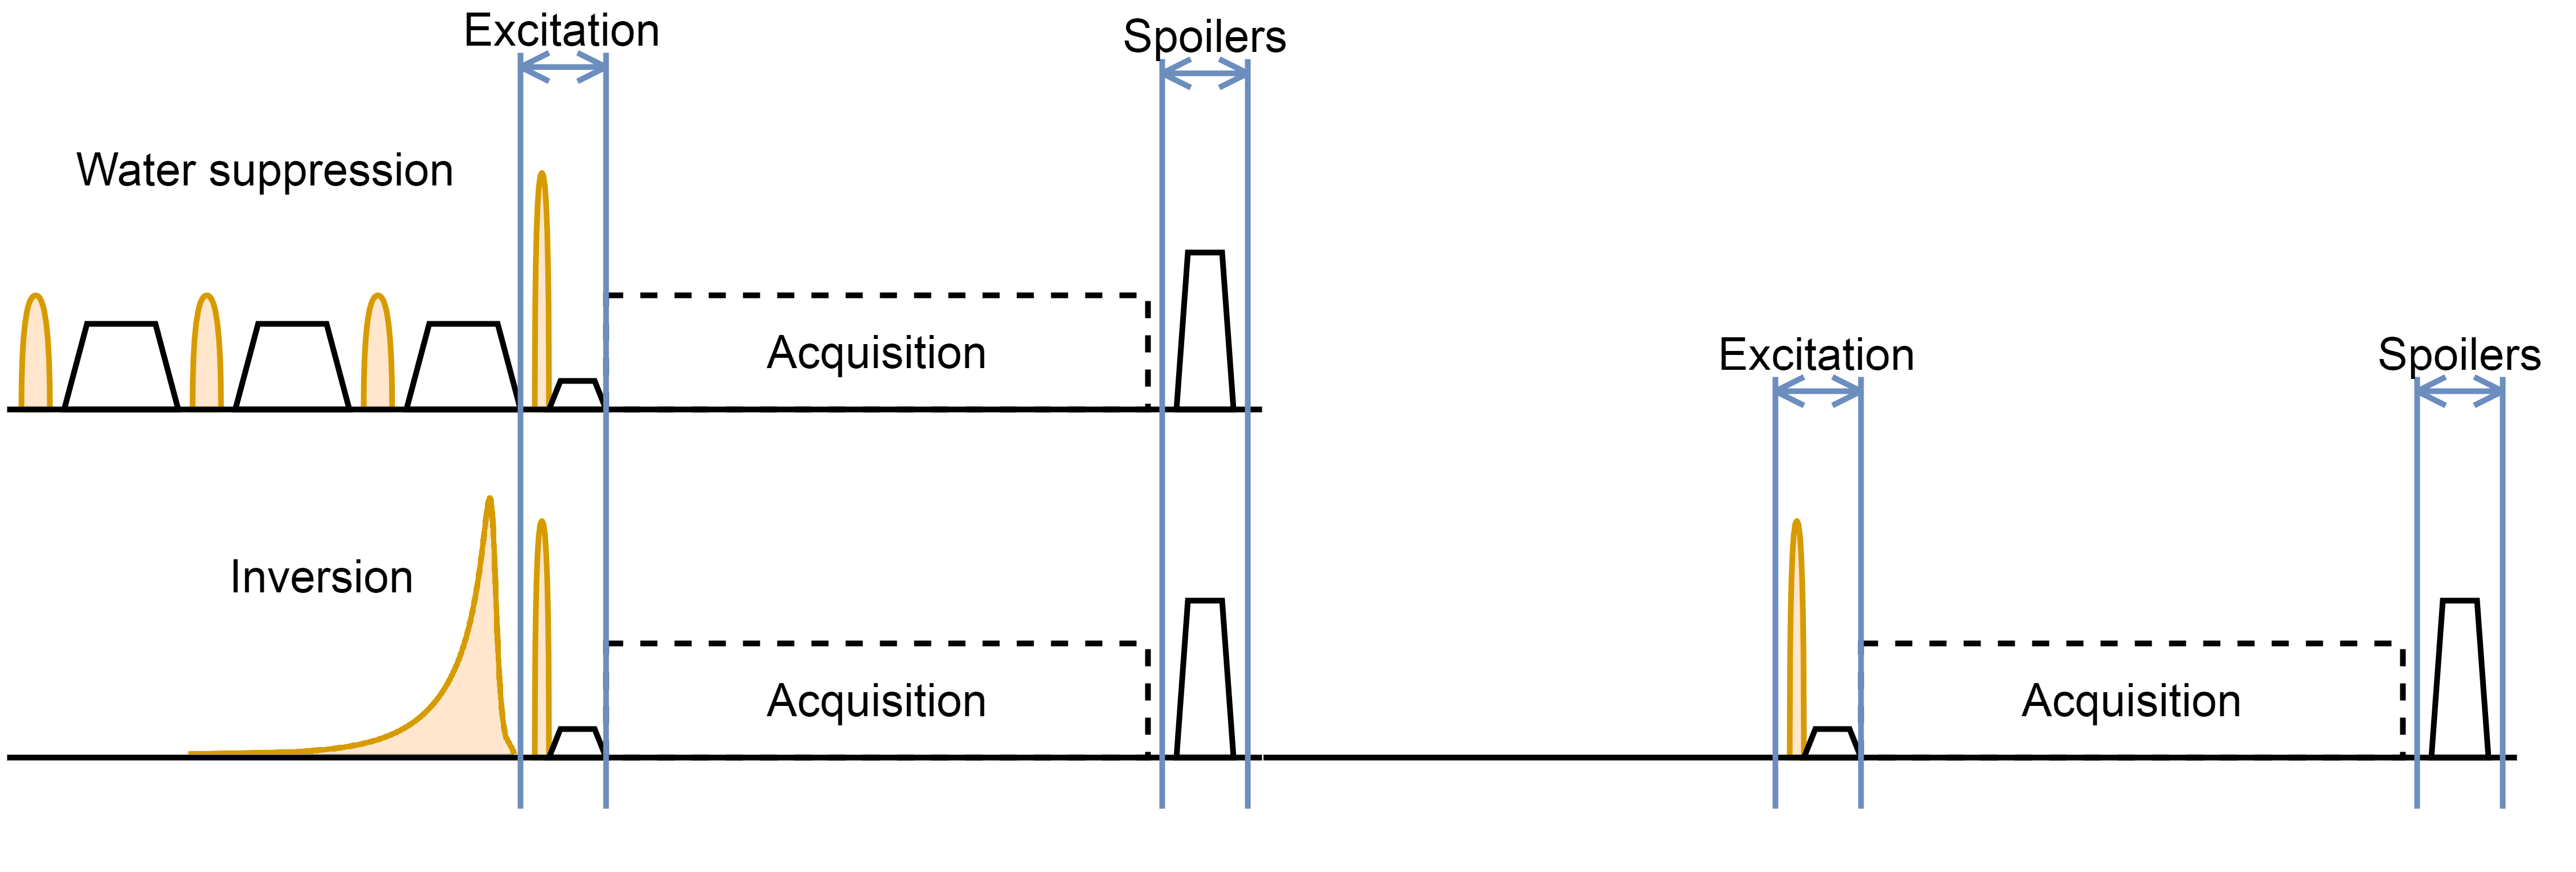
For $$$t \in [-∞, ∞]$$$, $$$z \in [0, 1]$$$ and $$$Ω_0$$$ is the amplitude of the pulse. The variables a and b are design parameters and were chosen to be 1.3 and 0.12, respectively (as recommended by Rosenfeld et al.8). This pulse was chosen due to its low SAR contribution and has 30% less SAR than the conventional sech/tanh mostly used in previous MC implementations4. The hyper-pulse and sech/tanh pulse inversion profiles are shown in Figure 1. It was used to alternately invert and not invert the metabolites while keeping the water peak untouched. The final metabolite spectrum results from subtracting the two acquisitions. The water spectrum (from addition of the two acquisitions) was used for eddy current and phase correction. Figure 2 shows a schematic of both the water and non-water suppressed pulse sequences.
Other parameters of the study includes: FOV 200mmx200mm, matrix size 32x32, slice thickness 10mm, acquisition delay 2.1/1.5ms, flip angles 55/28, bandwidth 2400Hz/6000Hz, acquisition time 425/128ms for 3T and 9.4T, respectively. TR was 220ms and 300ms (due to SAR limits) for water suppressed and non-water suppressed MRSI on 9.4T, respectively, and 550ms and 470ms for 3T.
Spectra were processed using custom software in MATLAB and fit using LCMODEL9.
Results/Discussion
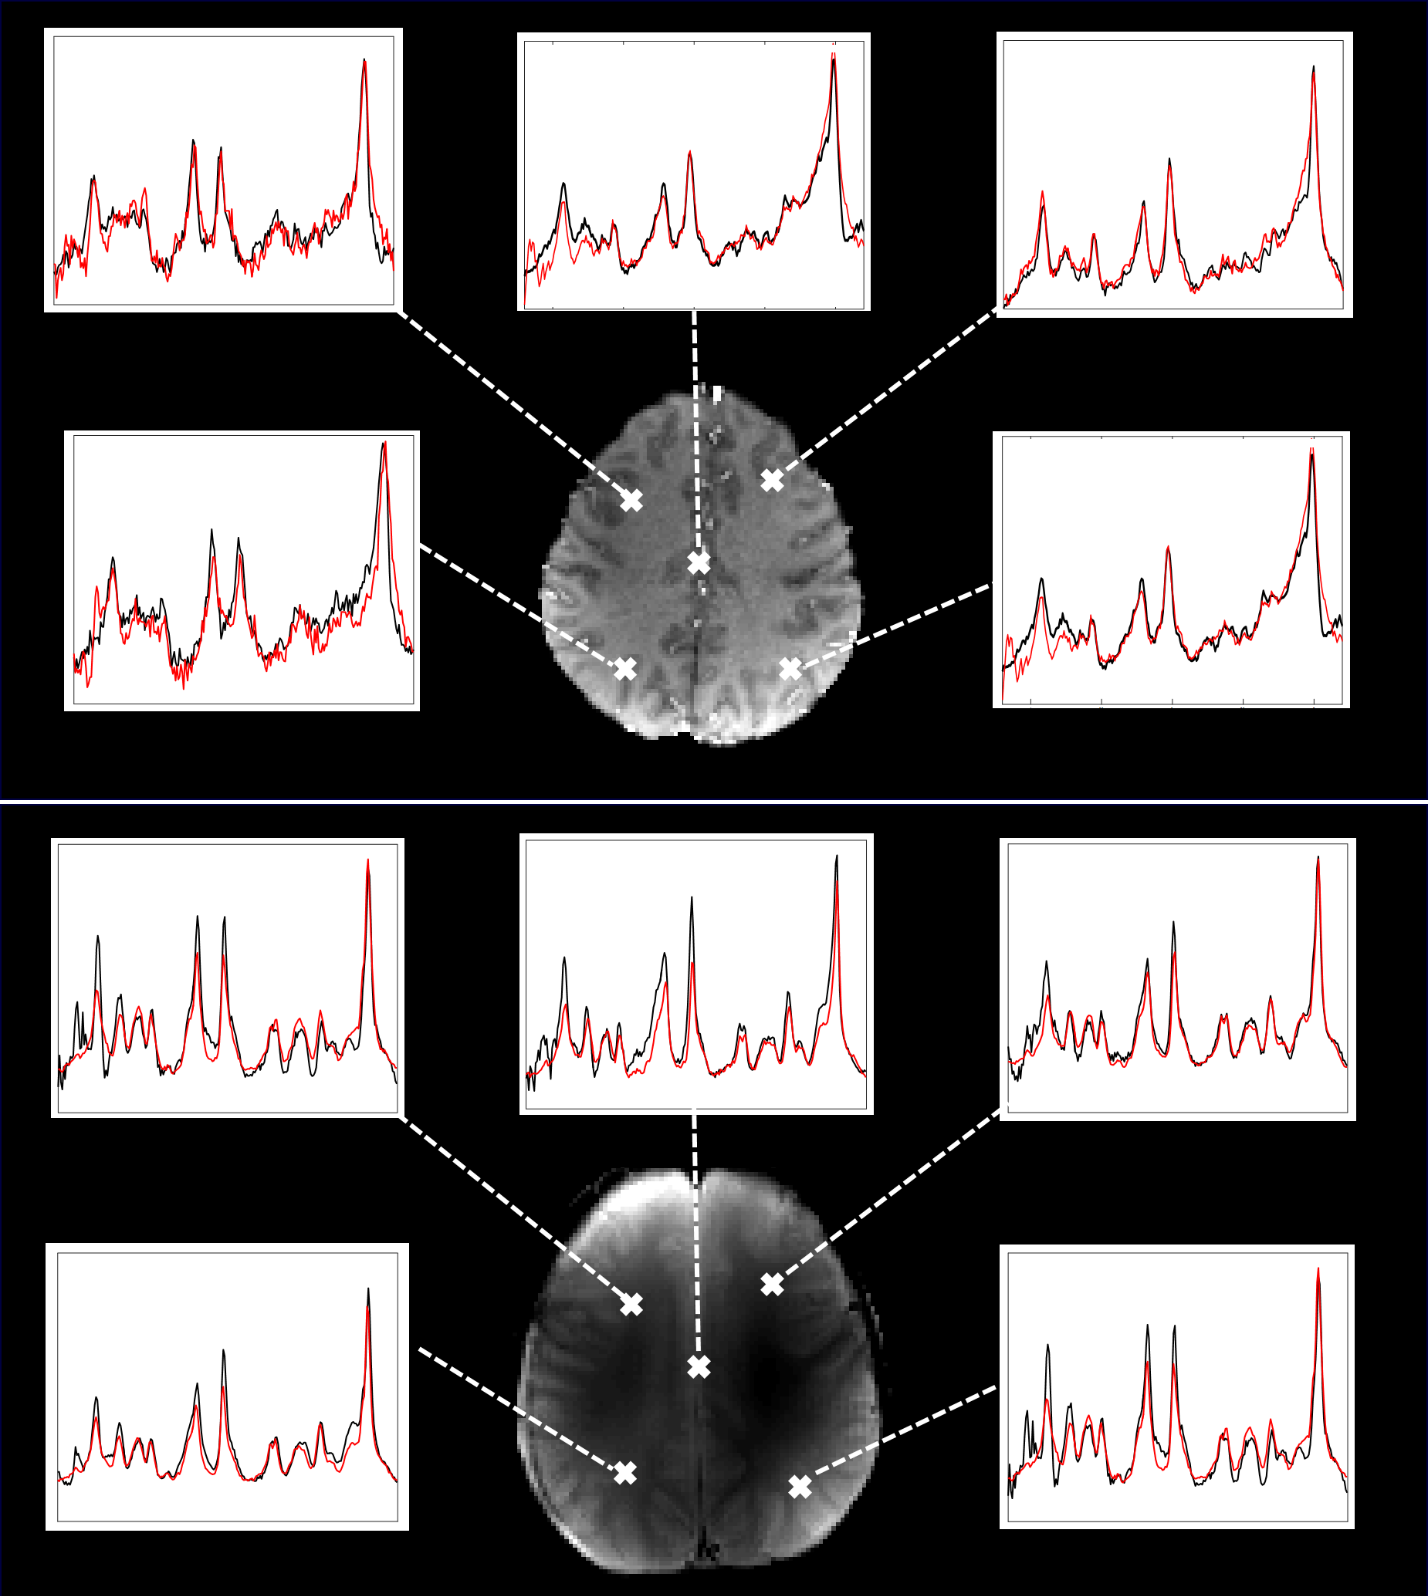
Figure 3 shows spectra from different regions of the brain acquired at 3T and 9.4T. The water suppressed spectra are overlaid with the corresponding metabolite cycled ones. This shows successful implementation of the metabolite cycling sequence for 1H FID MRSI as the spectra correspond well to the water suppressed ones.
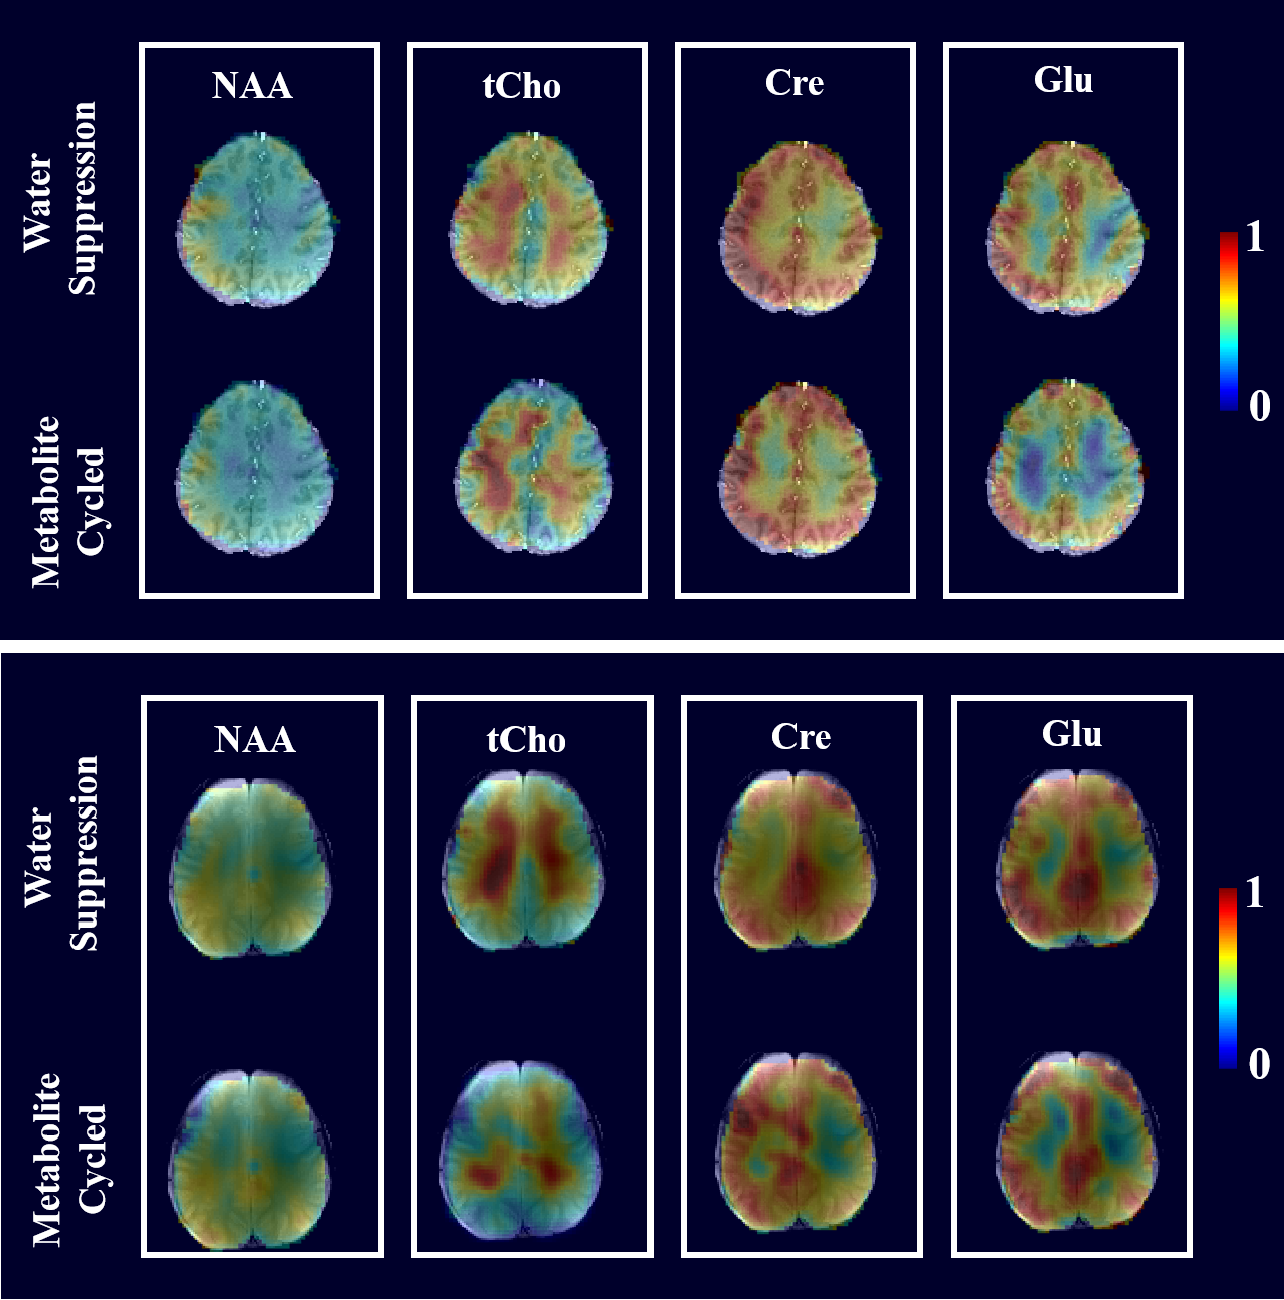
To investigate potential differences in the metabolite levels of the spectra acquired with and without water suppression, Figures 4 and 5 show both metabolite maps for 4 major metabolites for 3T and 9.4T respectively. The spatial distribution of these metabolites are highly similar for both methods on both 3T and 9.4T. Cre and Glu maps appear to show slightly more gray-versus-white matter contrast in the metabolite cycled maps. However, B1+ inhomogeneity and related effects on the water suppression pulse, inversion pulse and transition bandwidth may play a role in the observed differences at 9.4T and need to be further investigated.
Conclusion
Non-water suppressed metabolite maps were successfully acquired using a low-SAR metabolite cycling pulse incorporated in a FID MRSI sequence on both 3T and 9.4T. Comparable performance was observed in the spectra of water suppressed FID MRSI.Acknowledgements
No acknowledgement found.References
[1] Henning A et al. NMR Biomed. 2009.
[2] Bogner W et al. NMR Biomed 2012.
[3] MacMillan EL et al. MRM. 2011.
[4] Dreher W & Leibfritz D, MRM. 2005.
[5] Hock A et al. MRM. 2013.
[6] Giapitzakis I et al. Proc. of ISMRM. 2015.
[7] Fillmer A et al. Proc of ISMRM. 2016
[8] Rosenfeld et al. MRM. 1997.
[9] Provencher S. NMR Biomed. 2001.
Figures