1249
Simultaneous Mapping of Brain Metabolites, Macromolecules and Tissue Susceptibility Using SPICE1Beckman Institute for Advanced Science and Technology, University of Illinois at Urbana-Champaign, Urbana, IL, United States, 2Department of Electrical and Computer Engineering, University of Illinois at Urbana-Champaign, Urbana, IL, United States
Synopsis
In this work, we present a new imaging capability for simultaneous mapping of metabolites, macromolecules and tissue susceptibility in the brain, using a single scan for about 5 minutes. This new capability builds on the recently proposed subspace imaging framework SPICE (SPectroscopic Imaging by exploiting spatiospectral CorrElation) and uses a union-of-subspaces based approach to extract tissue susceptibility, metabolite and macromolecule spatiospectral distributions from an ultrashort-TE, short-TR, high-resolution MRSI scan without water suppression. In vivo results were used to demonstrate this exciting capability.
Introduction
SPICE (SPectroscopic Imaging by exploiting spatiospectral CorrElation) has emerged as an effective approach to achieving rapid, high-resolution MRSI by using subspace-based data acquisition and processing strategies1. Using SPICE with FID-based ultrashort-TE, short-TR acquisition, 3D 1H-MRSI of the brain at an approximately 3mm isotropic resolution in less than 10 minutes has been demonstrated2,3. We present here simultaneous mapping of low-molecular-weight metabolites, macromolecules, and tissue susceptibility (QSM) in the brain from a single SPICE scan (in about 5min). This unprecedented capability offers much richer and complementary information than conventional MRSI or QSM scans alone.Data Acquisition
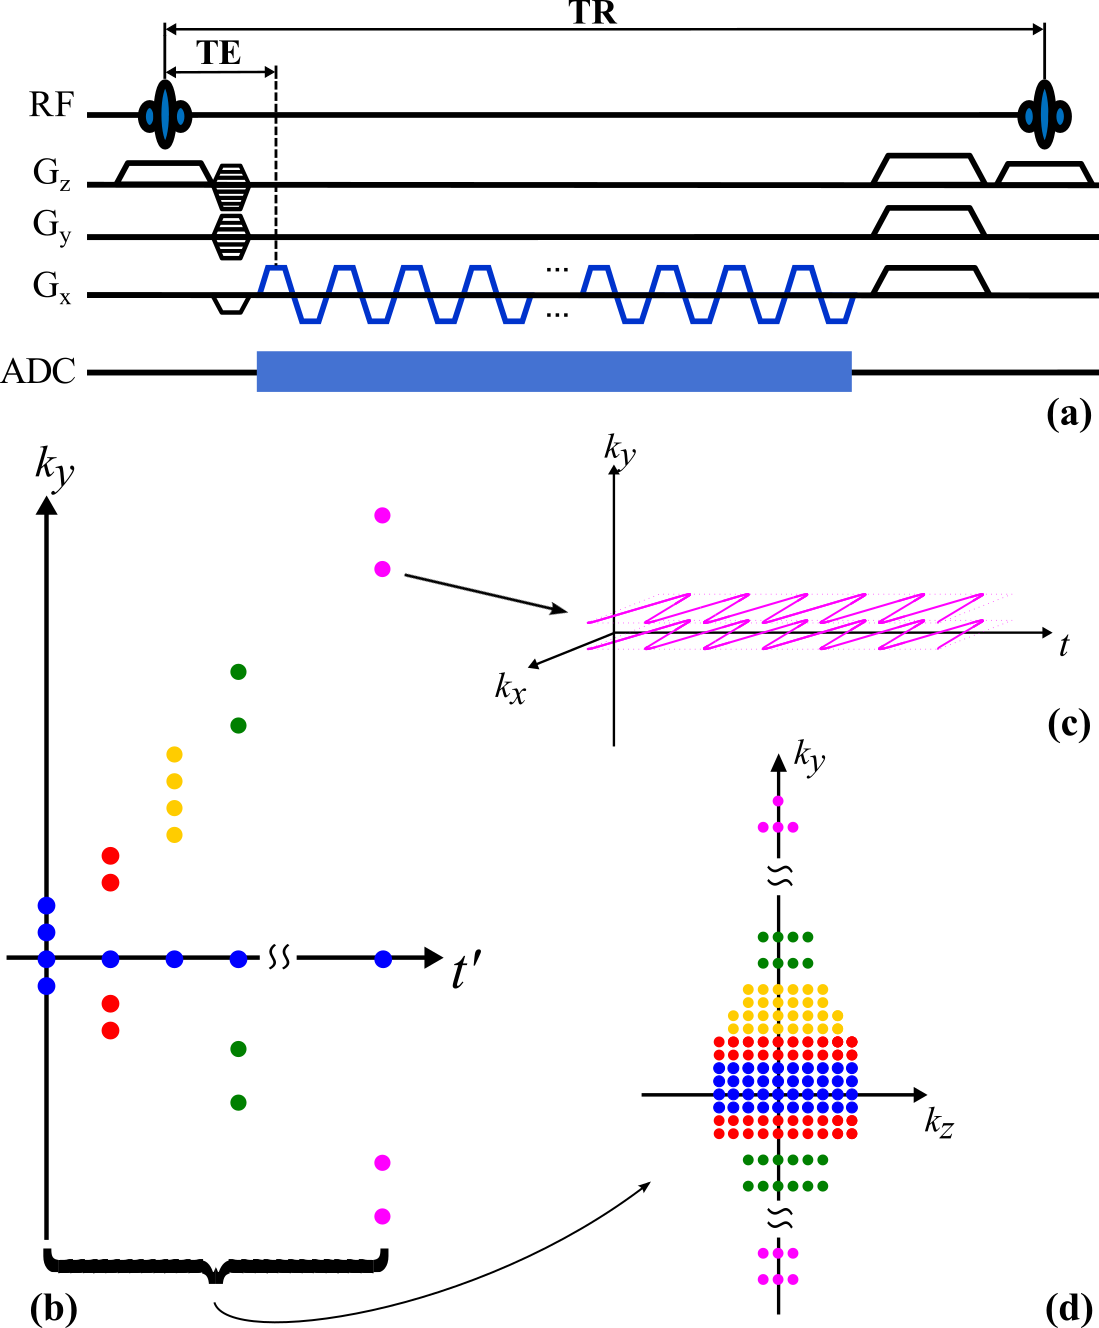
The proposed data acquisition method is characterized by several key features (illustrated in Fig. 1). First, we used an ultrashort-TE (<4ms) and very-short-TR (~200ms) acquisition without water/lipid suppression, which maximizes SNR efficiency and enables fast collection of MRSI data from both metabolites and macromolecules4-6. Second, an EPSI-like trajectory was used for rapid spatiospectral encoding within each TR, encoding both the chemical shift and the water phase variations for QSM. Third, a special time-interleaving sampling scheme was employed that divides the data acquisition period into multiple segments each covering a portion of k-space. This allows for tracking and correcting frequency drifts and is robust to motion. Finally, a combination of elliptical sampling and parallel imaging based sparse sampling was designed to cover sufficient k-space to achieve a nominal 2x2.5x3mm3 resolution in 5min (or 2x2x3mm3 in 6min).Data Processing
We use a novel approach to extract QSM, metabolite and macromolecule information from a single SPICE-MRSI data set using the following union-of-subspaces framework3,8
\begin{eqnarray*}\rho(\mathbf{r},t) & = & \sum_{l_{w}=1}^{L_{w}}c_{l_{w}}(\mathbf{r})\phi_{l_{w}}(t)+\sum_{l_{f}=1}^{L_{f}}c_{l_{f}}(\mathbf{r})\phi_{l_{f}}(t)+\sum_{l_{m}=1}^{L_{m}}c_{l_{m}}(\mathbf{r})\phi_{l_{m}}(t)+\sum_{l_{b}=1}^{L_{b}}c_{l_{b}}(\mathbf{r})\phi_{l_{b}}(t).\\\end{eqnarray*}
Note that: a) each set of temporal bases $$$\left\{\phi_{l_x}(t)\right\}$$$ in the model spans a low-dimensional subspace, which significantly reduces the numbers of unknowns and makes high-SNR reconstruction from limited data possible; b) the water, lipids, metabolites, and macromolecules are represented by different subspaces, each with distinct structures (e.g., water proton's unique frequency and macromolecules’ short-T2, etc), allowing for an effective separation of these components; c) the explicit subspace representation allows individual subspaces to be predetermined from training data specifically designed for different components. Specifically, the proposed data processing scheme includes the following components.
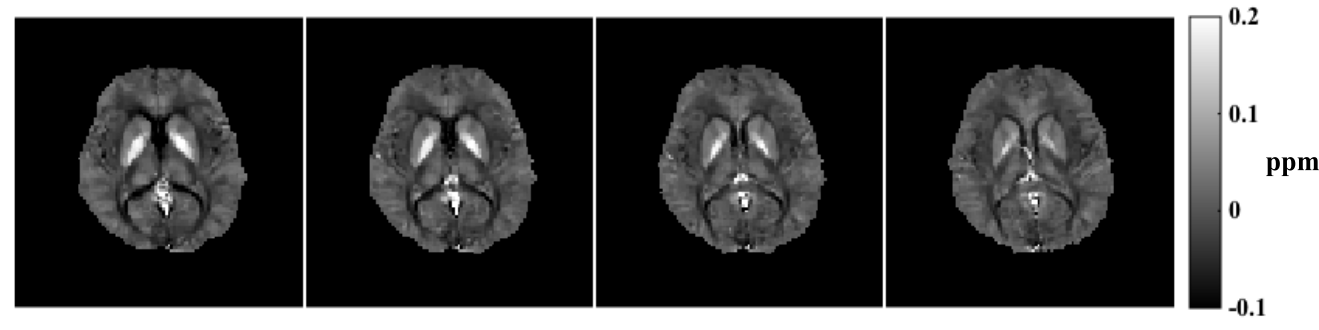
QSM: Our MRSI data capture full spectroscopic information of the water protons thus provide all the information needed to determine the tissue susceptibility variations. The specific issues associated with the proposed acquisition are 1) sparse sampling and 2) relatively limited k-space coverage compared to conventional QSM. We address the first issue using parallel imaging and the second using a super-resolution reconstruction, incorporating both rank and sparsity constraints1. This allows for an improved resolution at 2mm isotropic. QSM processing is done using the pipeline in [7].
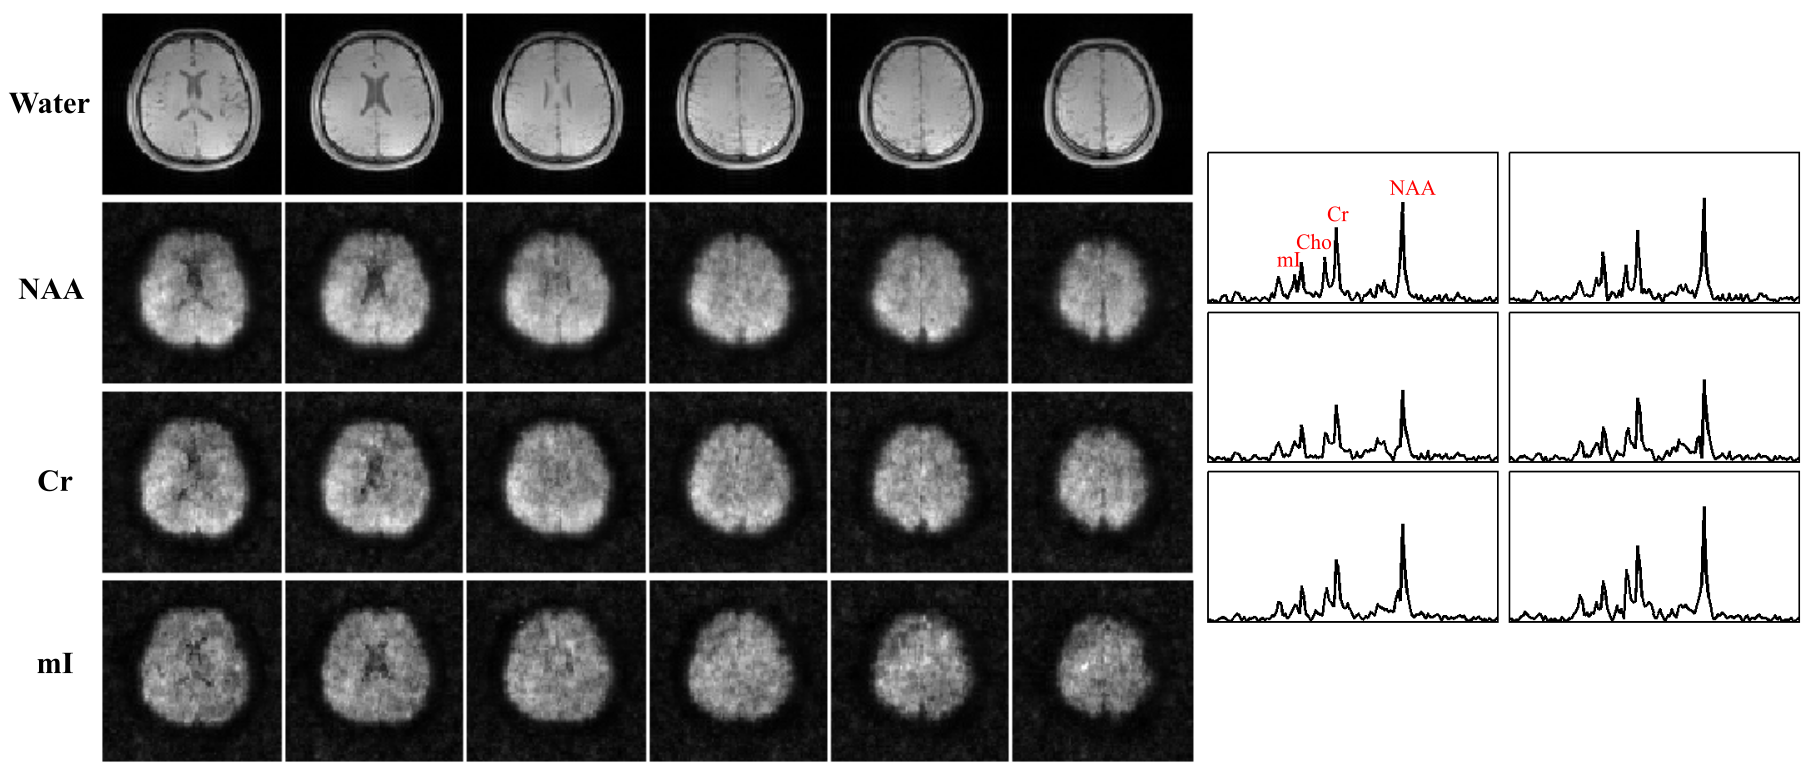
Metabolite Mapping: The key issues associated with metabolite mapping are 1) removal of the water/lipid signals and 2) spatiospectral reconstruction from the noisy water/lipids-removed data. Using the union-of-subspaces model and water/lipid spectral priors, we can estimate a B0 distribution and the water/lipid bases from the SPICE-MRSI data, and effectively remove the water/lipids signals3,8. To address the reconstruction issue, we predetermined a set of spectral/temporal bases from high-SNR training data2, which enables reconstruction from the noisy spatiospectral encodings using a regularized least-squares formulation integrating sensitivity encoding, subspace and spatial priors.
Macromolecule Mapping: Our ultrashort-TE acquisition inherently encodes the signals from the macromolecules. The key issue here is the separation of the macromolecule signals from the metabolites. To this end, we predetermined a macromolecule subspace from ultrashort-TE FID-CSI training scans and built it into the union-of-subspaces reconstruction model. A time-segmented reconstruction strategy was employed to further take advantage of the short-T2 nature of macromolecules.
Results
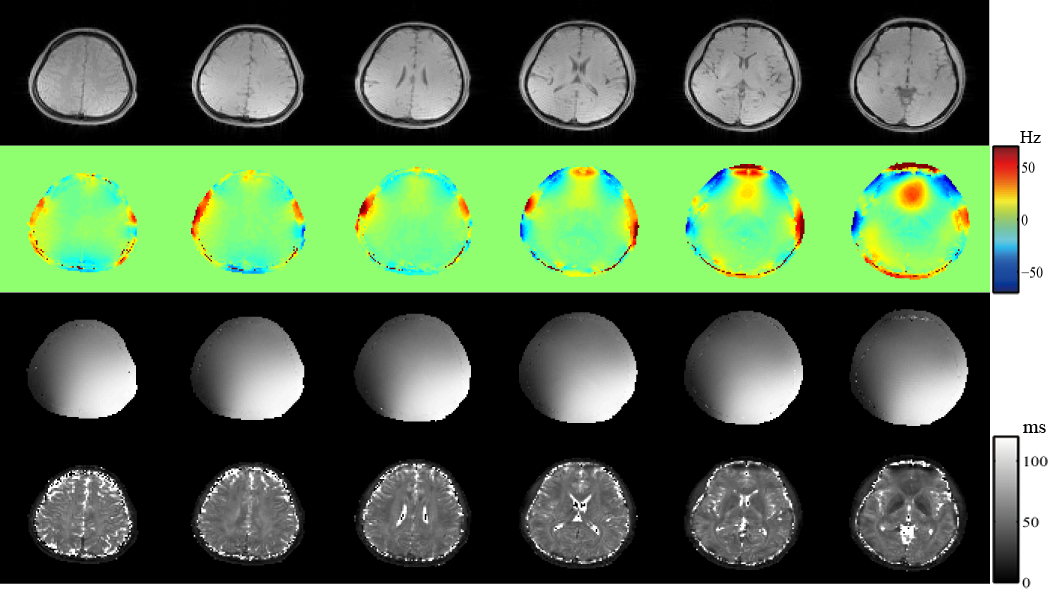
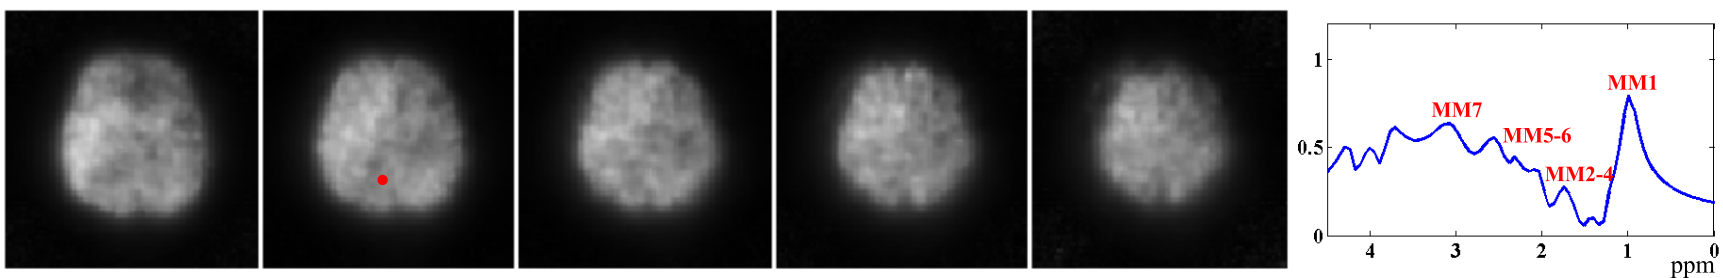
Results from in vivo data (healthy volunteers on a Siemens Trio 3T system with IRB approval) were shown in Figs. 2-5 to demonstrate the new imaging capability. The data were acquired with FOV=240x240x72mm3, matrix size=120x96x24, TR/TE=210/4ms, ADC bandwidth=167kHz, 92 echo pairs with 1.78ms spacing, and x1.5 parallel imaging acceleration. QSM of the brain reconstructed at 2mm isotropic resolution is shown in Fig. 2. Figure 3 illustrates other information derived from the companion water signals using the proposed processing. The metabolite reconstruction at an approximately isotropic 3mm resolution is presented in Fig. 4. As can be seen, very high-resolution metabolite maps and high-quality spatially-resolved spectra were successfully obtained. Figure 5 demonstrates the macromolecule mapping results.Conclusion
We presented an exciting new capability for simultaneous metabolite, macromolecule, and tissue susceptibility mapping of the brain from a single SPICE acquisition, enabled by an effective integration of ultrashort-TE, very-short-TR, EPSI-based acquisition, parallel imaging and subspace-based data processing. We expect this new capability to be useful for a range of brain studies.Acknowledgements
This work was supported in part by the following research grants: NIH-R21-EB021013-01 and NIH-1RO1-EB013695, and a Beckman Institute Postdoctoral Fellowship.References
[1] Lam F, Ma C, Clifford B, Johnson CL, and Liang ZP, High-resolution 1H-MRSI of the brain using SPICE: Data Acquisition and Image Reconstruction. Magn. Reson. Med., 2016;76:1059-1070.
[2] Sheikh MA, Lam F, Ma C, Clifford B, and Liang ZP, Rapid, high-resolution 3D 1H-MRSI of the brain based on FID acquisitions. Proc. Intl. Soc. Mag. Reson. Med., 2016, p. 2353.
[3] Lam F, Ning Q, Clifford B, Ma C, and Liang ZP, Ultrahigh-resolution, volumetric 1H-MRSI of the brain without water/lipid suppression. ISMRM MR Spectroscopy Workshop, Germany, 2016.
[4] Henning A, Fuchs A, Murdoch JB, and Boesiger P, Slice-selective FID acquisition, localized by outer volume suppression (FIDLOVS) for 1H-MRSI of the human brain at 7T with minimal signal loss. NMR Biomed., 2009;22:683-696.
[5] Bogner W, Gruber S, Trattnig S, and Chmelik M, High-resolution mapping of human brain metabolites by free induction decay 1H MRSI at 7T. NMR Biomed., 2012;25:873-882.
[6] Hangel G, Strasser B, Povazan M, Hingerl L, Chmelik M, Gruber S, Trattnig S, and Bogner W, Metabolic mapping of the brain using ultra-high resolution MRSI at 7T. Proc. Intl. Soc. Mag. Reson. Med., 2016, p. 387.
[7] Wang Y and Liu T, Quantitative susceptibility mapping (QSM): Decoding MRI data for a tissue magnetic biomarker. Magn. Reson. Med., 2015;73:82-101. http://weill.cornell.edu/mri/pages/qsm.html.
[8] Ma C, Lam F, Johnson CL, and Liang ZP, Removal of nuisance signals from limited and sparse 1H MRSI data using a union-of-subspaces model. Magn. Reson. Med., 2016;75:488-497.
Figures