1246
Improved mapping of epileptic networks based on the correlation of BOLD-fMRI dynamic functional connectivity components with simultaneous EEG1ISR-Lisboa/LARSyS and Department of Bioengineering, Instituto Superior Técnico, Universidade de Lisboa, Lisbon, Portugal, 2Department of Neurophysiology, Centro Hospitalar Psiquiátrico de Lisboa, Lisboa, Portugal
Synopsis
We propose the use of BOLD dynamic functional connectivity (dFC) analyses to provide further insights into the dynamics of epileptic networks, in simultaneous EEG-fMRI studies. We performed brain parcellation using the AAL atlas and estimated dFC across brain regions using sliding-window correlation. We then tested different approaches for the extraction of functional networks related with the EEG epileptic activity. We found that PCA is a suitable tool to disentangle functional connectivity changes of different origins, and that epilepsy-related networks may be accurately identified based on the correlation of their weights time-courses with metrics of EEG epileptic activity in four patients.
Purpose
One of the assumptions underlying standard EEG-correlated fMRI analyses is that functional connectivity is static. However, it is now clear that functional connectivity changes over time scales of seconds and minutes. This is particularly relevant in epilepsy, which is characterized by a continuous interchange between epileptic and normal states intimately related with the spontaneous occurrence of epileptic activity1. Here, we aimed to capture the dynamics of epileptic brain networks, by analysing the dynamic functional connectivity (dFC) of whole-brain BOLD-fMRI data, and combining this with the simultaneously recorded EEG epileptic activity using two different approaches, on simultaneous EEG-fMRI data collected from four epilepsy patients.Methods
Data acquisition and pre-processing: Four patients with focal epilepsy were studied on a 3T MRI system using an MR-compatible 32-channel EEG system. BOLD-fMRI data were obtained using 2D-EPI (TR/TE=2500/50 ms) concurrently with EEG, and subjected to physiological noise reduction and standard pre-processing steps2. EEG data were MR-induced artefact corrected and band-pass filtered (1-45 Hz). A representative time-course of epileptic activity was extracted from the EEG based on the following steps: ICA decomposition, selection of an epilepsy-related IC3, extraction of the root mean square frequency (RMSF) by Morlet Wavelet time-frequency decomposition4, convolution with the canonical haemodynamic response function, and downsampling to the fMRI sampling rate.
dFC estimation: Brain parcellation was performed using the automated anatomical labelling (AAL) atlas5, co-registered with each patient’s data, and the BOLD signal was then averaged within each parcel. dFC was estimated by a sliding-window approach6 (window length=37.5s, step=5s), whereby the pair-wise Pearson correlation coefficient is computed across all parcel-averaged BOLD signals for each sliding window. The final dFC matrix was obtained by extracting the upper triangular part of the correlation matrices and vectorising it.
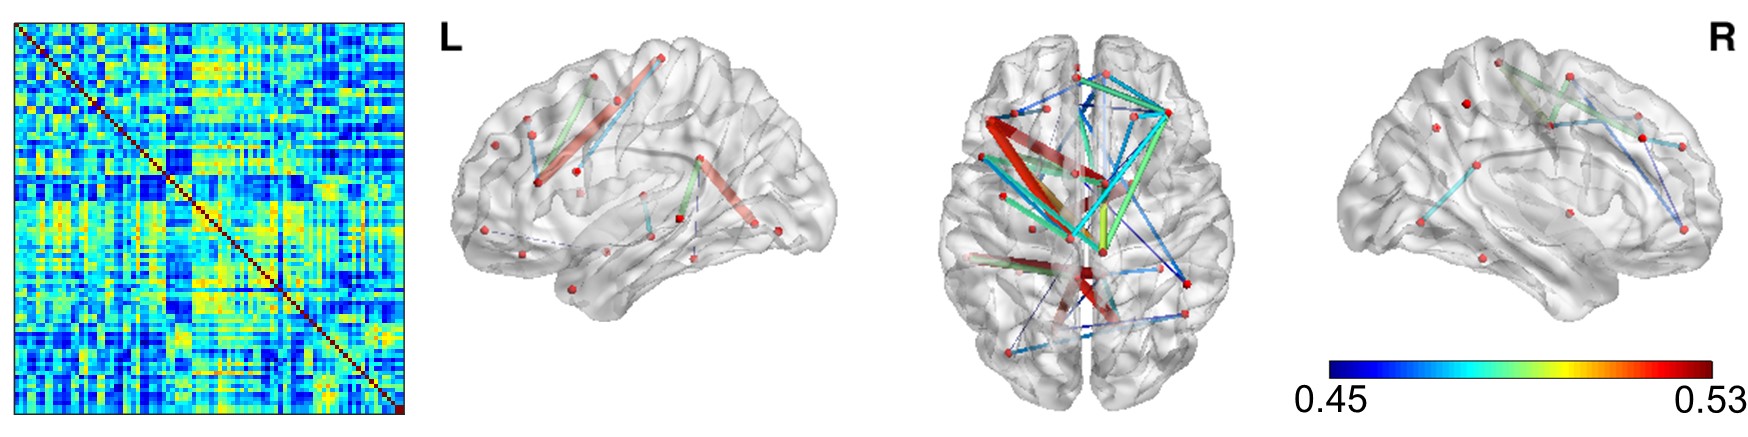
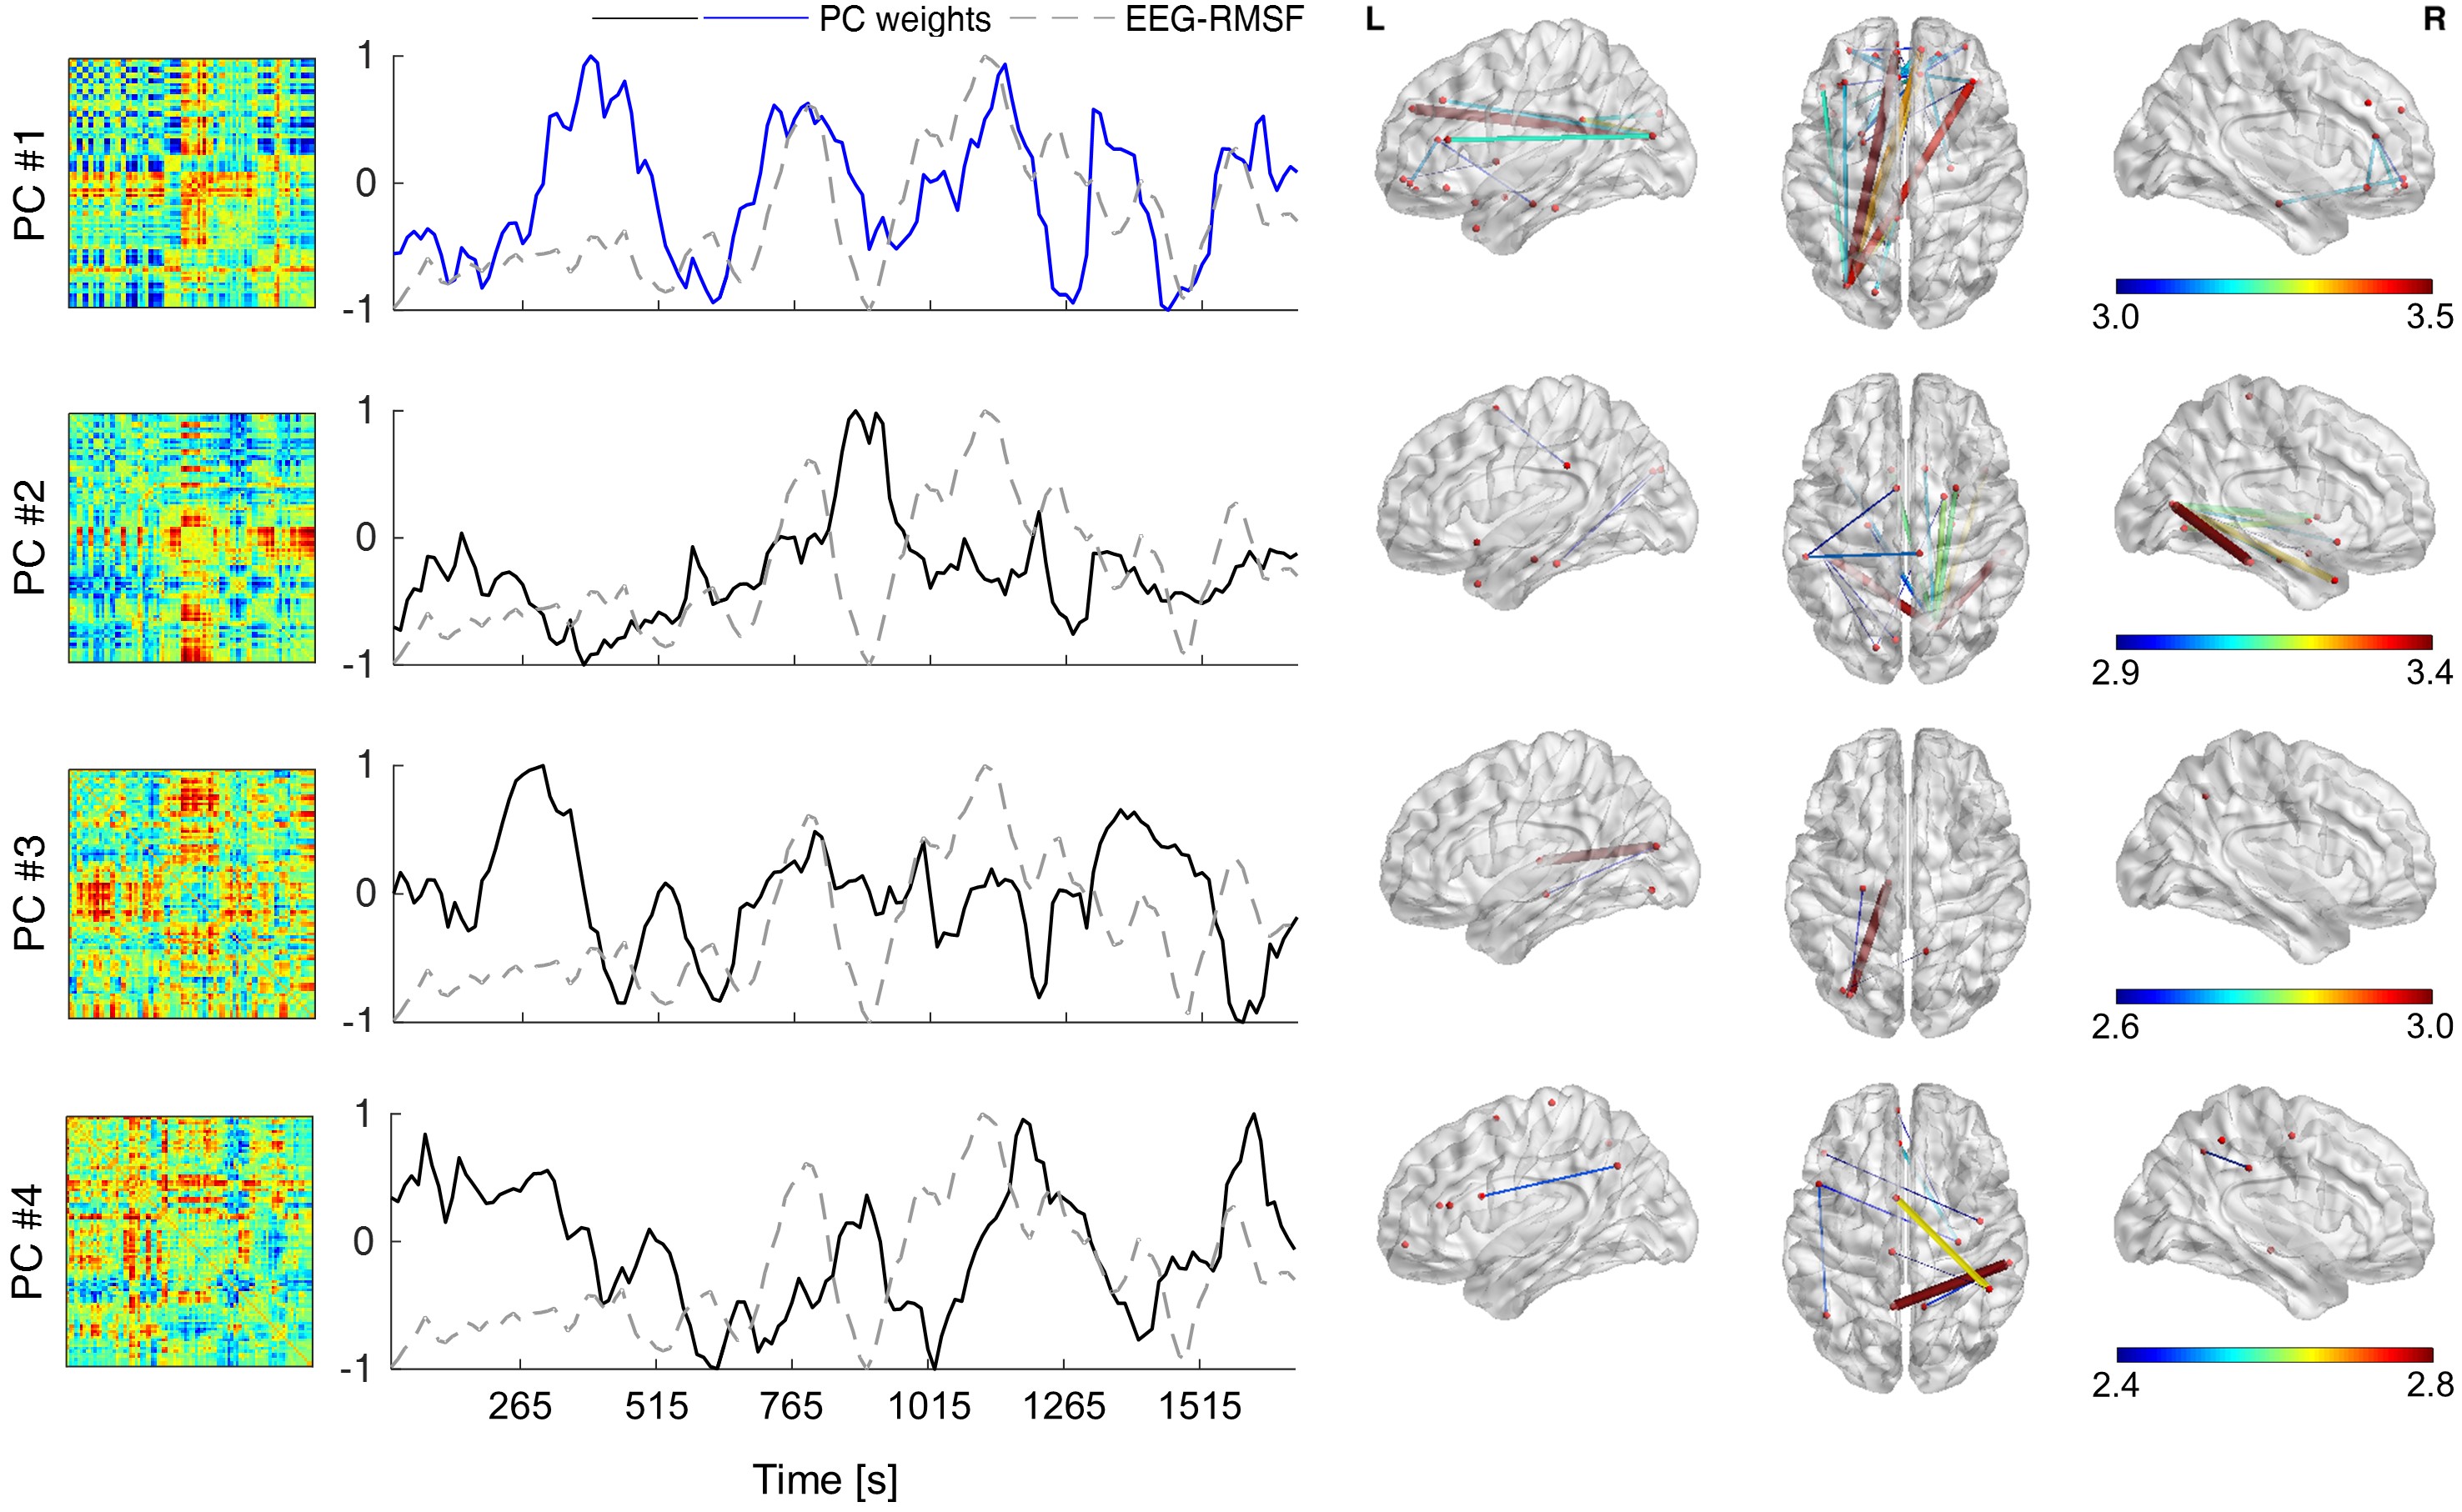
Identification of epileptic networks: Two approaches were followed. First, the Pearson correlation coefficient between the EEG-RMSF and each dFC time-course was computed, yielding a single correlation matrix; the epileptic network only comprised parcels exhibiting significant correlations (p<0.05)1. Second, the dFC matrix was subjected to PCA (after row-wise demeaning), so as to separate the most prominent connectivity fluctuations within the dFC matrix7. The number of PCs was determined by statistically testing the associated eigenvalues against a null distribution derived from phase randomized dFC matrices. Each PC consists of a network of brain parcels, which contributes to the overall dFC with an associated weight at each time point. Epileptic networks were identified as the PCs exhibiting weight time-courses that were significantly correlated with the EEG-RMSF. For comparison purposes, an univariate fMRI analysis was also performed, by fitting a general linear model (GLM) to the BOLD data using the EEG-RMSF as regressor, and cluster thresholding the resulting maps using voxel Z>2.3 and cluster p<0.05.
Results
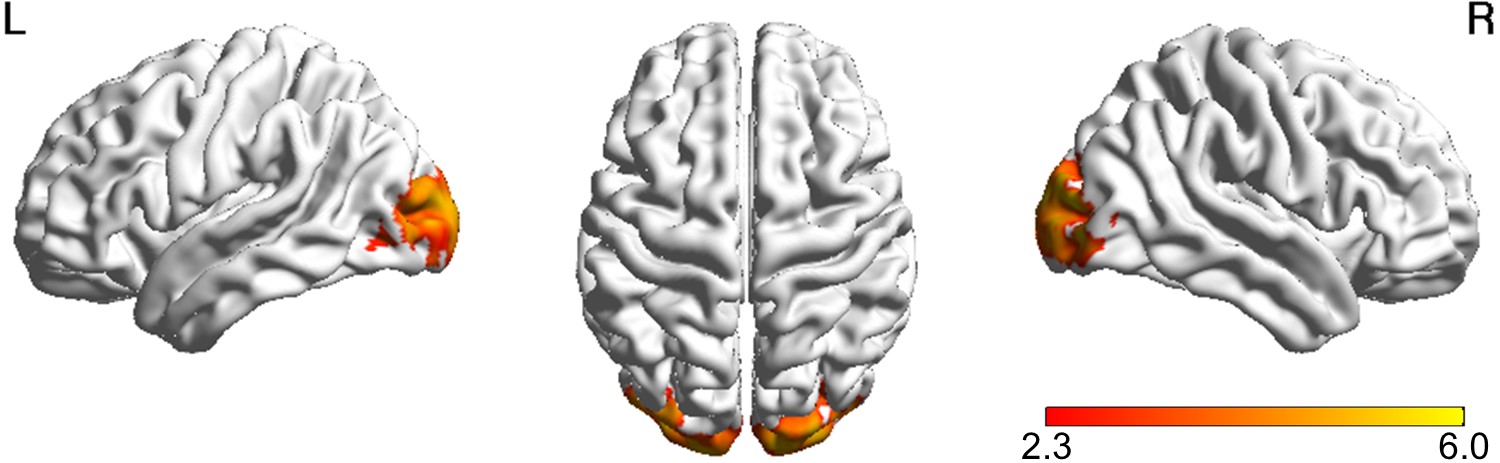
The results are shown for an illustrative patient, with epileptic activity observed over the left posterior occipital-temporal lobe, and apparent propagation to the frontal lobe. Fig. 1 presents the map of epileptic activity obtained by GLM analysis, exhibiting voxels within posterior brain regions bilaterally, but no voxels in frontal regions. Fig. 2 presents the results of the correlation between the dFC time-courses and the EEG-RMSF, including the 3D representation8 of the network obtained by considering only the top 15% absolute values of the connection strength. This network was deemed implausible for this patient, mostly due to the lack of specificity. Fig. 3 presents the results of the dFC PCA analysis: the 4 PCs whose eigenvalues survived statistical testing are shown, including the associated correlation matrices, weight time-courses superimposed with the EEG-RMSF regressor, and 3D representations of the networks (same threshold as in Fig. 2). Only the weight time-course of the first PC was significantly correlated with the EEG-RMSF, and this yielded a network consisting of a clearly lateralized left occipital-temporal region (left middle occipital gyrus), with strong connections with both right and left frontal regions (middle frontal gyrus and anterior cingulate gyrus), which in turn also exhibit connections within the inferior frontal gyrus. This was deemed a plausible network for this patient, in contrast to the one obtained by simple correlation of the dFC time courses with the EEG-RMSF. In general, concordant patterns were obtained with dFC PCA analyses for the remaining three patients.Conclusion
We show that mapping epileptic networks by simultaneous EEG-fMRI may be significantly improved by taking into account the dynamics of epileptic activity and associated functional connectivity. We found that PCA is a suitable tool to disentangle functional connectivity changes of different origins, and that epilepsy-related networks may then be accurately identified by correlating their weights time-courses with metrics of EEG epileptic activity.Acknowledgements
We acknowledge the Portuguese Science Foundation (FCT) for financial support through Project PTDC/SAUENB/112294/2009, Project PTDC/EEIELC/3246/2012, Grant UID/EEA/50009/2013 and the Doctoral Grant PD/BD/105777/2014.References
1. Preti, MG et al. Epileptic network activity revealed by dynamic functional connectivity in simultaneous EEG-fMRI. 2014 IEEE 11th International Symposium on Biomedical Imaging (ISBI). IEEE, 2014.
2. Abreu, R et al. Physiological noise correction using ECG-derived respiratory signals for enhanced mapping of spontaneous neuronal activity with simultaneous EEG-fMRI. NeuroImage. 2016.
3. Abreu, R et al. Objective selection of epilepsy-related independent components from EEG data. J. Neurosci. Methods. 2016; 258:67-78.
4. Leite, M et al. Transfer function between EEG and BOLD signals of epileptic activity. Front. Neurol. 2013; 4:1-13.
5. Tzourio-Mazoyer, N et al. Automated anatomical labelling of activations in SPM using a macroscopic anatomical parcellation of the MNI MRI single-subject brain. NeuroImage. 2002; 15:273-289.
6. Hutchison, RM et al. Dynamic functional connectivity: promise, issues, and interpretations. NeuroImage. 2013; 80: 360–378.
7. Leonardi, N et al. Principal components of functional connectivity: A new approach to study dynamic brain connectivity during rest. NeuroImage. 2013; 83: 937–950.
8. Xia, M et al. BrainNet Viewer: a network visualization tool for human brain connectomics. PLoS ONE. 2013; 8(7).
Figures