1243
Structured Brain “Chronnectome” Reveals New Brain Dynamic Patterns for Early Detection of Alzheimer’s Disease1Department of Radiology and BRIC, University of North Carolina at Chapel Hill, Chapel Hill, NC, United States, 2Department of Brain and Cognitive Engineering, Korea University, Seoul, Korea, Republic of
Synopsis
To understand dynamics of human brain connectome, we introduce a novel method named “structured brain chronnectome (SBC)”, which measures spatiotemporal architecture of dynamic functional connectivities, a pivotal mechanism for human to adapt to the outside world. From dynamic view angle, with graph theoretic analysis and blind-source separation, we detect meaningful SBCs with typical and atypical configurations compared with traditional networks. They reflect high-order brain functional organization. By applying SBC to an Alzheimer’s disease progression data, we revealed pre-symptomatic brain high-level function alterations from early mild cognitive impairment subjects which are difficult to detect using traditional methods.
Introduction
Recently evidences have convergently indicated that our brain is not only a complex but also dynamic system. Brain functional connectivity (FC) dynamics has become to be a sensitive mean of imaging biomarker detection for brain diseases at the time point much earlier than traditional static metrics is able to detect. However, the emerging field is still in lack of effective methods for characterizing and quantifying such dynamic connectome due to the complexity caused by introducing a new temporal dimension into the already complicated brain spatiotemporal weaves. Previous methods, although successfully demonstrate the dynamic characteristic of our brain, are not quite suitable for clinical investigation, because they are either oversimplified by abstracting limited “states” from time-varying FC [1] or inevitably induce dimension disaster while calculating high-order FC [2]. A method characterizing voxel-wise spatiotemporal dynamics is highly needed for biomarker detection research.Methods
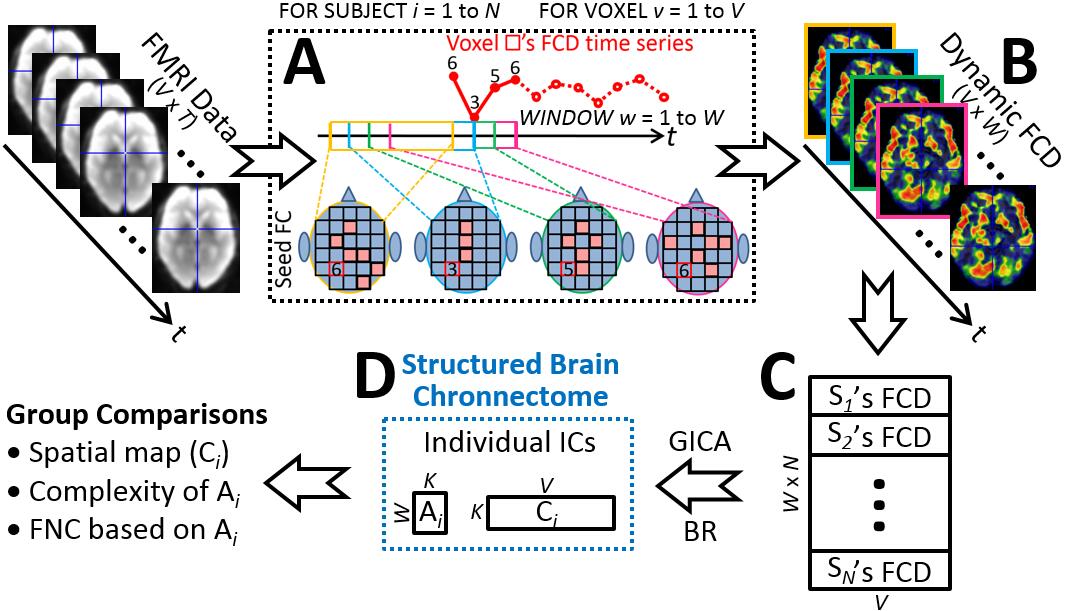
We propose a dedicated, data-driven, multivariate, voxel-wise method for exploring time-varying brain connectome that we called “chronnectome” after a previous leading study [3]. It will detect underlying spatiotemporal patterns from complex and time-evolving brain FC organization that thus gain its name “structured brain chronnectome (SBC)”. Our method consists of three major components (Fig. 1).
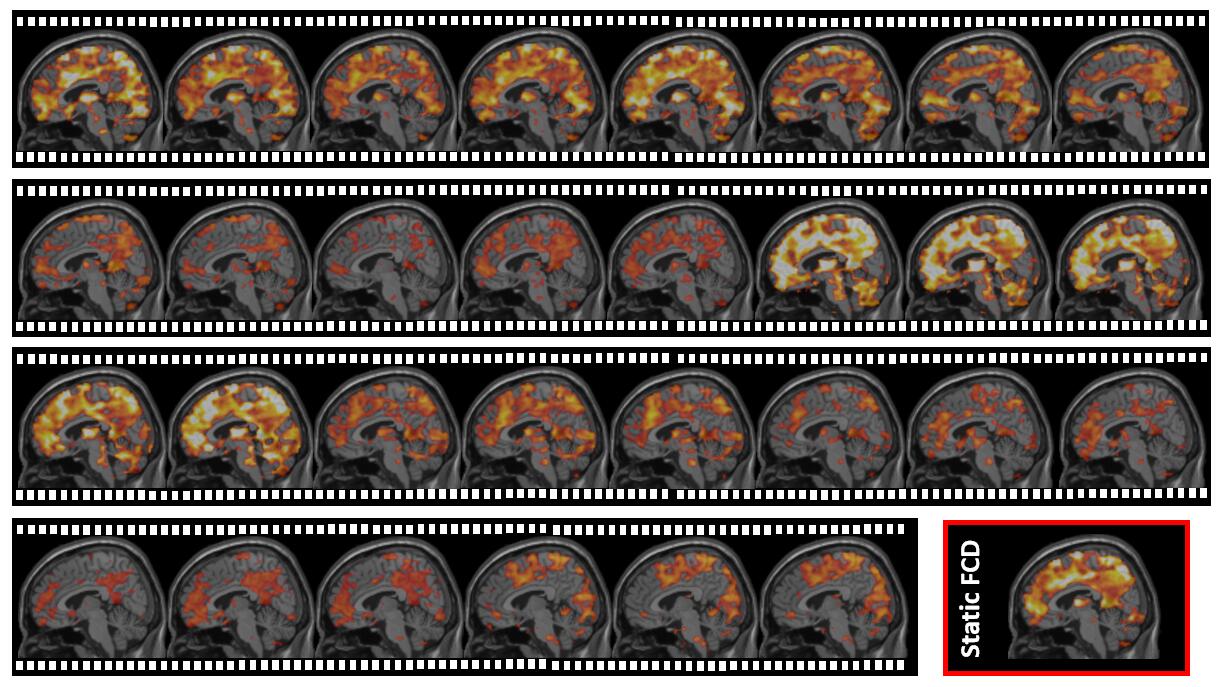
First, we divide resting-state functional MRI (rs-fMRI) data into multiple overlapping sub-series using sliding window. In each sub-series, we calculate FC density in each grey matter voxel by summarizing FC values between this voxel and other grey matter voxels. By these means, we can transform raw rs-fMRI signals into a new dataset with time-varying FC density maps, representing how this inter-connected biological system changes its interweaving pattern (Fig. 2).
Second, the dynamic FC density maps of all subjects are concatenated and fed into group independent component analysis (ICA) to decompose them according to their inherent structure into the SBCs of each subject. Each SBC contain a spatial map and an associated time course of it. The former represents how such a high-order FC spatially organized across different regions. The latter characterizes how this structured high-order FC evolve or fluctuate along time.
Third, group comparisons can be conducted to the spatial maps and time courses of the same SBC, to the interaction among different SBCs, and to many others via matured statistical methods.
Therefore, there is not going to be the comparison of the occurrence of a specific brain status, or that of a particular high-level hyper connectivity link with elusive meaning, as have done so in previous studies. The major difference between the SBC and traditional low-order FC network is that the input to ICA is time-varying FC density data rather than the original rs-fMRI. The resultant SBCs indicate a higher level of brain functional organization that can be quite different from its low-order counterpart. We then apply our method on the Alzheimer’s Disease Neuroimaging Initiative phase-2 (ADNI2) data [4] aiming to find out how AD imaging pathology evolves and where initial functional abnormalities take place in the early or prodromal stages.
Results
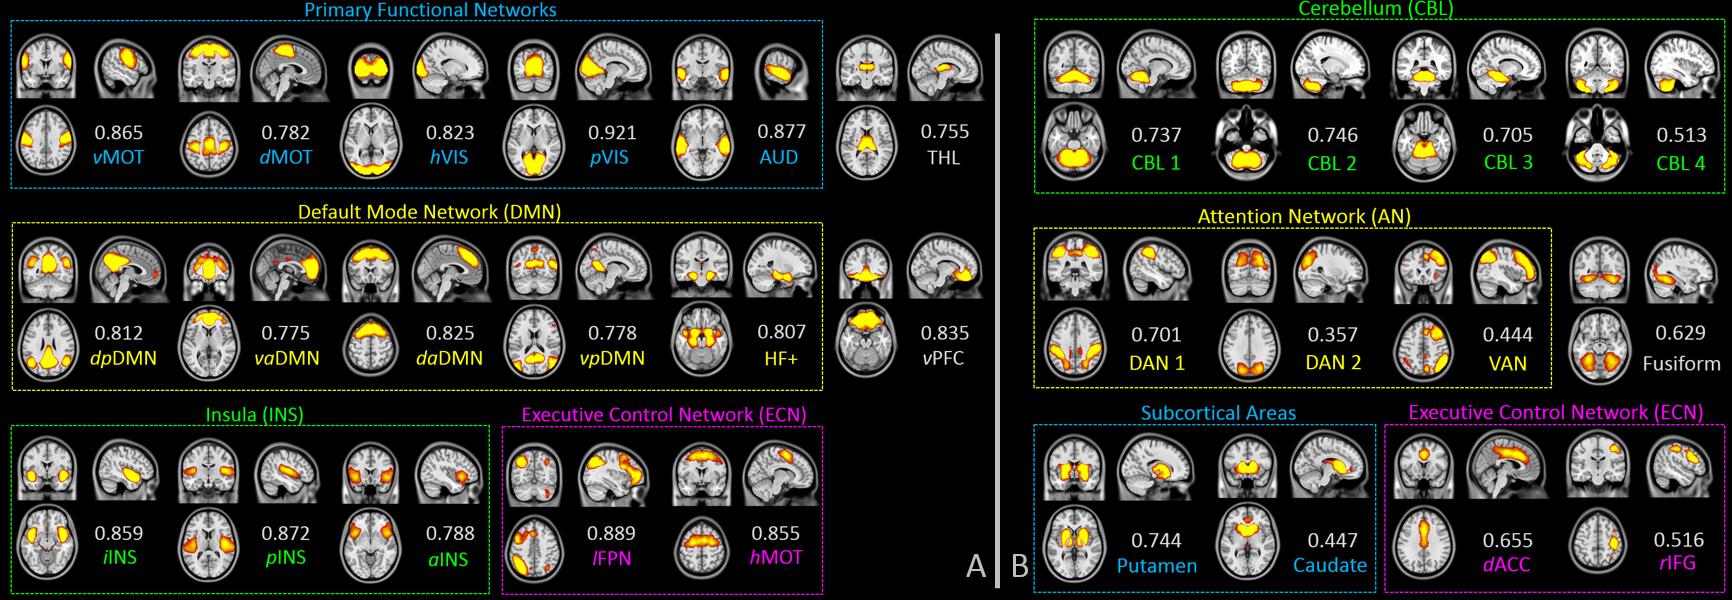
We include 7-min rs-fMRI data from each of the 67 cognitive normal (CN), 48 early mild cognitive impairment (EMCI), 45 late mild cognitive impairment (LMCI), and 33 Alzheimer’s disease (AD) subjects. We detected 29 SBCs with our method, among which 17 have matched patterns with traditional low-order brain FC networks (Fig. 3A) and 12 have interesting, novel patterns (Fig. 3B).
Besides AD progression characterized by using the spatial maps of four default mode network-related SBCs (not shown due to limited space), we found that a ventral attention function-related SBC’s temporal evolution complexity (characterized by sample entropy of their associated time series) could be served as early biomarker for AD detection (Fig. 4A, C). This is a novel pattern found to be responsible for pathology-related functional disorder, suggesting high-order FC in attention system be out of function at very early stage of AD. From the SBCs with similar patterns to the traditional brain networks, we found executive control function-related SBC also have abnormally decreased temporal complexity in early stages (Fig. 4B, D) which was often reported in only AD group [5].
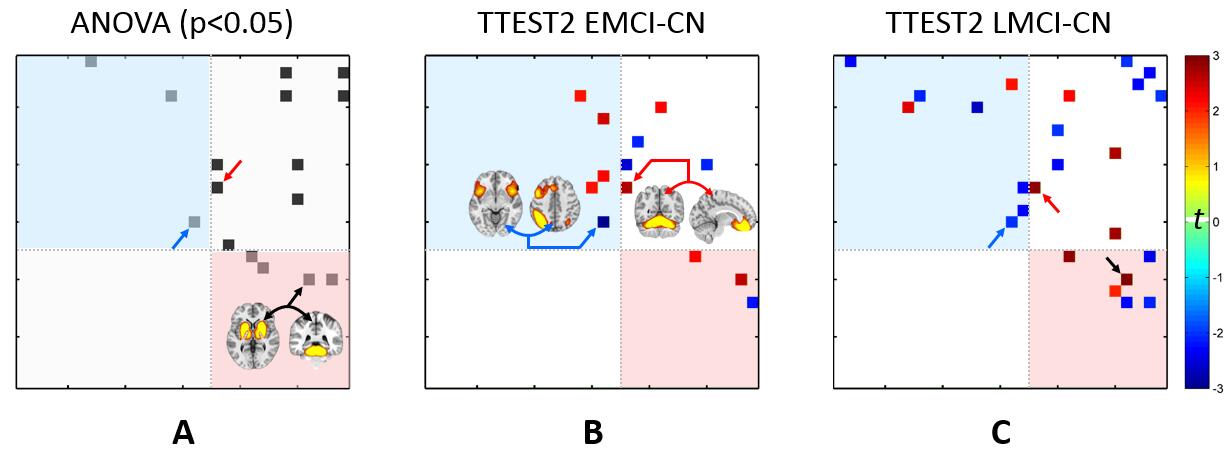
Not only within-SBC changes, we also found early abnormalities in inter-SBC connectivity in EMCI and LMCI groups, most of which can only be detected by using the novel-patterned SBCs (Fig. 5). This, for the first time, reveals that the system-level interactions among brain high-order networks could be broken-down in early stages of AD.
Conclusions
We introduce a highly applicable dynamic brain connectome characterization method named “structured brain chronnectome”, and demonstrate its promising value in future clinical research.Acknowledgements
No acknowledgement found.References
[1] Allen EA, Damaraju E, Plis SM, et al. Tracking Whole-Brain Connectivity Dynamics in the Resting State. Cereb. Cortex. 2014; 24: 663–676.
[2] Chen X, Zhang H, Gao Y, et al. High-order resting-state functional connectivity network for MCI classification. Hum. Brain Mapp. In press; doi:10.1002/hbm.23240.
[3] Calhoun VD, Miller R, Pearlson G, et al. The Chronnectome: Time-Varying Connectivity Networks as the Next Frontier in fMRI Data Discovery. Neuron; 2014; 84: 262–274.
[4] www.loni.ucla.edu/ADNI.
[5] Menon V. Large-scale brain networks and psychopathology: a unifying triple network model. Trends Cogn. Sci. 2011; 15: 483–506.
Figures