1242
Olfactory suggestion capacity of colors: a functional MRI study1IADI, INSERM U947, Université de Lorraine, CHRU Nancy, Nancy, France, 2Myrissi, Nancy, France, 3InnoCIM, ENSAIA, Université de Lorraine, Nancy, France, 4Department of Diagnostic and Interventional Neuroradiology, CHRU Nancy, Nancy, France, 5CIC 1433 Innovation Technologique, INSERM, Université de Lorraine, CHRU Nancy, Nancy, France
Synopsis
We know that colors modify odor’s perception. It demonstrates that colors arrangement (chromatic cards) could evoke the appropriate odor, but we have not neural evidence of these chromatic cards olfactory suggestion capacity. Our goal is to compare the olfactory suggestion capacity of picture with that of chromatic arrangements using functional MRI paradigm. We show that chromatic card visualization could suggest an odor more efficiently than picture visualization. Our results support the involvement of multiple cognitive processes (olfactory, emotional, visuospatial, language, memory, taste) which interact to produce olfactory suggestion from colors visualization. Therefore, chromatic card application could be varied (health, marketing…).
Purpose
It
is known that colors modify odors perception. However, the mechanisms that
underpin human olfactory processing are not well understood1–3. A previous study has demonstrated that color
arrangements, also called chromatic cards, could evoke some simple odors such
as mint or lavender4. The present study has examined, for the first
time by fMRI analysis, the olfactory suggestion capacity of colors arrangement.
To that extent, we have compared if colors activates brain regions responsible
for the olfaction system more or less than a figurative representation of an
odorous source.Methods
Thirty healthy women volunteers participated in this study approved by our institutional review board. There were instructed to focus on the odor suggested by visual stimuli. Two fMRI paradigms consist of 7 cycles of one rest period (25s) followed by a visual stimuli period (35s) which were composed of (i) 7 chromatic cards –1st session– and (ii) 7 pictures –2nd session. The order of each presentation (cucumber, orange blossom, cut grass, lavender, peppermint, rose and violet) was randomized. These were illustrated in figure 1.
MRI images
were acquired on a 3T scanner (Signa HDxt, GE) with an 8-channel head coil and
were analyzed using SPM8 software. Whole-brain analyses were evaluated using
one and paired t-tests. Orbitofrontal
cortex mask were generated from the “neuromorphometrics” template to estimate
beta values in each mask from one-t-tests for each session.
Results
During chromatic card presentations, regions were activated bilaterally in the cerebellum, inferior occipital gyrus, fusiform gyrus, inferior parietal gyrus, superior and middle frontal gyrus, hippocampus, anterior insula cortex, precentral gyrus and in the right middle occipital gyrus, left superior parietal gyrus, left medial frontal gyrus, left orbitofrontal gyrus and left cingulate gyrus (fig.2a). During picture presentations, activations involved bilateral regions in the cerebellum, inferior occipital gyrus, fusiform gyrus, medial frontal gyrus and in left lingual gyrus, left middle and inferior frontal gyrus and left anterior cingulate gyrus. During chromatic card vs picture presentations (fig.2b), a stronger activation was mainly observed in the bilateral superior parietal lobule, bilateral medial and inferior frontal gyrus, right precentral gyrus, right inferior temporal gyrus and right lingual gyrus. Compared to chromatic card presentations, picture presentations brought into play a greater activation in the bilateral lingual gyrus.
Analyses within the orbitofrontal cortices confirmed and extended findings described previously (fig.3). During chromatic card presentations compared to picture presentations, mean beta values were significantly higher in the left lateral, left posterior and bilateral part of inferior frontal gyrus. Furthermore, mean beta values were significantly higher in the left-brain side compared to right-brain side in all regions except for the anterior orbitofrontal cortex during chromatic card presentations.
Discussion
Findings
reveal the involvement of anterior insula, hippocampus, anterior cingulate
gyrus and orbitofrontal cortex during chromatic card presentations. These
regions, especially the orbitofrontal cortex, are known to be involved in
olfactory processes2,3. Thus, our results are consistent with the
hypothesis that the visualization of chromatic card could suggest efficiently
an odor. In addition, a significant stronger activation has been observed in
different part of orbitofrontal cortex during chromatic card presentations
compared to picture presentations assuming that chromatic card visualization
would generate more odor suggestion than picture presentation. The left-brain
side lateralization found is in agreement with previous studies which stipulate
that emotional response to odors was located in the left hemisphere2. Moreover, the multimodal processes influencing
an odor perception reported in literature5,6 is also observed in our study by showing that
chromatic card visualization leads to complex interactions of olfactory,
emotional, visuospatial, language, memory and taste processes in order to
produce an odor suggestion. Therefore, this is the first fMRI study which
demonstrates an olfactory suggestion capacity without sending odor, but only
using the colors visualization.Conclusion
The
current study has succeeded, for the first time, to establish the olfactory
suggestion capacity of colors arrangement by showing that chromatic card
visualization could generate more odor suggestion than picture presentation.
Relevant brain regions have been identified during chromatic card presentations
especially in the orbitofrontal cortex, anterior cingulate cortex, dorsolateral
prefrontal cortex, parietal lobule hippocampus and anterior insula which are
related to olfactory, emotional, visuospatial, language, memory and taste
processes respectively. These results support the involvement of multiple and
complex cognitive processes which interact to produce efficiently olfactory
suggestion from colors arrangement visualization. Regarding these findings, chromatic card could
be used in various fields, such as healthcare by improving the knowledge of the
brain organization of human olfaction, or marketing by contributing to the
consumer product satisfaction.Acknowledgements
The authors acknowledge the financial help of the FEDER program and the “Région Lorraine”.References
1Gottfried, J. A. & Dolan, R. J. The nose smells what the eye sees: crossmodal visual facilitation of human olfactory perception. Neuron 39, 375–386 (2003).
2Royet, J.-P. & Plailly, J. Lateralization of olfactory processes. Chem. Senses 29, 731–745 (2004).
3Vedaei, F. et al. Methodological considerations in conducting an olfactory fMRI study. Behav. Neurol. 27, 267–276 (2013).
4Jacquot, M., Noel, F., Velasco, C. & Spence, C. On the Colours of Odours. Chemosens. Percept. 9, 79–93 (2016).
5Osterbauer, R. A. et al. Color of scents: chromatic stimuli modulate odor responses in the human brain. J. Neurophysiol. 93, 3434–3441 (2005).
6Karunanayaka, P. R. et al. Rapidly acquired multisensory association in the olfactory cortex. Brain Behav. 5, (2015).
Figures
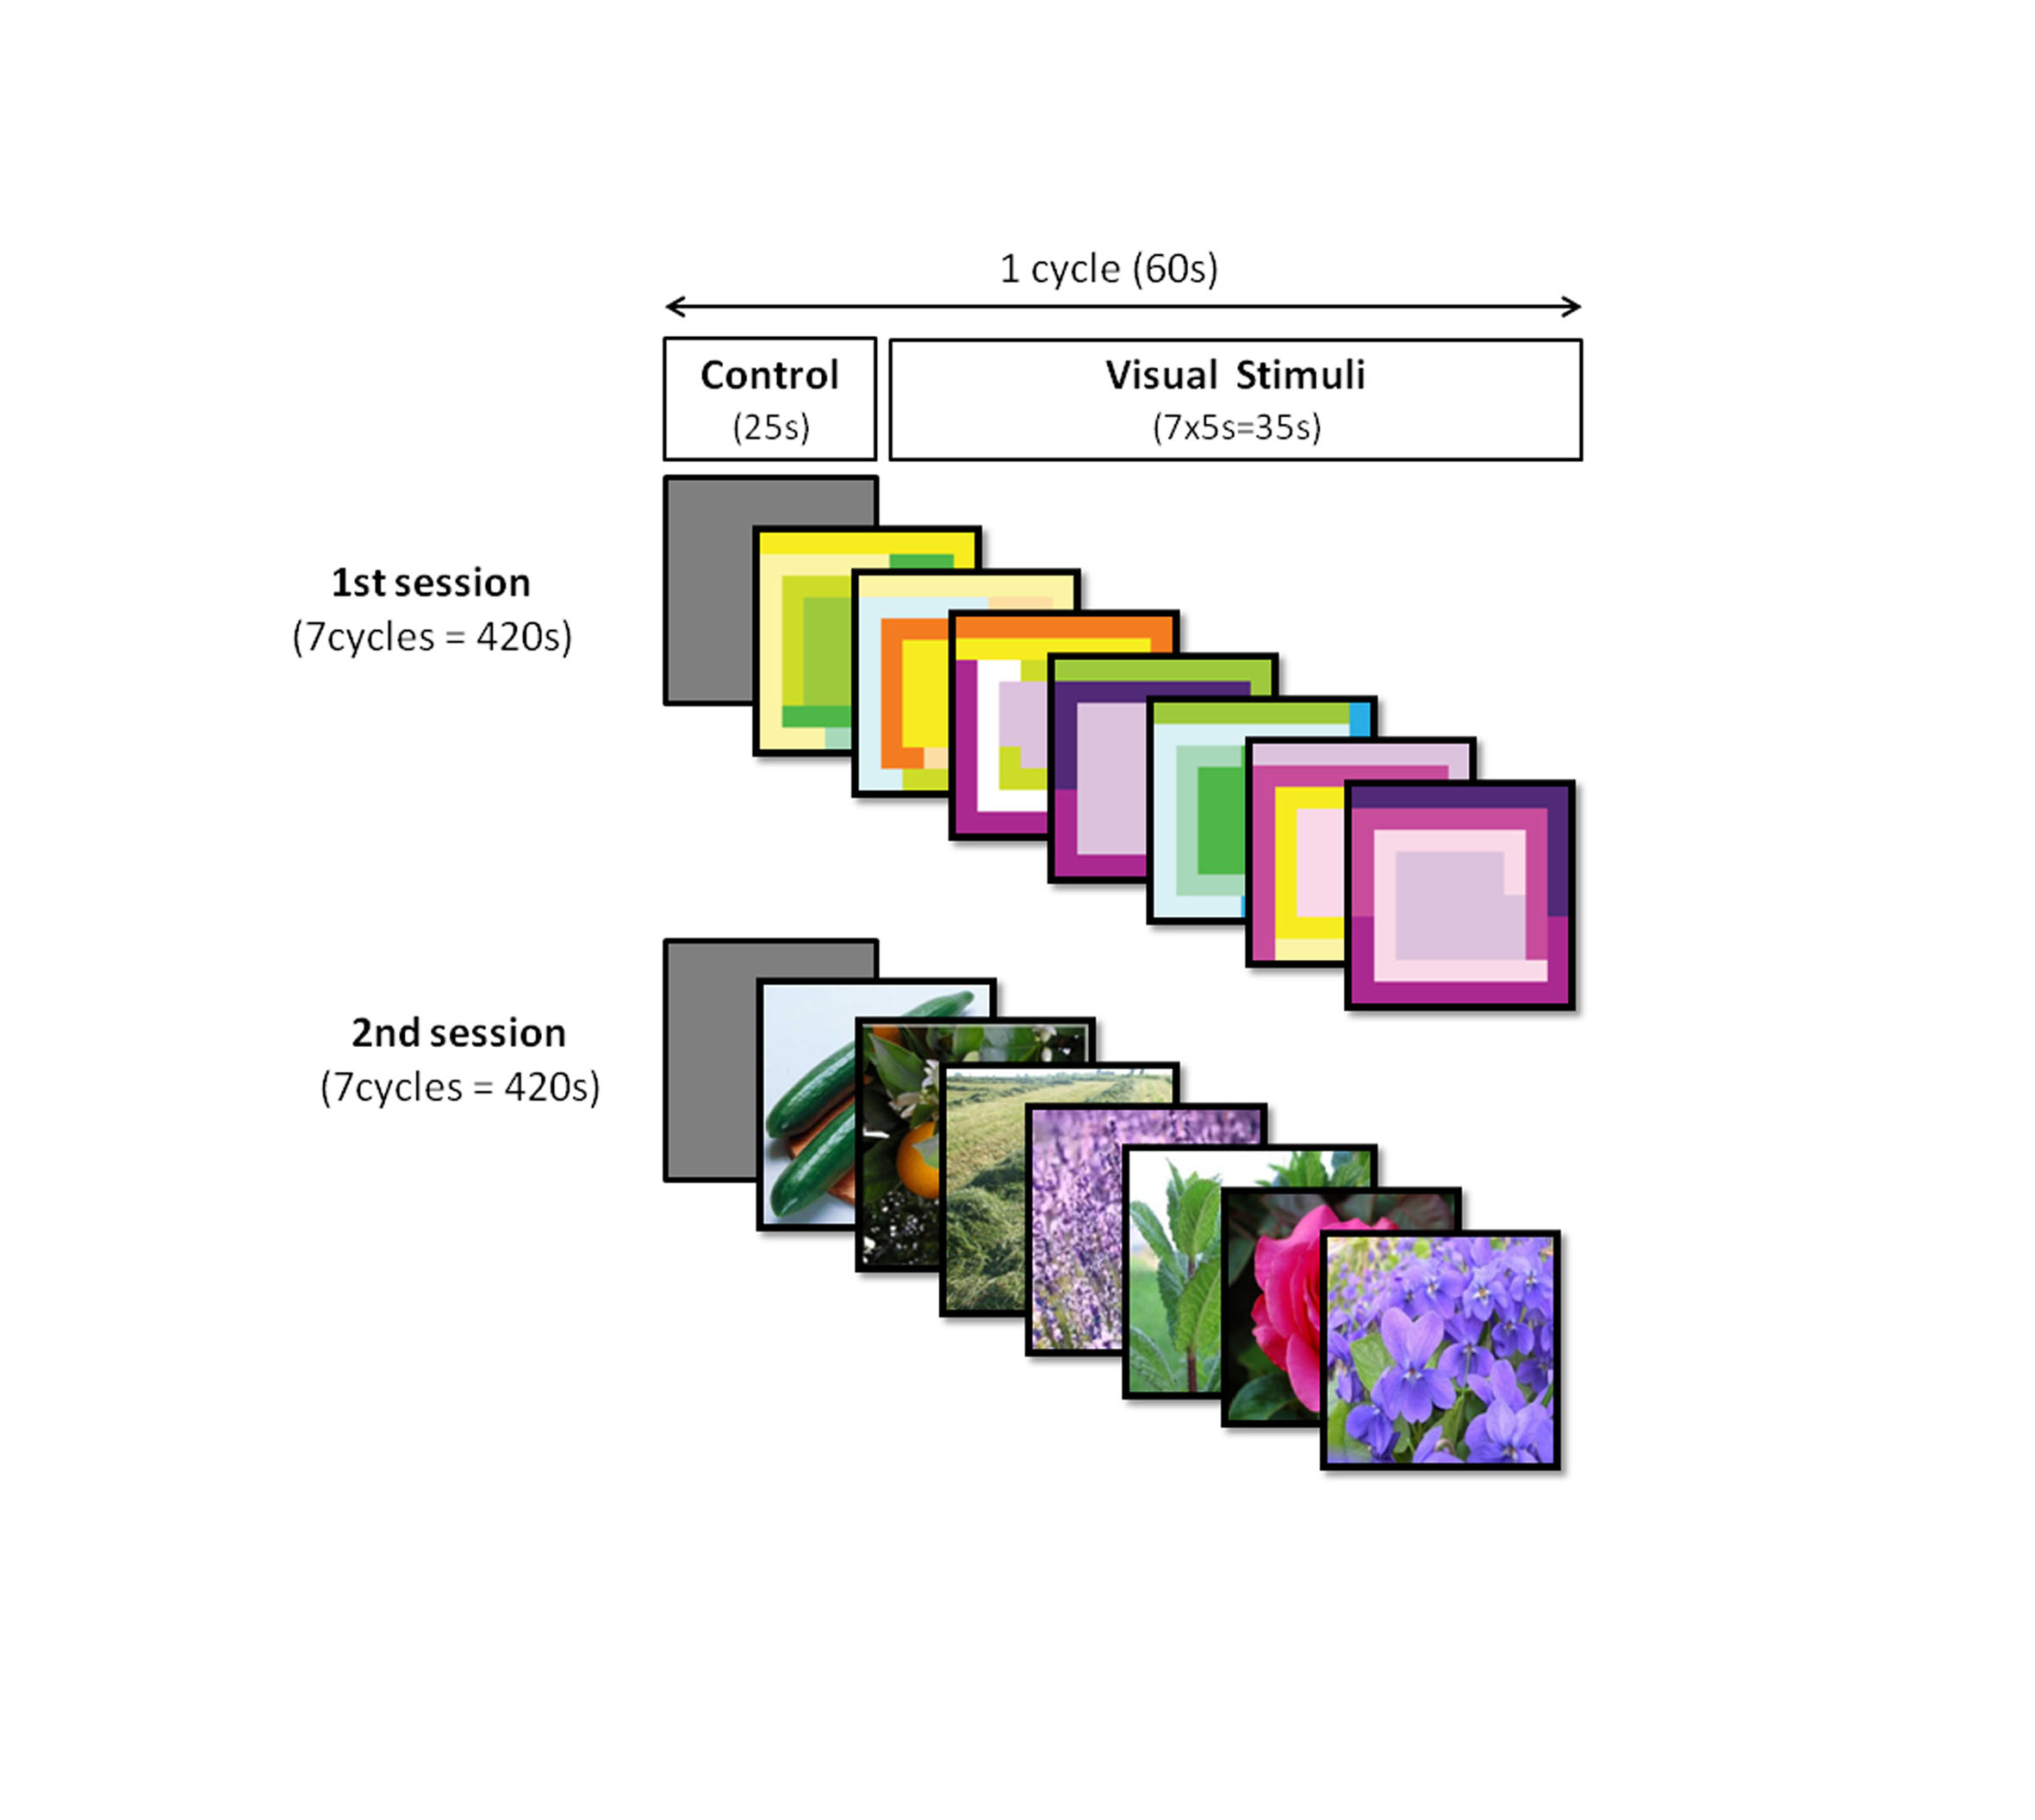
Figure 1: Schematic description of passive olfactory fMRI paradigm.
Passive olfactory fMRI paradigm was divided in two sessions comprising seven cycles of 60 seconds. Each cycle consisted of a control period (25 seconds) followed by a visual stimuli period (35 seconds). In the first session, a visual stimulus was composed of a randomized successive presentation of seven chromatic cards which represent cucumber, orange blossom, cut grass, lavender, peppermint, rose and violet. In the second session, seven pictures suggestive of these same odors were presented.
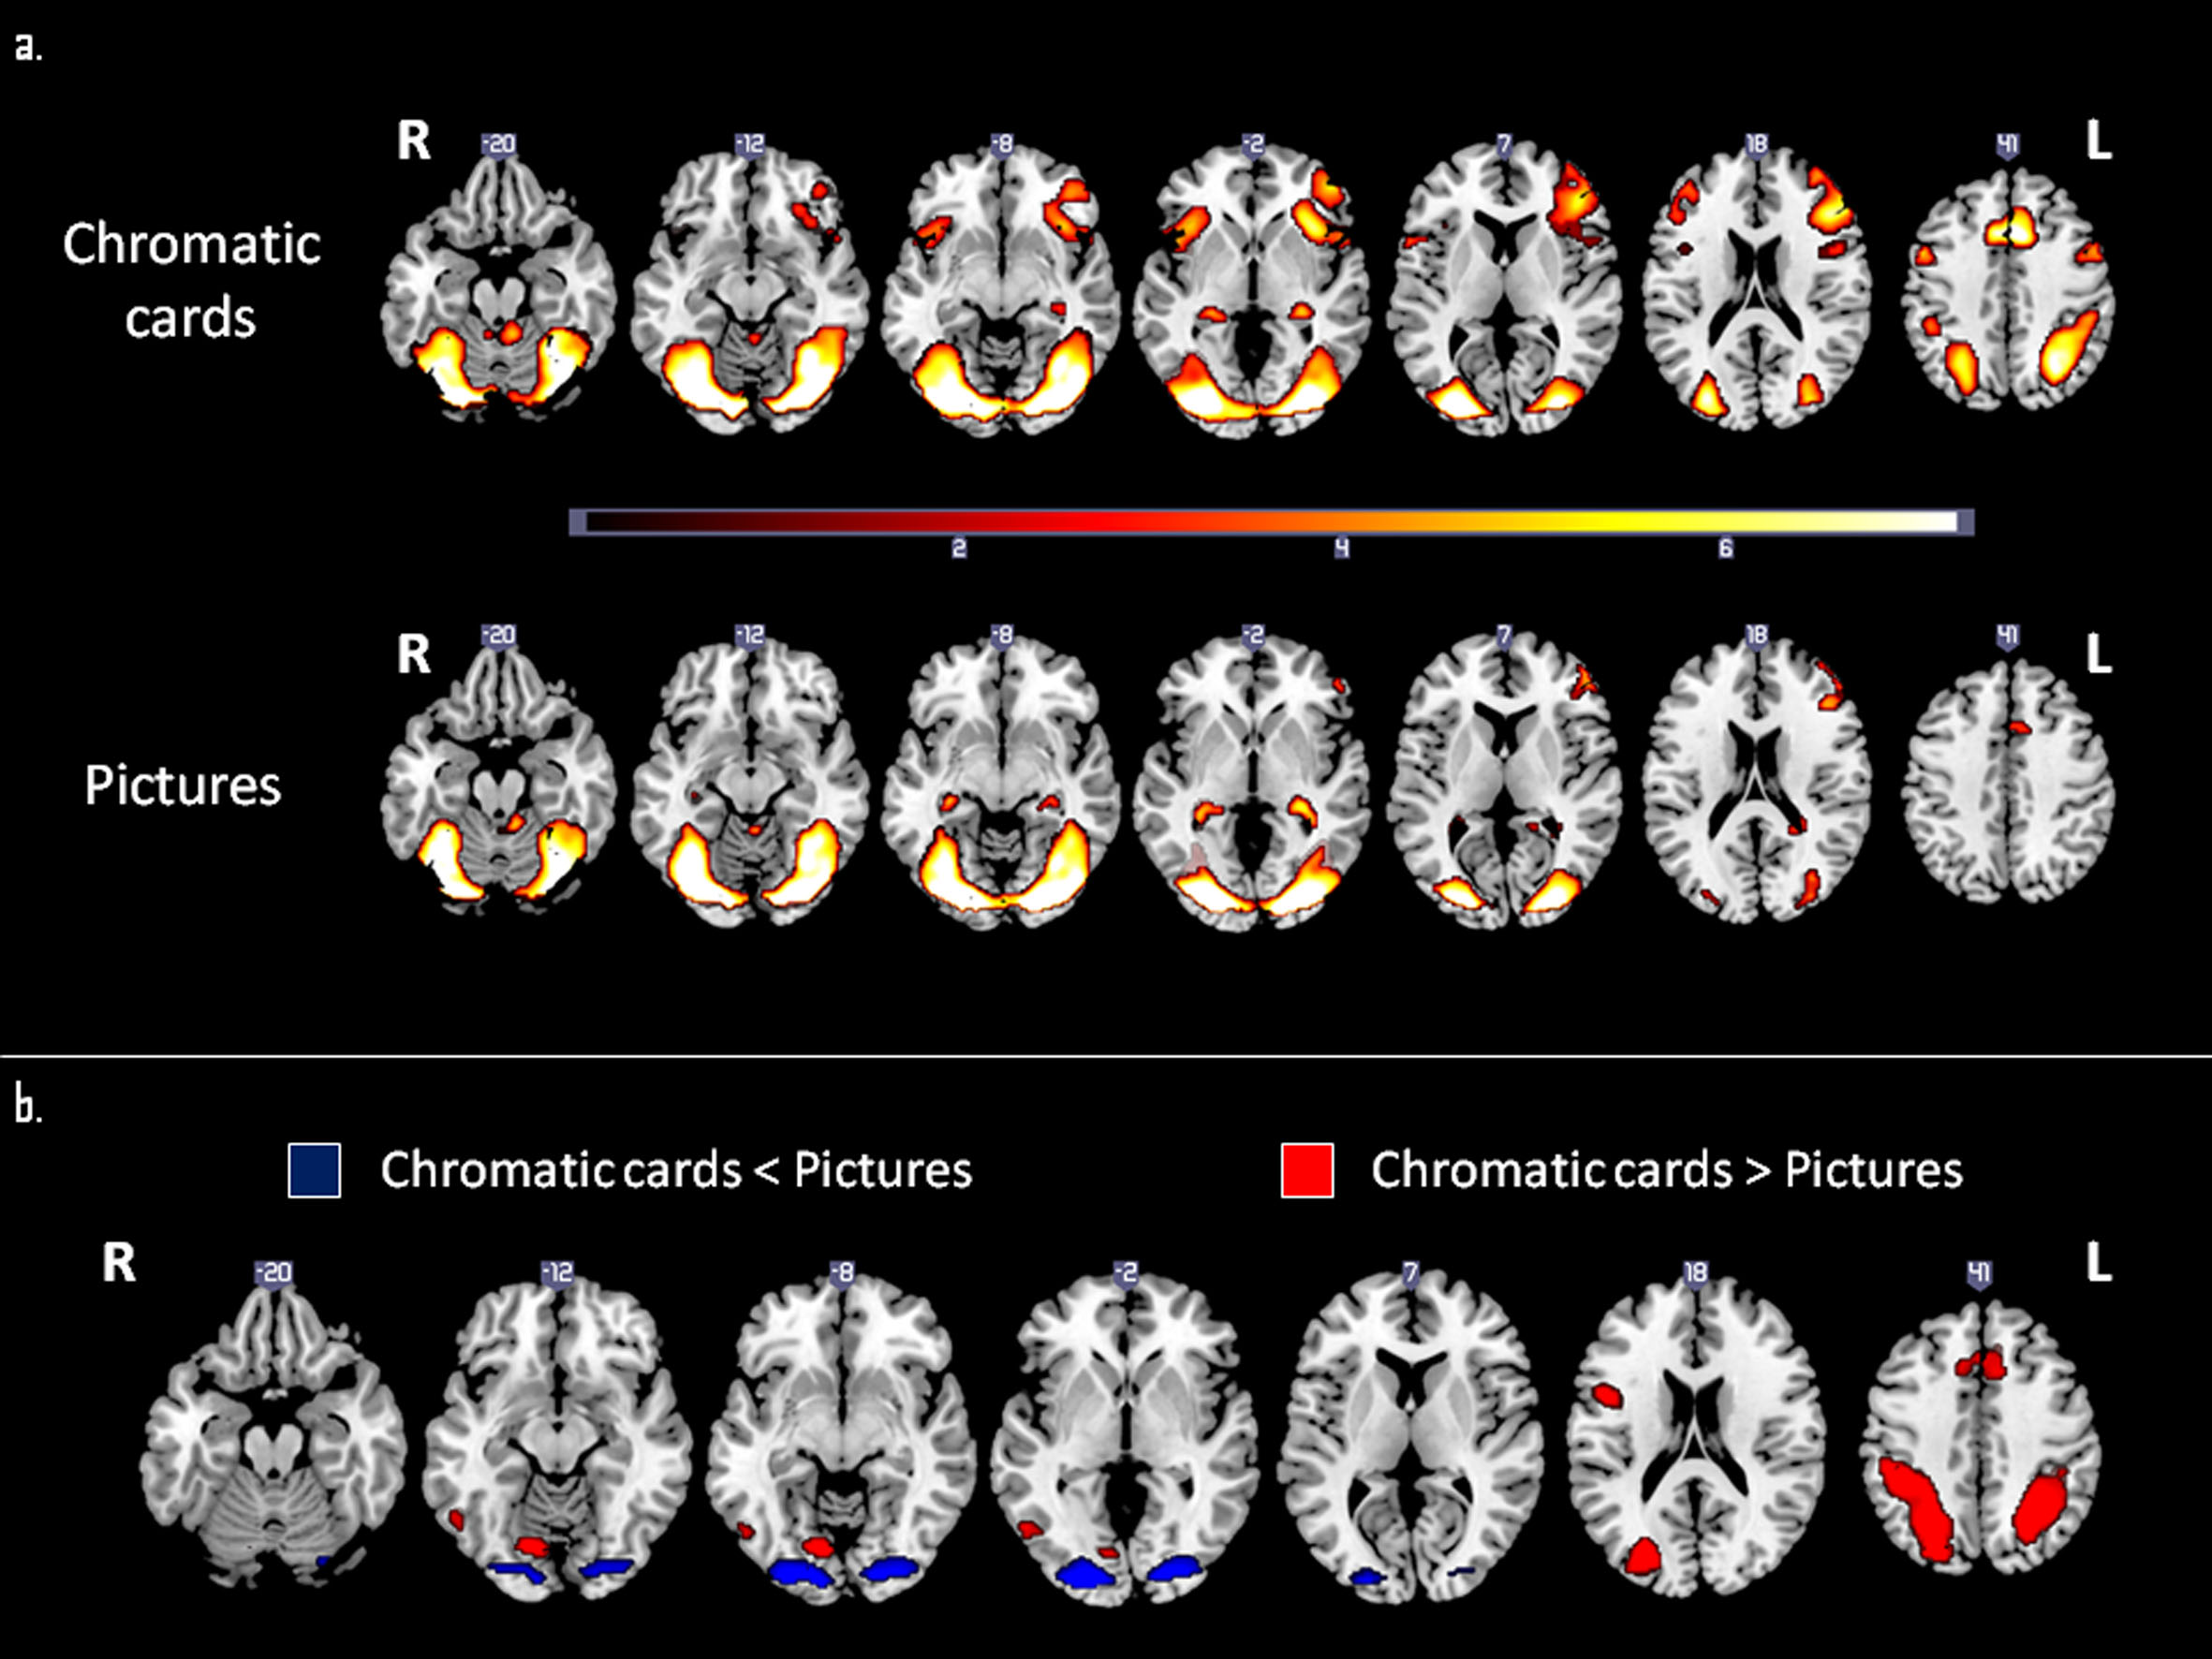
Figure 2: Brain areas activated by chromatic card or picture presentation.
Regions have been displayed on transverse slice (MNI space ch256 template, MRIcroGL software) for (a) chromatic card and picture presentation and (b) differences between chromatic card and pictures presentation. Statistical threshold was used for a p-value p<0.001 and a minimum cluster size of 50 voxels, uncorrected. Color bar indicates the T score of activation.
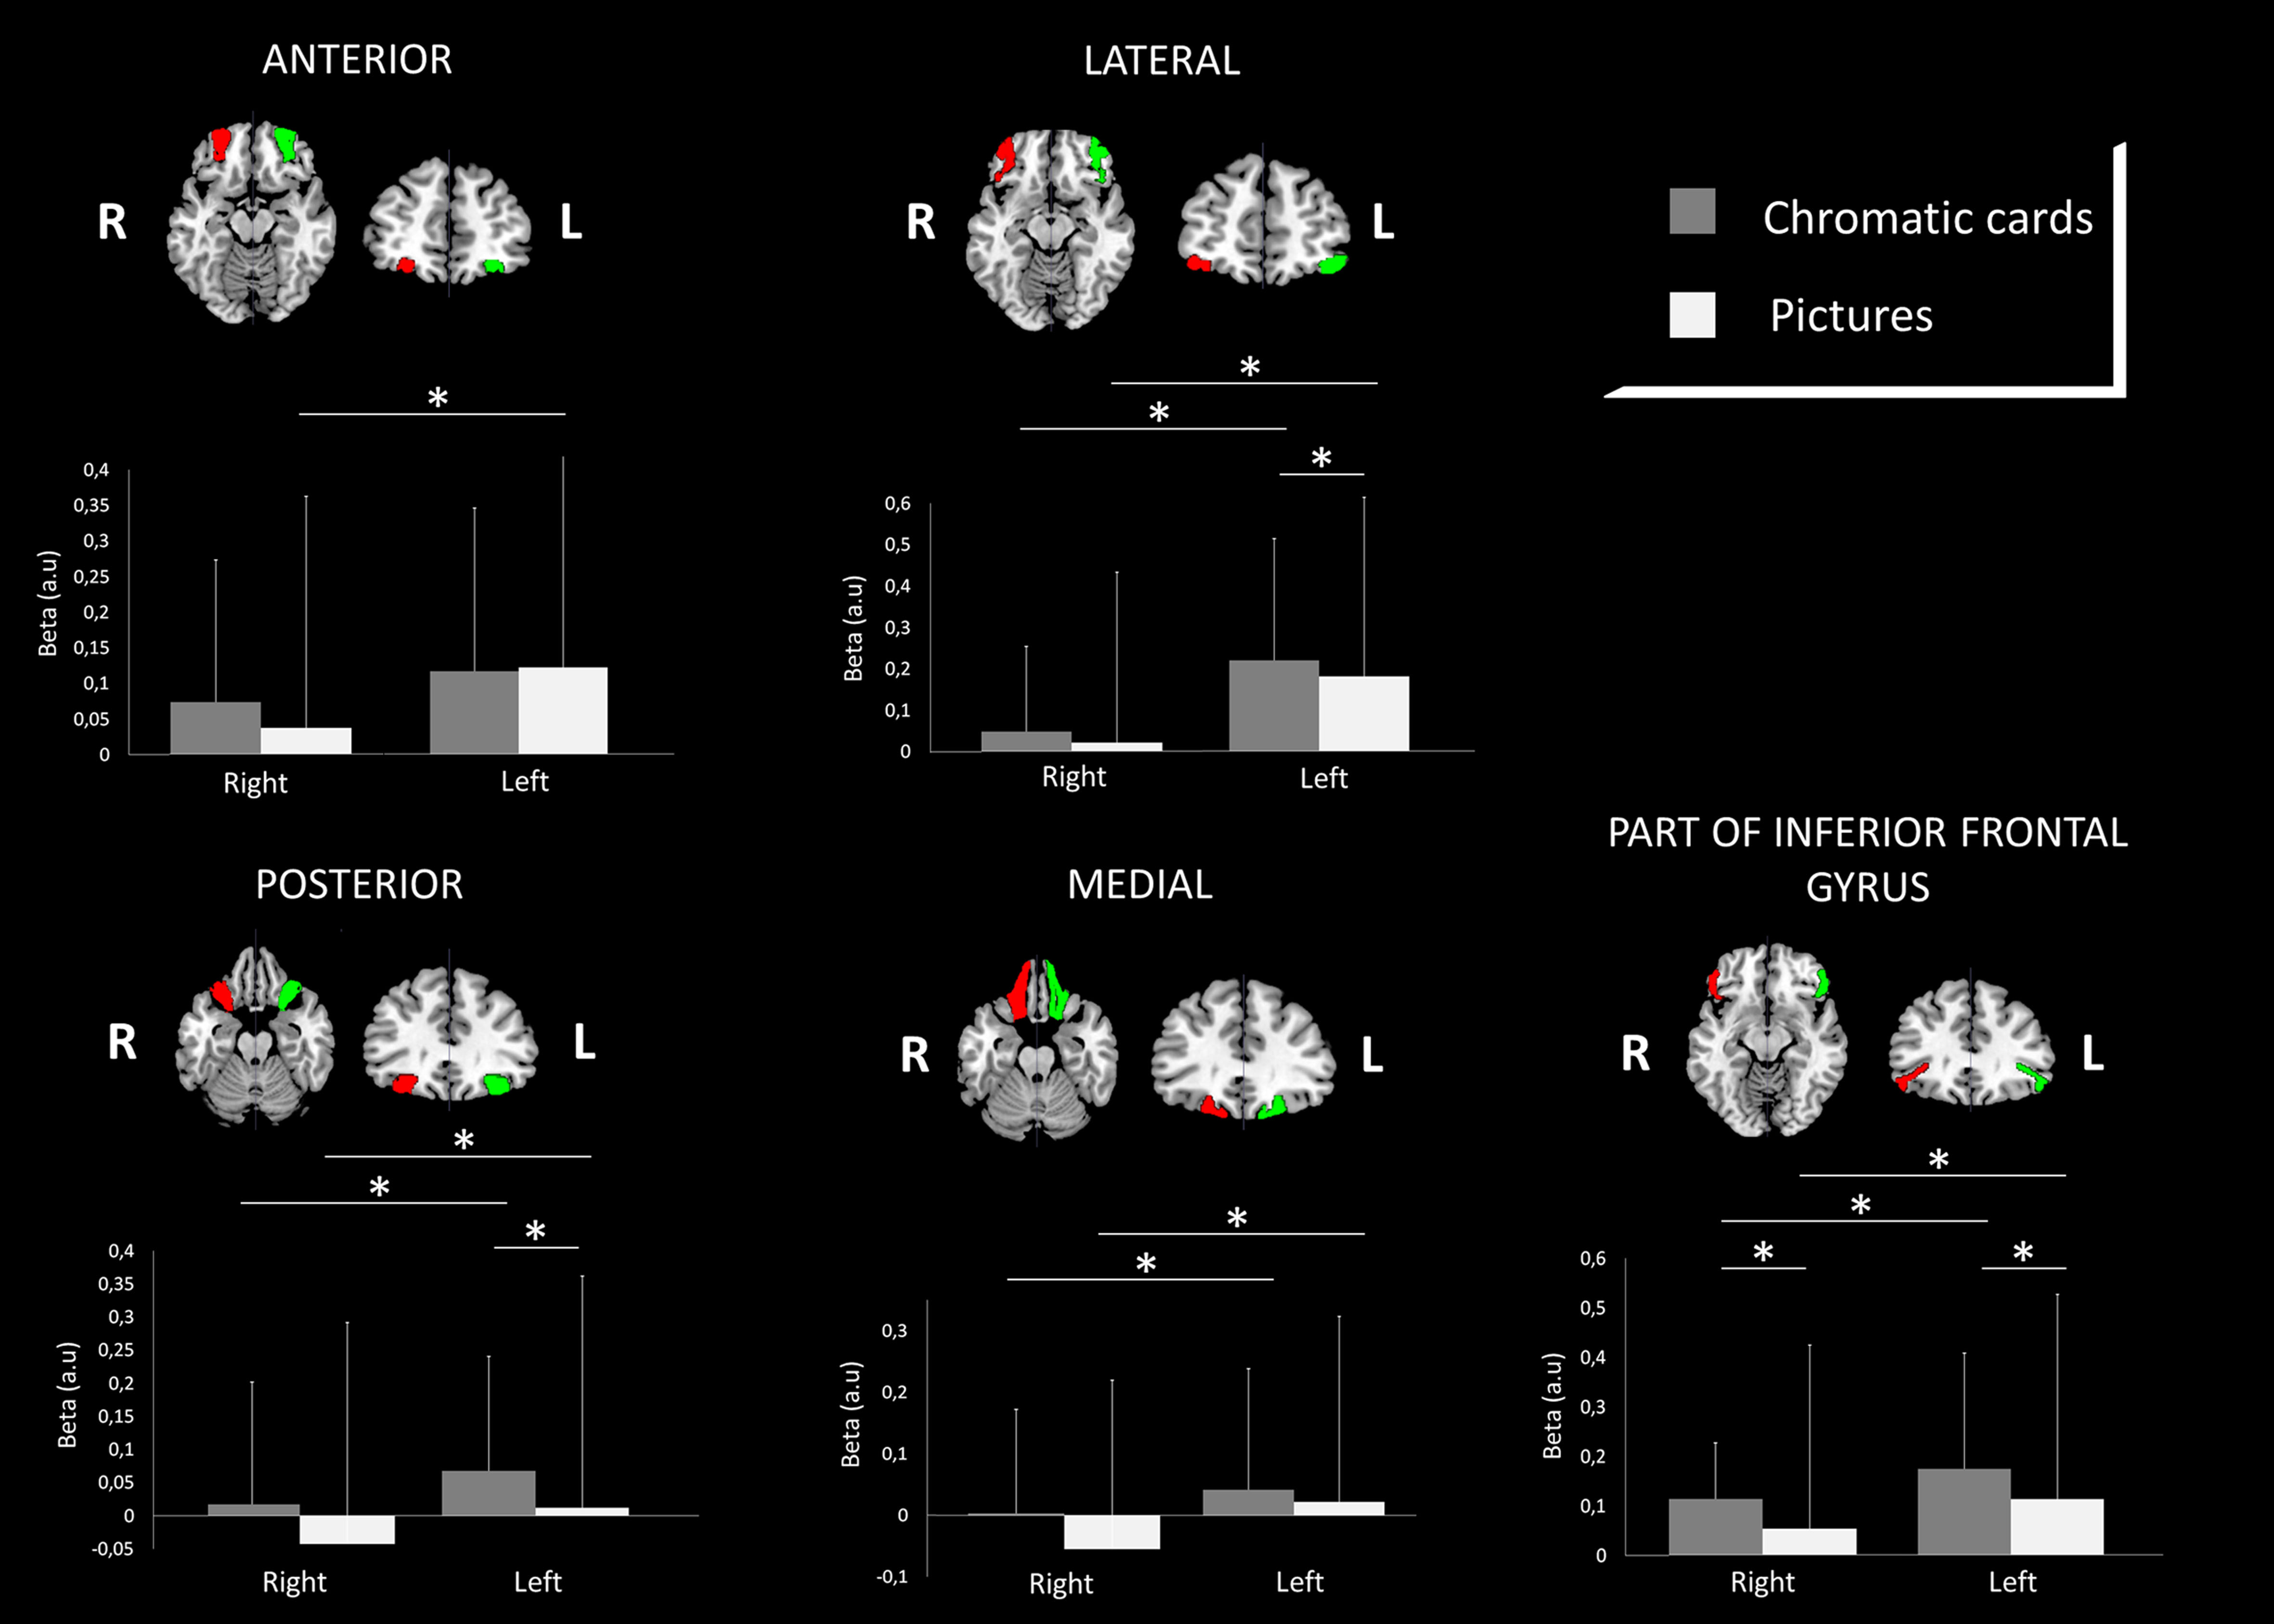
Figure 3: Mean activation within the five regions of orbitofrontal cortex.
Figure depicts mean activation (beta value, arbitrary unity – a.u.) and standard errors for five regions of orbitofrontal cortex which were created from the “neuromorphometrics” template (MNI space). All these regions are displayed on transverse slice (MNI space ch256 template, MRIcroGL software) for the left-brain side (green) and the right-brain side (red). Comparisons are analyzed with pairwise Wilcoxon’s test. Significance levels are marked with an asterisk (p<0.05).