1237
Time delay processing of BOLD cerebrovascular reactivity data in patients with moyamoya pre- and post-surgical revascularization reveals a potential new indicator of vascular compliance1Radiology & Radiological Sciences, Vanderbilt University, Nashville, TN, United States, 2Mclean Hospital, Brain Imaging Center, Belmont, MA, United States, 3Department of Psychiatry, Harvard Medical School, Boston, MA, United States, 4Department of Neurosurgery, Vanderbilt University Medical Center, Nashville, TN, United States, 5Department of Psychiatry, Vanderbilt University Medical Center, Nashville, TN, United States, 6Department of Neurology, Vanderbilt University Medical Center, Nashville, TN, United States
Synopsis
Structural and BOLD-weighted hemodynamic imaging was performed in patients with intracranial steno-occlusion due to moyamoya disease before and after surgical revascularization. A novel data-driven time-delay analysis was performed using cross-correlation of functional imaging data to find the time at which maximum correlation occurs between the BOLD signal from each voxel and a reference regressor. This provides a novel metric of hemodynamic impairment (lagtime) that may be indicative of vascular smooth muscle dysfunction and therefore delayed reactivity. We found that in patients with successful revascularization on angiography, lagtimes decreased, and in patients with unsuccessful revascularization and progressive disease, lagtimes increased.
Purpose
The overall goal of this work is to implement novel analysis tools to separately quantify cerebrovascular reactivity (CVR) magnitude and CVR response time and to use this information to evaluate functional differences in collateral vessels before and after surgical revascularization. More specifically, recent elegant optical imaging work in anesthetized rats has revealed that endothelial disruption significantly attenuates the functional hyperemia response1, and more recently it has been shown that neo-angiogenic collateral vessels in patients with cerebrovascular disease may have distinct vasoactive properties relative to healthy vessels2. These findings suggest that not only the magnitude of the change in blood volume and flow of parenchyma, commonly referred to as CVR, but also the time for parenchymal vessels to respond maximally to vasoactive stimuli or progressive reductions in cerebral perfusion pressure, may represent distinct features of parenchymal health. To investigate this possibility, we implemented a novel, data-driven time regression analysis of CVR data in patients with non-atherosclerotic intracranial stenosis (i.e., moyamoya disease) before and after surgical revascularization in sequence with catheter angiography. The goal was to understand the relationship between the structure of collateral vessel formation from angiography and the function of these collateral vessels from hemodynamic MRI.Methods
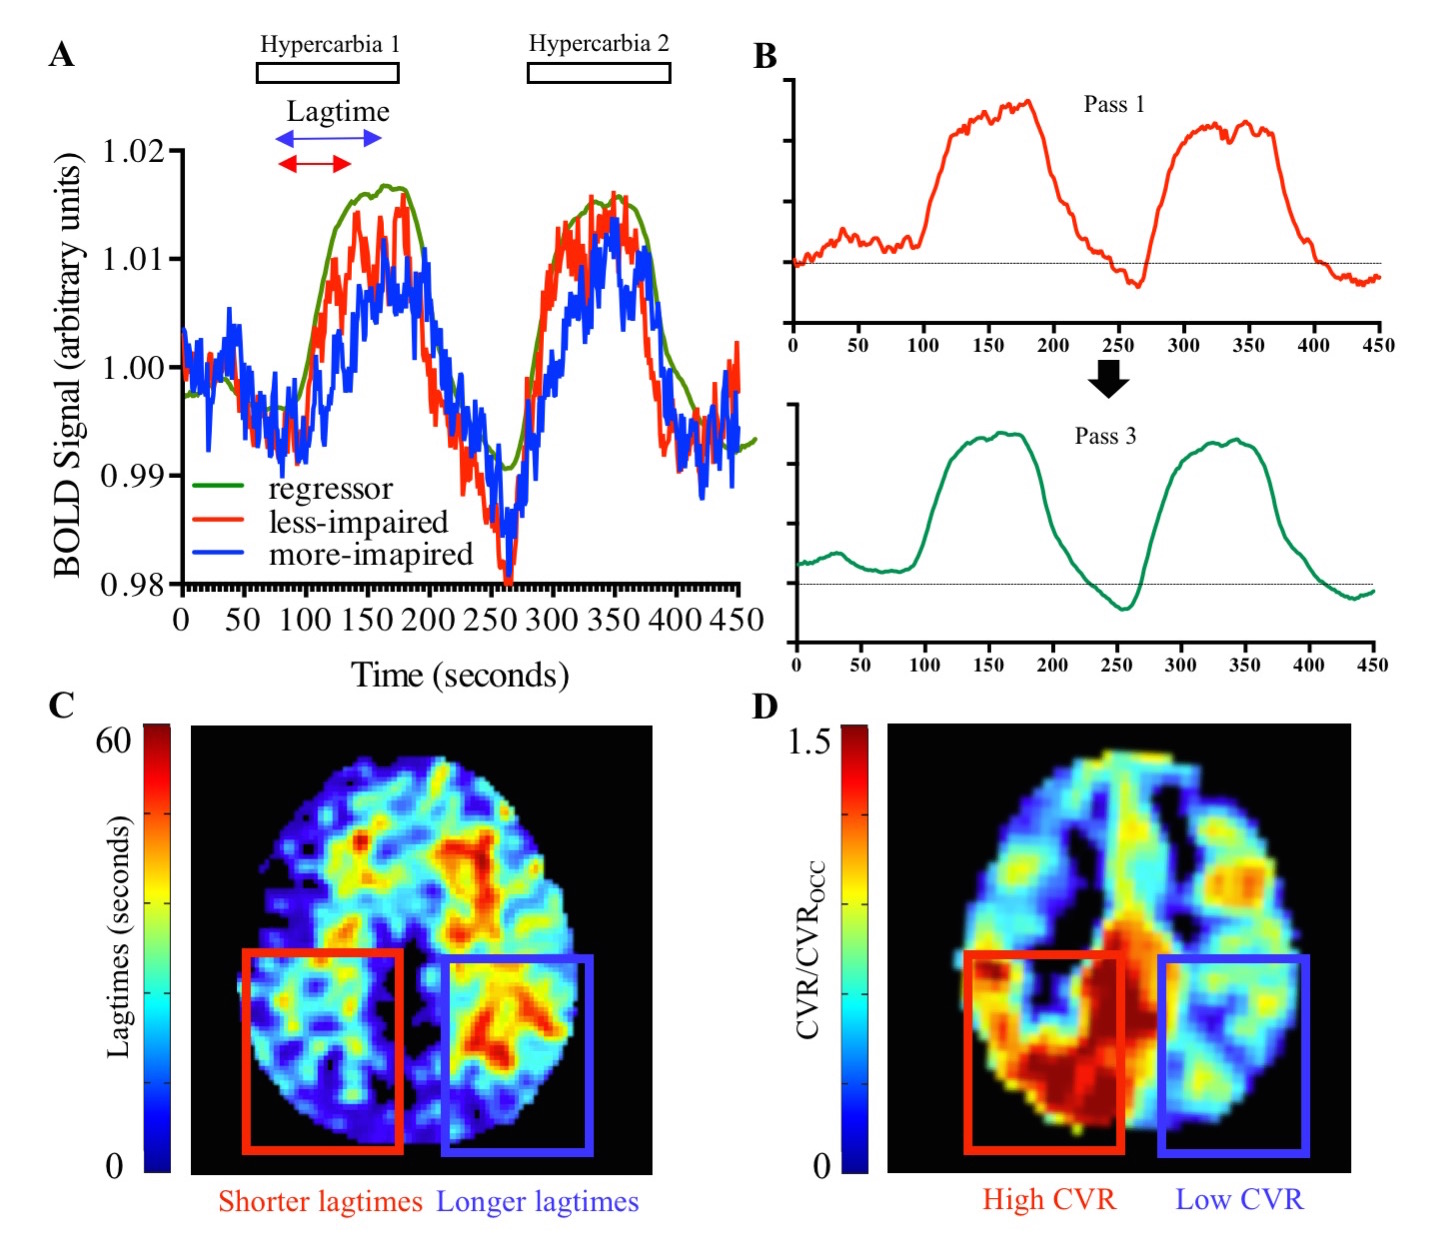
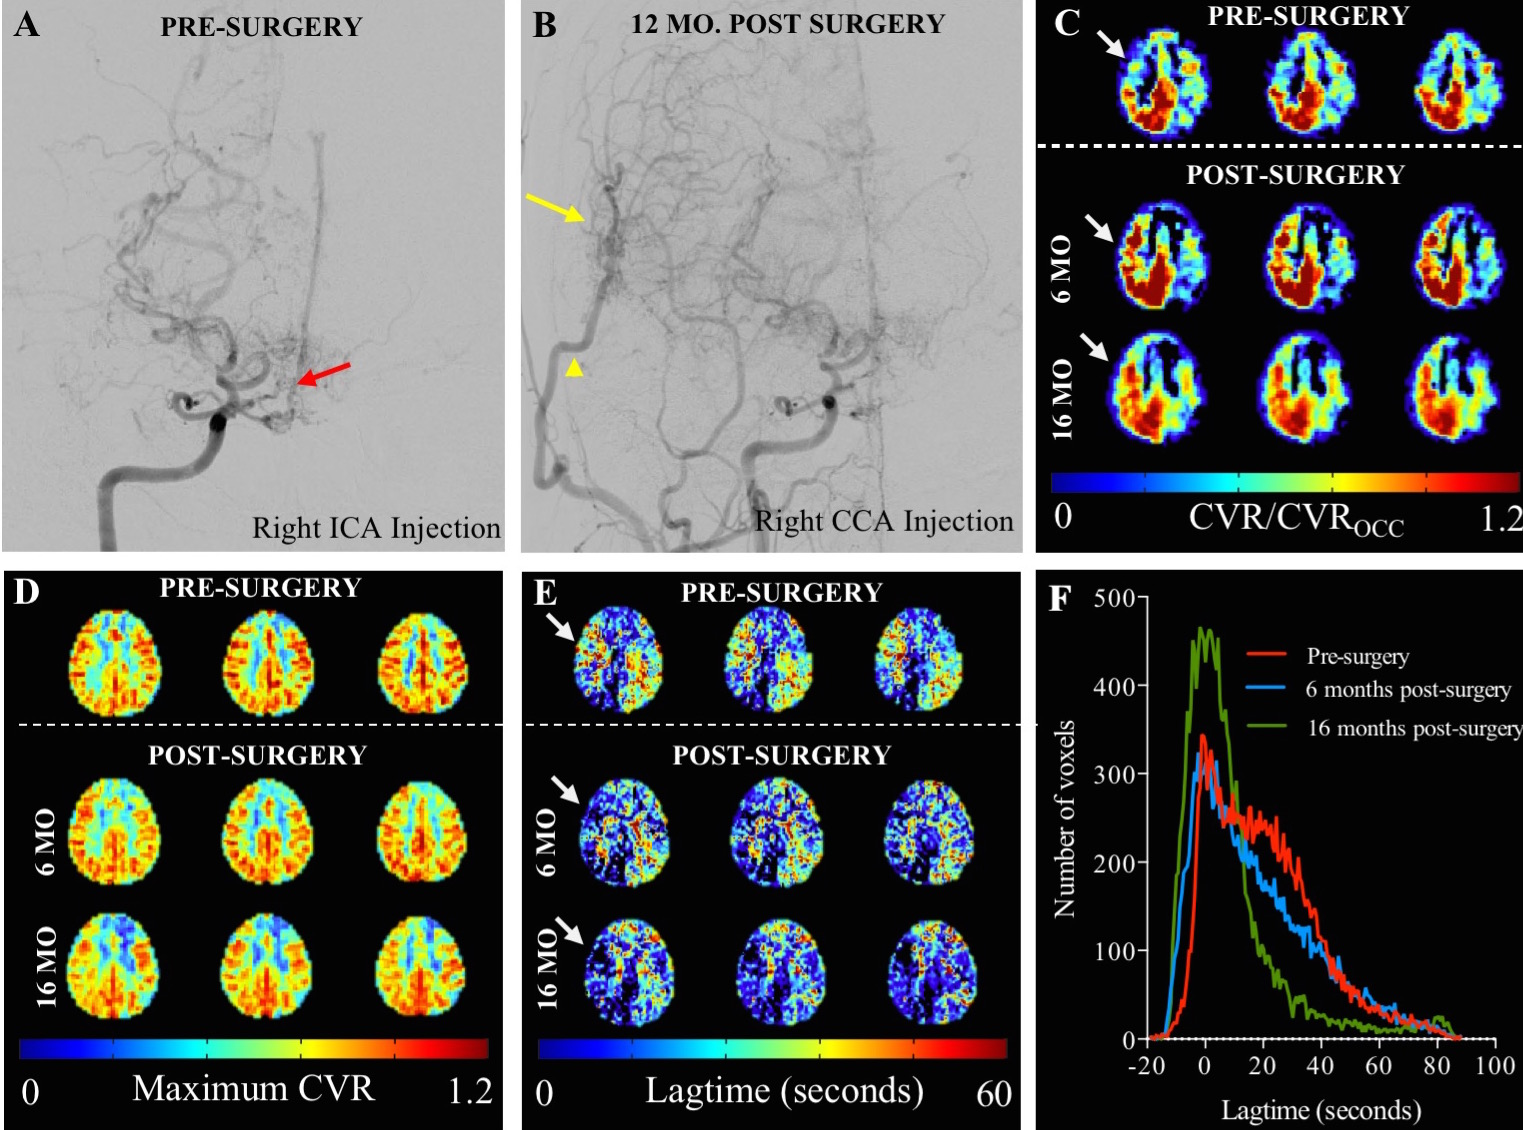
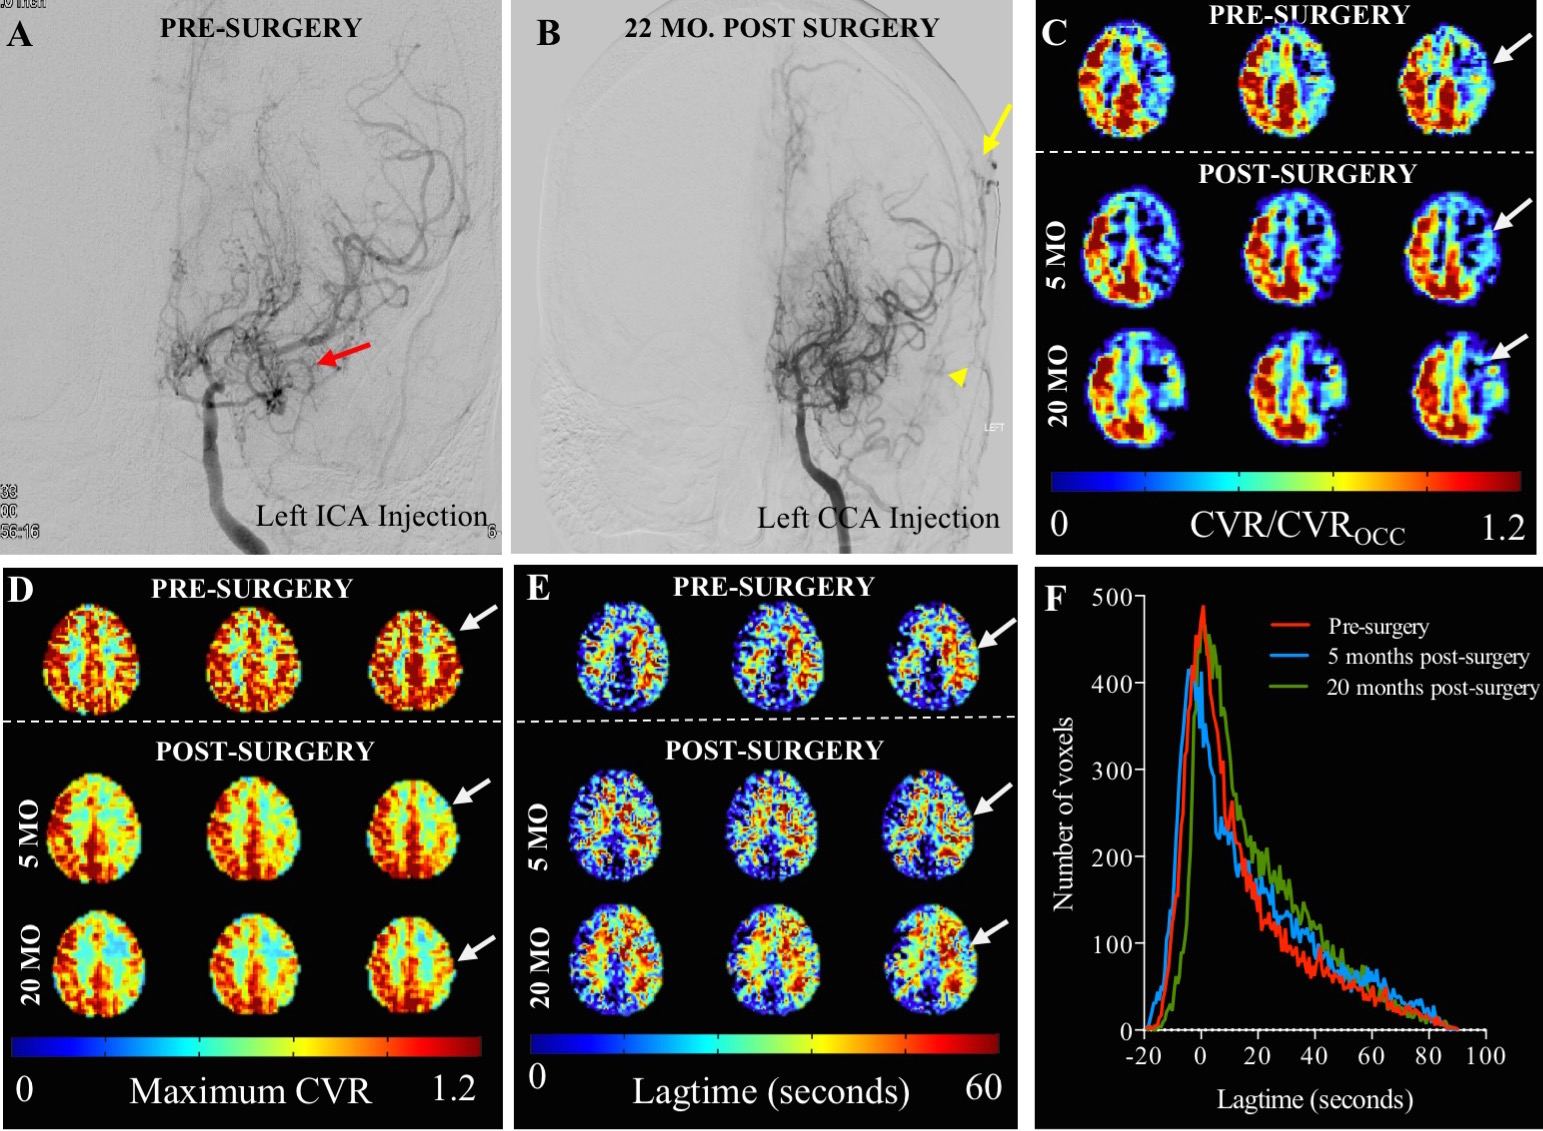
Patients (n=15) with at least one imaging time point before and after revascularization were included and post revascularization MRI scans were obtained (13.9 ± 5.2 months) following surgery at the time when follow-up imaging was clinically-indicated. Images were acquired at 3T (Philips), including standard T1-weighted, FLAIR, and DWI, together with hypercapnic (180s/180s normocapnia/5%-hypercapnia repeated once) gradient echo BOLD (spatial resolution=3.4x3.4x5 mm3; TR=2s; measurements=450). Data were preprocessed3 (slice time correction, motion correction) and registered to the T1-weighted image and to an MNI atlas. Lagtimes were calculated using RapidTiDe4, which performs time-delay cross-correlation analysis of functional imaging data to find the time at which maximum correlation occurs between BOLD signal from each voxel in a given time series compared to a reference regressor (Figure 1). A refined global regressor was used as the reference regressor and was determined for each functional imaging dataset. Maximum CVR was also determined, which corresponded to the z-statistic at the time of the voxel-wise lagtime, and was normalized to a healthy occipital region. Vascular stenosis was assessed by digital subtraction angiography (DSA) and graded by a radiologist. Success was graded based on amount of middle cerebral artery (MCA) territory revascularized (0=no revascularization; 1=<1/3 MCA territory; 2=1/3 – 2/3 MCA territory; 3=>2/3 MCA territory).Results
In n=15 patients, 20 indirect revascularization procedures were performed with varied outcomes on post-surgery DSA (grading categories 0/1/2/3 corresponding to 1/5/8/6 procedures, respectively). Hemodynamic MRI imaging was performed which provided additional spatial information not apparent from angiography alone. Figure 2 shows an example of a patient who has significant stenosis and lenticulostriate collaterals consistent with advanced moyamoya (Figure 2A) who underwent surgical revascularization. On post-surgical DSA, there are an abundance of collaterals (Figure 2B, yellow arrow). CVR imaging (Figure 2C) shows improvement in the right hemisphere, whereas maximum CVR (Figure 2D) does not change. The lagtimes (Figure 2E) decrease in the operative hemisphere, and interestingly also in the contralateral hemisphere. The lagtime changes in this patient are shown as individual histograms (Figure 2F), and a trend for decrease in longer lagtimes can be seen in the scans following surgical revascularization that resulted in robust collateral formation. Additional subjects (Figure 3) show regional differences largely consistent with vasculopathy and revascularization success, with CVR magnitude being more constant and symmetric relative to CVR response time.Discussion
Time-delay processing of BOLD data may provide additional information beyond more qualitative measures such as z-statistic or signal change measurements. The global decrease in lagtimes observed following successful revascularization can potentially be explained by the known effect of revascularization on not only the surgical hemisphere, but also the contralateral hemisphere5. Whole brain lagtimes are delayed in moyamoya disease prior to surgical revascularization, as evidenced on histogram analysis of lagtimes wherein the majority of the voxels have lagtimes exceeding 10 seconds. Of note, lagtimes greatly exceed arterial circulation times (ACT) even in patients with steno-occlusion and delayed filling (wherein ACT ~3 seconds for patients with advanced moyamoya)6, and may represent unique measures of smooth muscle reactivity to hypercapnic stimuli, which can be evaluated when moderate-to-long stimulus durations of 60s or more are used. Additionally, this data-driven approach may reduce the need for EtCO2 traces, which can have substantial delays and sampling errors.Conclusion
Reactivity time (lagtime) and maximum reactivity are potentially unique and non-overlapping indicators of impairment and collateral vessel health.Acknowledgements
No acknowledgement found.References
1. Chen BR, Kozberg MG, et al. A critical role for the vascular endothelium in functional neurovascular coupling in the brain. J Am Heart Assoc. 2014;3:e000787
2. Roach BA, Donahue MJ, Davis LT, et al. Interrogating the functional correlates of collateralization in patients with intracranial stenosis using multimodal hemodynamic imaging. AJNR Am J Neuroradiol. 2016;37:1132-1138
3. Smith SM, Jenkinson M, Woolrich MW, et al. Advances in functional and structural mr image analysis and implementation as fsl. Neuroimage. 2004;23 Suppl 1:S208-219
4. Donahue MJ, Strother MK, Lindsey KP, et al. Time delay processing of hypercapnic fmri allows quantitative parameterization of cerebrovascular reactivity and blood flow delays. J Cereb Blood Flow Metab. 2016;36:1767-1779
5. Sam K, Poublanc J, Sobczyk O, et al. Assessing the effect of unilateral cerebral revascularisation on the vascular reactivity of the non-intervened hemisphere: A retrospective observational study. BMJ Open. 2015;5:e006014
6. Donahue MJ, Ayad M, Moore R, et al. Relationships between hypercarbic reactivity, cerebral blood flow, and arterial circulation times in patients with moyamoya disease. J Magn Reson Imaging. 2013;38:1129-1139
Figures