1236
Mapping Abdominal Inflammatory Response Using Manganese-Enhanced MRI (MEMRI)1Electrical and Computer Engineering, Purdue University, West Lafayette, IN, United States, 2Biomedical Engineering, Purdue University, West Lafayette, IN, United States, 3Division of CBRN Countermeasures, Biomedical Advanced Research and Development Authority, DC, United States
Synopsis
We used in vivo Manganese-Enhanced MRI (MEMRI) to image and assess the increase in calcium influx into immune cells so as to report the cellular responses to systemically LPS-induced inflammation throughout the abdomen. We found that: (1) The contrast enhancement was dose- and time-dependent with variation across organs. (2) An increase in Mn2+ uptake was observed in the liver and the kidney, but not in the spleen or the muscle given inflammation. (3) The inflammation-induced enhancement was dependent on the time after the initial exposure to LPS.
Purpose
The manganese ion (Mn2+)
is strongly paramagnetic and analogous to the calcium ion (Ca2+),
allowing it to enter both excitable and non-excitable cells via most calcium
channels1,2. Here, we used in
vivo manganese-enhanced MRI (MEMRI) to image and assess the increase in
calcium influx into immune cells to report the cellular responses to systemically
induced inflammation throughout the abdomen.Method
22 adult male Sprague-Dawley rats (mean±SD weight: 361±19g) were scanned in this study, according to our protocol approved by the Purdue Animal Care and Use Committee (PACUC). After an initial induction of anesthesia with 4% Isoflurane, a bolus of 5mg/kg lipopolysaccharide (LPS) solution was injected intraperitoneally (IP) to induce inflammation in the experimental group, whereas in the control group, the same volume of sterilized saline was injected. Isoflurane was maintained at 1.5-2.0% throughout the experiment. A tail vein line was set up to infuse the MnCl2 solution at a constant rate of 1.5ml/hour. To study the dose and time dependence of MEMRI in the abdomen, we used three MnCl2 concentrations (50mM, 100mM, and 150mM) which correspond to three doses (13.34, 26.67, and 40 mg/kg) of infusion in the control group. Then, to determine whether Mn2+ uptake increases given inflammation, a MnCl2 dose of 26.67 mg/kg was infused into the rats 1 hour after the bolus injection of either LPS or saline. To characterize the relationship between the magnitude of calcium activity reported by Mn2+ and the duration of exposure to endotoxin, a single dose of 26.67 mg/kg of MnCl2 was infused into the LPS rats 1, 2, 3, 4 or 5 hours post-injection of LPS. For all protocols, the infusion time was 19.6±1.1 minutes.
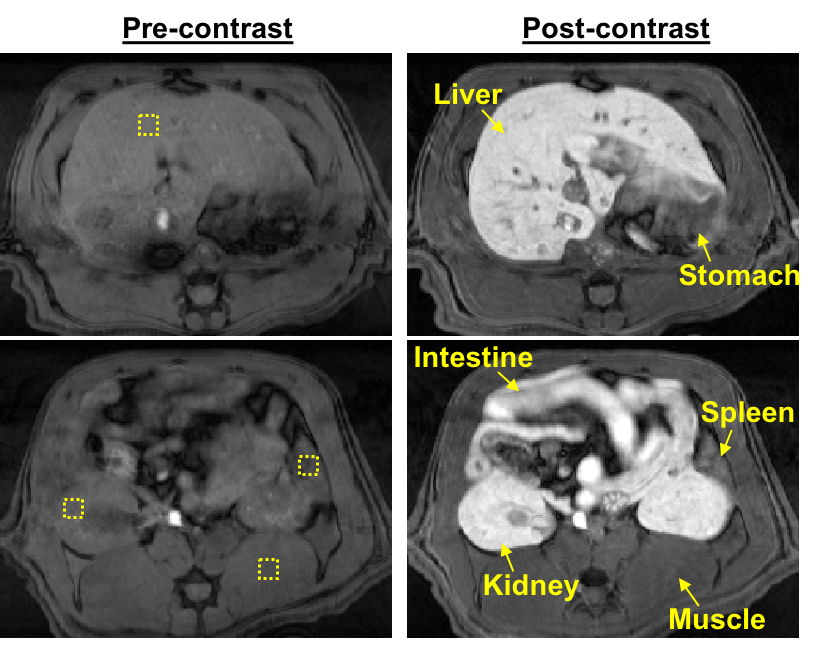
MRI was performed in a 7T small-animal MRI system (BioSpec 70/30, Bruker). A respiratory-triggered FLASH sequence was used for T1-weighted abdominal imaging (TR/TE = 120/2.5ms; FA = 90°; matrix size = 256 x 256; slice thickness = 2mm; FOV = 60 x 60mm; and four averages; 22 slices). Prior to MnCl2 infusion, two pre-contrast images were acquired; their average was used as the baseline for calculating the post-infusion percentage enhancement of image intensity. The contrast enhancement was normalized against a phantom placed next to the animal. The difference of the image intensity was assessed with one-way ANOVA with the Scheffe test.
Results
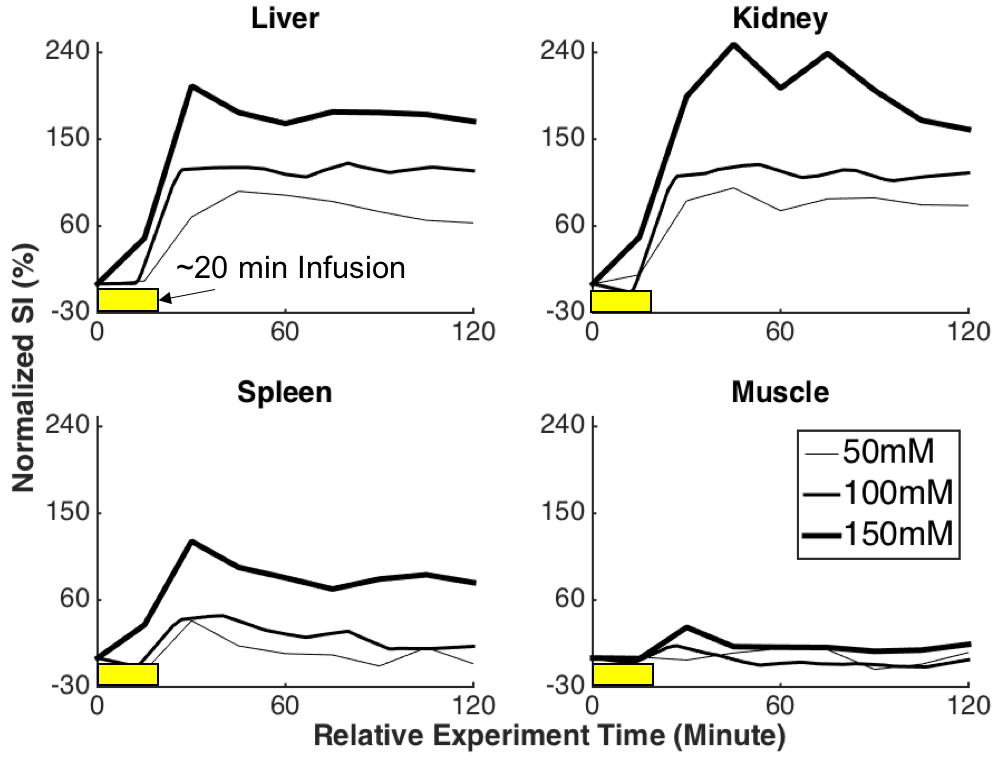
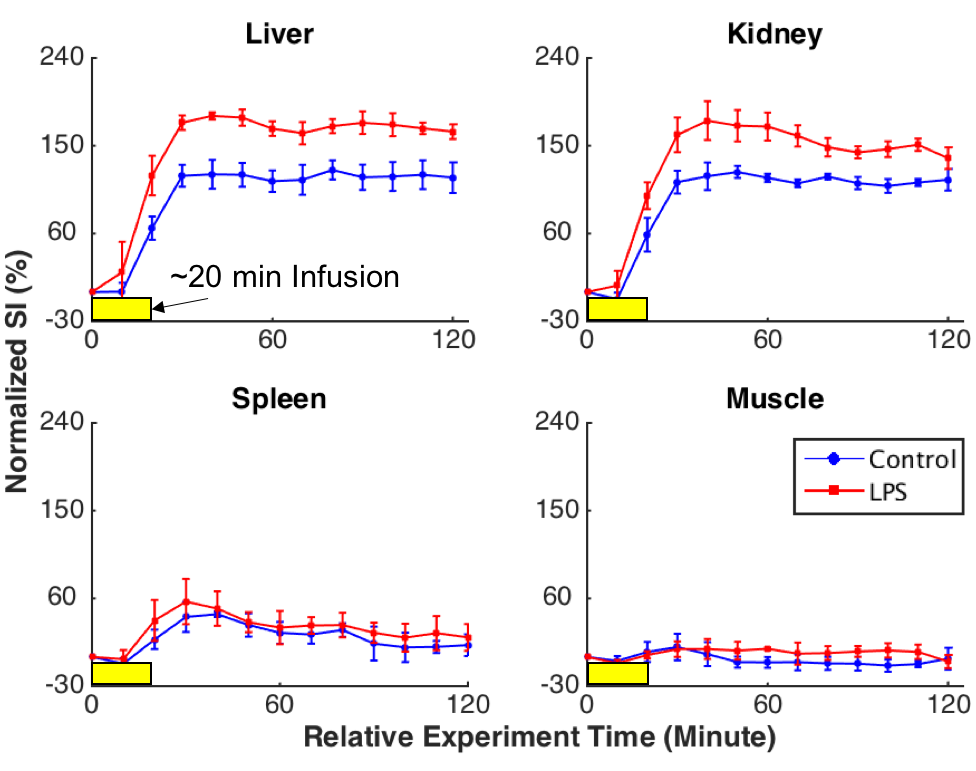
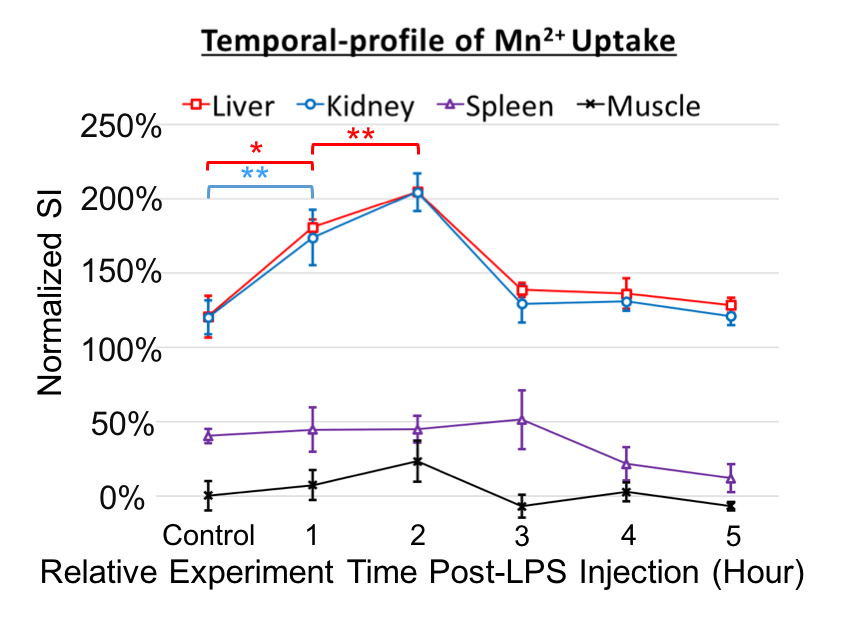
Following the MnCl2 infusion in the normal physiological condition, the contrast enhancement was dose- and time-dependent with variation across organs. A higher dose resulted in larger contrast enhancement (Fig. 2). The effect was sustained for at least 2 hours, which is much longer than the life time of extracellular Mn2+, indicating an intracellular uptake of Mn2+. When MnCl2 was infused 1 hour after the bolus-injection of LPS, a further increase in Mn2+ uptake was observed in the liver and kidney, but not in the spleen or muscle (Fig. 3), suggesting that LPS-induced inflammation increased intracellular Mn2+ uptake. Such inflammation-induced enhancement also depended on the time after the initial exposure to LPS. The effects reached a peak at 2 hours in the kidney and liver and returned to baseline after 3 hours, whereas the effect in spleen was (marginally) strongest at 3 hours (Fig. 4).Conclusions
In summary, we have shown the feasibility of using MEMRI to assess the inflammatory response in abdominal organs. Since the elevation of intracellular Ca2+ is a cellular marker of inflammation3, we hypothesized that the MRI-reported intracellular Mn2+ uptake increases given LPS-induced inflammation. We first showed a safe and effective dose of MnCl2 (26.67 mg/kg) that produced significant enhancement in most tissues but did not reach the saturation plateau for Mn2+ uptake. Next, we found that the amount of Mn2+-uptake was significantly greater given inflammation, and the enhancement was sustained for 2 hours. We attribute this effect to intracellular Mn2+ rather than extracellular Mn2+, since extracellular Mn2+ could have begun to wash out as soon as 4 minutes after the infusion ended; this was based on observed image enhancement in the bladder. However, we do not rule out the possibility that the observed enhancement is partially due to the increase in cardiac output during inflammation. Through this experiment, we investigated the temporal dynamics of the resulting Ca2+ influx from various immune cells, which has not been fully examined in previous research. We characterized the onset of Ca2+ influx reported by Mn2+ by utilizing a longer post-injection time, which was about 1 to 2 hours post-LPS injection.Acknowledgements
This work was sponsored by the Defense Advanced Research Projects Agency (DARPA) BTO under the auspices of Dr. Doug Weber through the [Space and Naval Warfare Systems Center, Pacific OR DARPA Contracts Management Office] Grant/Contract No. N66001-14-2-4056References
1. Silva, A. C., Lee, J. H., et al. Manganese-enhanced magnetic resonance imaging (MEMRI): Methodological and practical considerations. NMR in Biomedicine. 2004;17(8), 532–543.
2. Aoki, I., Takahashi, Y., et al. Cell labeling for magnetic resonance imaging with the T1 agent manganese chloride. NMR in Biomedicine. 2006;19(1), 50–59.
3. Vig, M., Kinet, J. Calcium signaling in immune cells. Nature Immunology. 2009;10(1), 21–28.
Figures