1232
Towards Addressing Unmet Needs in MR-only Radiotherapy Treatment Planning: The Feasibility of Estimating Electron Density from Quantitative Water/Fat Imaging1Physical Sciences, Sunnybrook Research Institute, Toronto, ON, Canada, 2Medical Physics, Sunnybrook Health Sciences Centre, Toronto, ON, Canada, 3Radiation Oncology, University of Toronto, ON, Canada
Synopsis
MR-only treatment planning requires the knowledge of electron density to account for medium heterogeneities during dose calculation. This work introduces a novel perspective for electron density estimation by utilizing quantitative water/fat imaging. Water/fat phantoms with different percentages were scanned on MR and CT. Water/fat separation was performed while correcting (or minimizing) major sources of signal bias. A linear regression model between CT and corrected MR signals was calculated and used to derive MR-based electron density curve. This approach targets radiotherapy applications that require sensitive soft-tissue heterogeneity correction such as prostate and breast low-dose-rate (LDR) brachytherapy.
Purpose
To explore the feasibility of a novel perspective for the extraction of electron density, required for MR-only heterogeneity-corrected dose calculation, using quantitative water/fat imaging.Rationale
Accurate dose calculation in radiotherapy treatment planning requires: 1) accurate identification of anatomical borders,1 and 2) knowledge of electron density information to correct for medium heterogeneity in the underlying tissue.2 Computed Tomography (CT) has been long established as the standard modality for treatment planning due to its ability to estimate the electron density from the measured Hounsfield units (HU). On the other hand, MRI provides superior soft tissue contrast compared to CT which allows more accurate delineation of the anatomy. As clinical multimodality workflow is known to be laborious, cost inefficient and prone to registration errors, hence recent technologies aim to include MR only during treatment planning.3 This necessitates extracting electron (or physical) density of the tissue from MR images. Current research direction aims to utilize conventional MR sequences to “synthesize” CT images from MR – so called “pseudo-CT”.4 This approach might not be applicable to low-dose-rate (LDR) radiation therapy, such as breast and prostate LDR brachytherapy, where dose calculation is more sensitive to soft-tissue heterogeneities. This work introduces a different approach to estimate the electron density by utilizing quantitative water/fat imaging.Methods
In clinical workflow, electron density are usually obtained from a prior CT scan of phantoms with known densities. A calibration curve correlating the measured HU to their corresponding densities is estimated and incorporated into the treatment planning system. In this study we will derive HU from quantitative MR water/fat images, then correlate the derived values to their corresponding electron density from the calibration curve.
Water/fat phantom were reconstructed with different water/fat fractions. Peanut oil was used as fat-representative, while agar as water-representative. Gadolinium Chloride III and Sodium Chloride were added to the agar solution to shorten T1 and adjust the medium conductivity, respectively. Peanut oil was added with different percentages: 0%, 3%, 5%, 10%, 20%, 30%, 40%, 50%, 60%, 70%, 80%, 90% and 100%.
The phantom was scanned at 1.5T GE Optima 450W with the body coil using a multi-gradient echo sequences with TR/TE1/dTE=10.2/1.3/1.25ms, ETL=3 (2 shots), FA=5ᵒ, acquisition matrix=192x112, BW=83.3 KHz, FOV=26x18cm, slice thickness=5mm and NEX=6. B0 inhomogeneities were estimated during water/fat separation while considering multi-peak fat spectrum and accounting for T2* decay.5,6 B1+ (transmit) inhomogeneities were ignored (fair assumption for small FOV and low field strength).The phantom was subsequently scanned on a Philips Brilliance CT Big Bore with 140kV and 113mA.
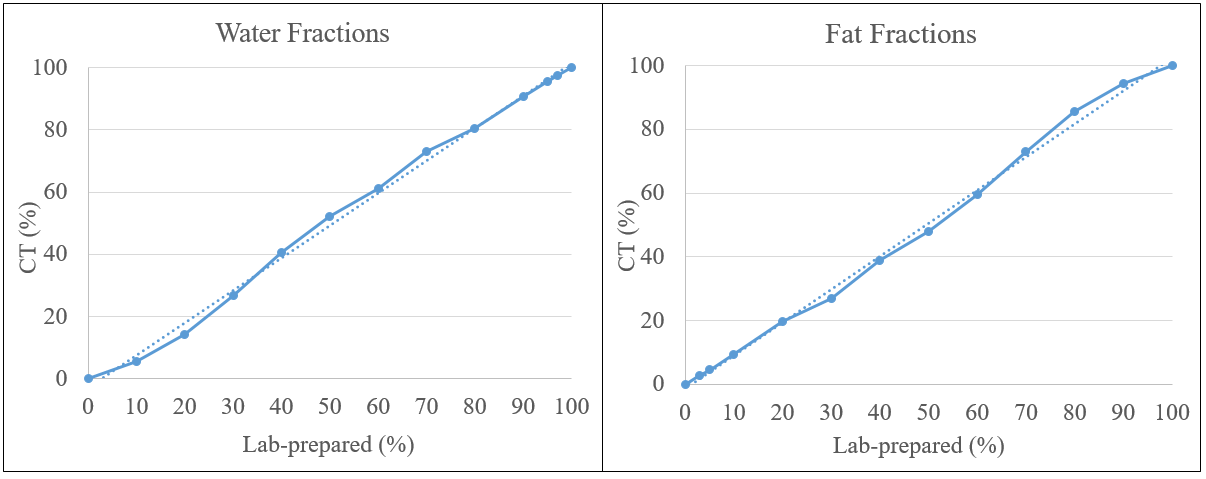
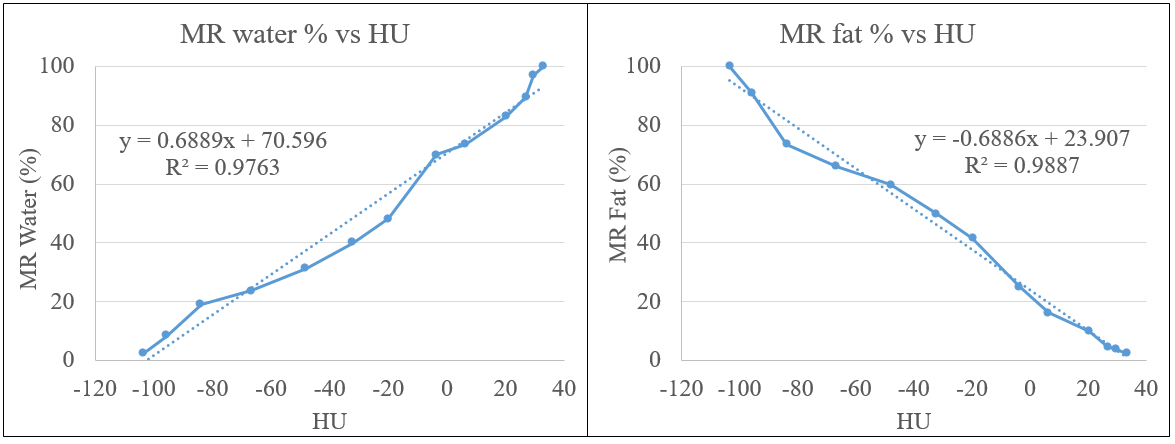
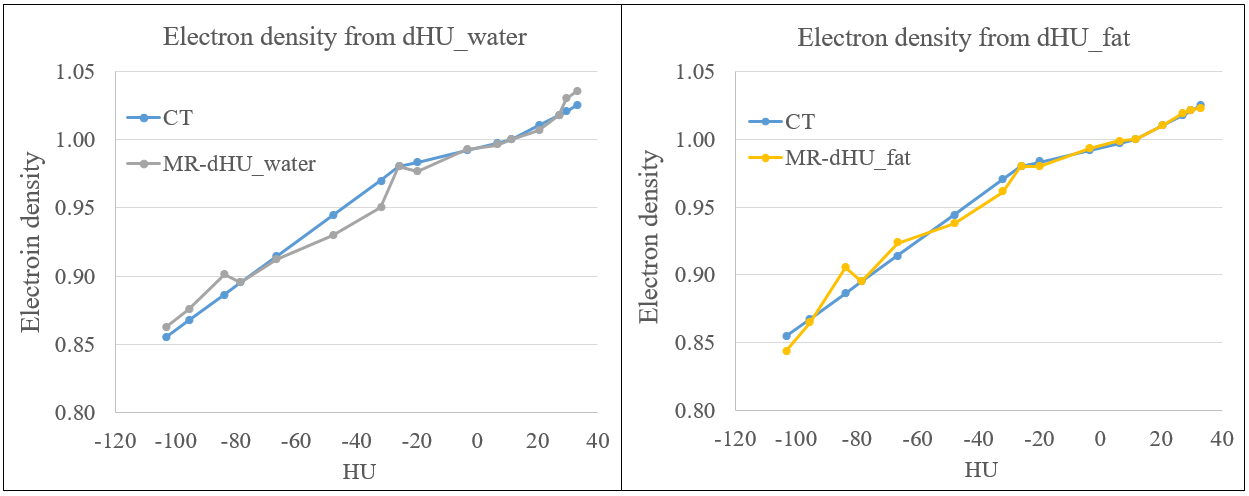
Selected ROIs were drawn on a typical slice within the same location from MR and CT datasets. MR-corrected fat and water signals from all vials were normalized to the signal from 100% and 0% fat fraction vials, respectively. Similarly, CT HU from all the vials were normalized to HU of 100% and 0% fat fractions vials to obtain CT fat and water percentages, respectively. Fat and water percentages from normalized CT were compared to the lab-prepared fractions for validation. A linear regression is calculated between MR-corrected percentages and the measured HU. The regression model is then used to derive MR-based HU (dHU) for each fat/water fraction. Finally, an MR-based calibration curve is obtained by correlating dHU with the electron density values obtained from the Pinnacle treatment planning system, used in our clinic.
Results
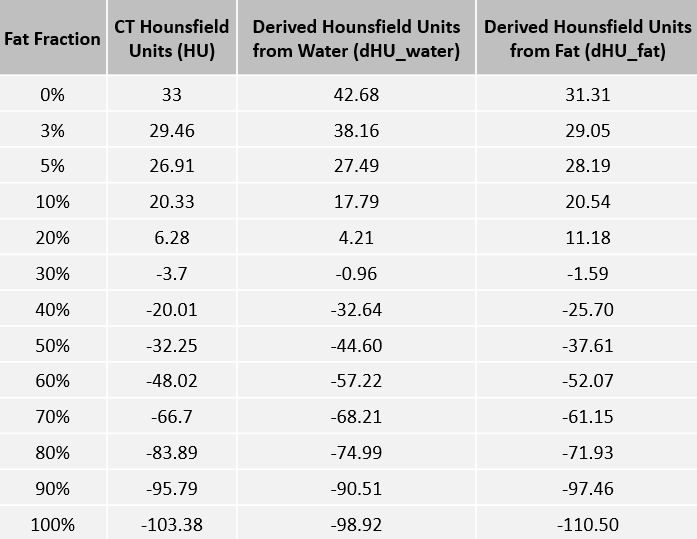
Vials with 70%, 80%, and 90% fat percentages showed inhomogeneous distributions, however their results were included for completion. Excellent agreement were found between CT fat/water percentages, and the lab-prepared fat/water fractions (R2=0.99) – Figure 1. The correlation between corrected MR fat and water percentages with the measured HU showed good agreement – Figure 2. Table 1 shows HU vs dHU calculated from the two regression models of fat and water, dHU_water and dHU_fat respectively. In Figure 3, MR-based electron density curves using dHU from water and fat quantification are drawn against CT calibration curve. Good agreement can be observed between the two curves in both components.Discussion
Although promising results were demonstrated, this approach has several limitations: first it used body coil to avoid B1- (receive) inhomogeneities; this lowers the resultant SNR. Second, for in-vivo studies, B1+ inhomogeneities need to be addressed, particularly for higher field strengths and larger FOV. Finally, the estimated electron density curve spans over limited HU range, which only corresponds to water/fat –based soft tissue.Conclusion
This work demonstrated the feasibility of utilizing quantitative water/fat imaging to correlate MR signal to the electron density, which is necessary for MR-only heterogeneity-corrected dose calculation in LDR brachytherapy applications. Further in-vivo validations are required.Acknowledgements
No acknowledgement found.References
[1] Vinod SK, Jameson MG, Min M, Holloway. Uncertainties in volume delineation in radiation oncology: A systematic review and recommendations for future studies. Radiother. Oncol. 2016 (in press). http://dx.doi.org/10.1016/j.radonc.2016.09.009
[2] Beaulieu L, Carlsson Tedgren Å, Carrier J-F, et al. Report of the Task Group 186 on model-based dose calculation methods in brachytherapy beyond the TG-43 formalism: Current status and recommendations for clinical implementation. Med. Phys. 2012; 39 (10):6208-6236
[3] Lagendijk JJ, Raaymakers BW, Van den Berg CA, et al. MR guidance in radiotherapy. Phys. Med. Biol. 2014; 59 (21):R349
[4] Dowling JA, Lambert J, Parker J, et al. An Atlas-Based Electron Density Mapping Method for Magnetic Resonance Imaging (MRI)-Alone Treatment Planning and Adaptive MRI-Based Prostate Radiation Therapy. Int’l J Rad. Oncol. Biol. Phys. 2014; 83 (1):e5-e11
[5] Yu H, Shimakawa A, McKenzie CA, et al. Multiecho water-fat separation and simultaneous R2* estimation with multifrequency fat spectrum modeling. Magn. Reson. Med. 2008; 60 (5):1122-1134
[6] Soliman AS, Yuan J, Vigen KK, et al. Max-IDEAL: A max-flow based approach for IDEAL water/fat separation. Magn. Reson. Med. 2014; 72 (2):510-521
Figures