1230
Measurement of Brown Adipose Tissue Activity in Response to Thermal Challenges Using Dixon MRI1Medical Imaging, Ann & Robert H. Lurie Children’s Hospital of Chicago, Chicago, IL, United States, 2Radiology, Feinberg School of Medicine, Northwestern University, Chicago, IL, United States, 3Division of Endocrinology, Metabolism and Molecular Medicine, Feinberg School of Medicine, Northwestern University, Chicago, IL, United States
Synopsis
Brown adipose tissue (BAT) is the primary site of adaptive thermogenesis, which may play a potential role in the pathogenesis and treatment of obesity, and related metabolic disorders. The purpose of this study is to use Dixon MRI to measure BAT tissue properties under pre-cold, post-cold individualized non-shivering thermogenesis, and re-warm-up conditions, in order to evaluate BAT activity among normal-weight, over-weight and obese subjects.
Background
Obesity has become an epidemic in the United States and much of the developed world. Energy imbalance is considered as the principle cause of obesity. Recent research focuses attention on the potential roles of adipose tissue in the pathogenesis and treatment of obesity, and related metabolic disorders. Brown adipose tissue (BAT) is the primary site of adaptive thermogenesis with energy expenditure and heat production. 18F-FDG PET/CT is a widely accepted method to detect metabolically active BAT with increased glucose uptake after cold exposure. PET/CT imaging shows a great inter-individual variability in the presence and activity of BAT, with decreased BAT activity observed in obesity1. MRI methods are emerging to differentiate brown and white adipose tissues2. However, the activity of BAT in response to thermal stimulations has not been fully explored using MRI. The purpose of this study is to use Dixon MRI to measure BAT tissue properties at quiescent and activated statuses for detecting BAT activity among normal-weight, over-weight and obese subjects.Methods
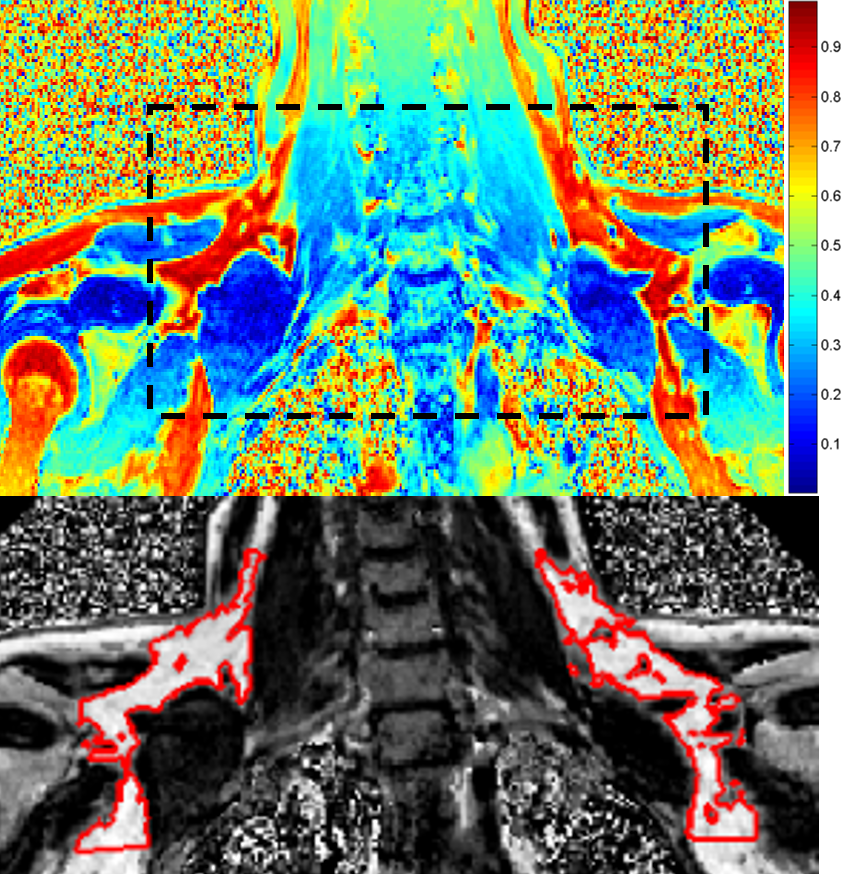
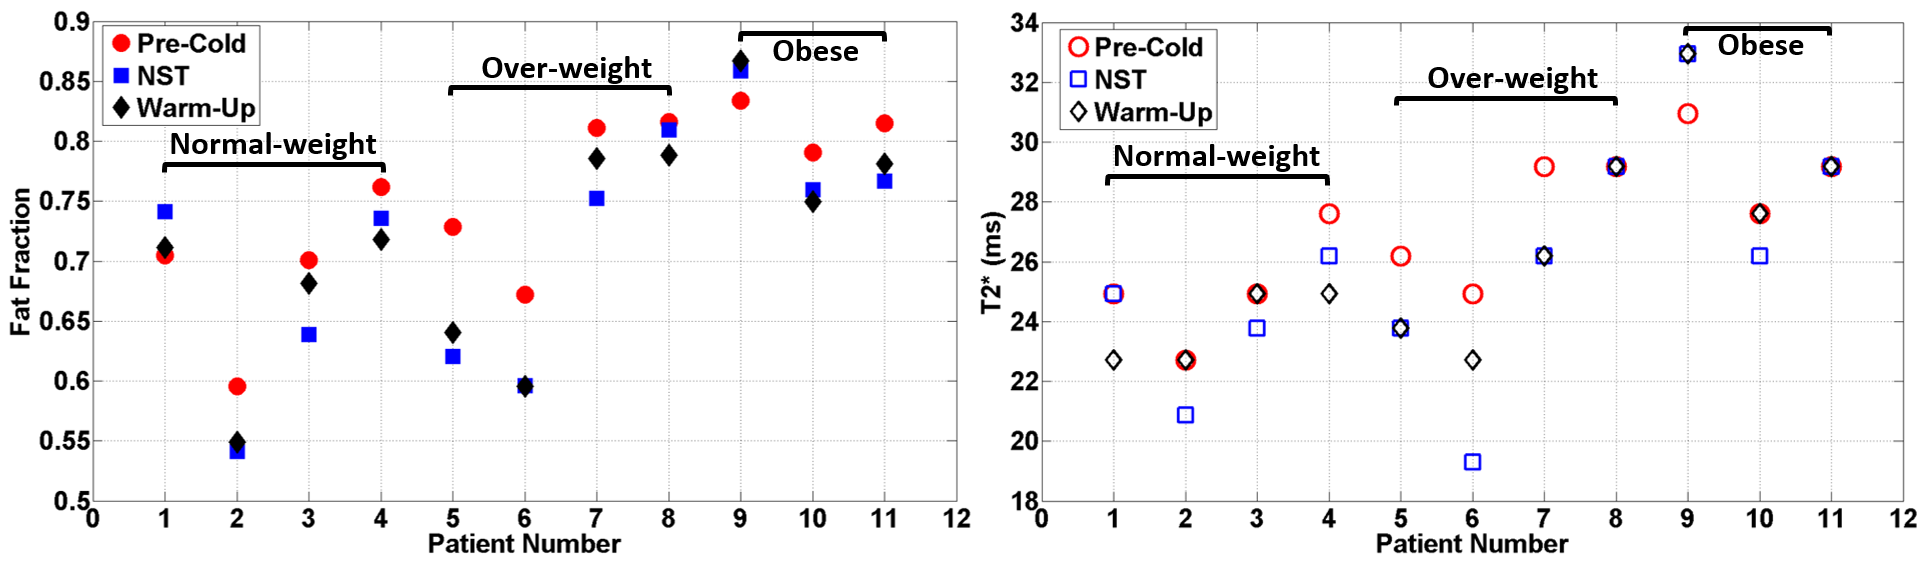
Eleven healthy male adults aged 18-24 years (4 normal-weight: BMI 18.5-24.9kg/m2, 4 over-weight: BMI 25-29.9kg/m2 and 3 obese: BMI >30.0kg/m2) were included in the study. Dixon MRI scans were performed at 1.5T under three thermal conditions: pre-cold, post-cold individualized non-shivering thermogenesis (NST), and re-warm-up (WM). An 18F-FDG PET/CT scan was performed at NST and BAT activity was measured as the maximum standardized uptake value (SUVmax). A DXA scan was performed to measure body fat composition, including total body fat percentage and trunk fat mass ratio (TFRDXA). Dixon MRI imaging parameters: 3D VIBE, coronal plane, FOV=400×280mm2, TR=20ms, six TEs=2.3-13.8ms, ΔTE=2.3ms, matrix=316×224, thickness/gap=4/0mm, FA=6°, BW=485Hz/px, iPAT=2. Fat fraction (FF) was calculated from estimates of water and fat proton density (ρW and ρF). Proton densities and T2* were obtained from solving an optimization problem that fit complex signal intensities to a theoretical signal model with penalized non-smooth field map estimates3. For a single voxel the signal model was given by: S(t) = (ρW + ρF∙∑αp∙exp(i∙2π∙fp∙t)) ∙exp(-t/T2*)∙exp(i∙2π∙ψ∙t) , where ψ is the field map arising from local magnetic field inhomogeneities. A six-peak fat model was used, where αp is the relative amplitude of the pth fat peak and fp is the frequency offset relative to the water peak. As shown in Fig.1, to identify the BAT area in the supraclavicular fossae, boundaries were defined as the bottom of cervical-4, bottom of glenoid, and coracoid. Within the boundary in the FF map, BAT ROIs were segmented using the Otsu thresholding method to eliminate partial volume effect and vessels. For each subject, within all BAT ROIs across all slices, median FF and T2* at each thermal status and the differences between two statuses were calculated. MRI measurements were correlated with BMI, PET/CT and DXA measurements.Results
Body composition vs. MRI: TFRDXA showed significant correlation with FF and T2* at each of the three thermal statuses (R>0.82, p<0.01), with higher trunk fat mass ratio corresponding to higher FF and higher T2*. Nonetheless, there was no correlation between body composition and the changes of MRI measurements secondary to thermal conditions. PET/CT: A great variation of glucose uptake in BAT was observed, and there was no correlation between SUVmax and body composition, or any MRI measurement. FF and T2* changes with thermal stimulations: As shown in Fig. 2, a consistent pattern was observed in S2-S3 (normal-weight) and S5-S7 (over-weight), where both FF and T2* decreased at NST and tended to recover at WM, compared with the pre-cold measurements. All obese subjects and the highest BMI over-weight subject (S8) showed an opposite pattern in either FF or T2*: FF increased at NST/WM or FF decreased at NST with further decreasing at WM, rather than recovery to pre-cold; T2* remained unchanged or increased at NST/WM. Interestingly, S8 showed a high TFRDXA of 0.59, which was even higher than most of the obese subjects (0.51-0.63). Two exceptional normal-weight subjects (S1 and S4) showed similar FF or T2* changing patterns to those of over-weight/obese subjects. S1’s FF increased at NST, and T2* remained unchanged at NST. S4’s FF decreased at NST and continued at WM, similar to S8 and S10. Interestingly, S4 showed high baseline pre-cold FF and T2*, close to the range of over-weight/obese subjects. Coincidentally, PET image of S1 lacked glucose uptake in BAT; and a high TFRDXA in S4 (0.51) fell in the range of obese subjects.Discussions
Static state FF and T2* measurements of BAT correlate well with DXA body composition measurement, especially with TFRDXA. This novel finding is consistent with a recent study4 that a high ratio of trunk to leg volume better stratify the risk for diabetes and mortality, even among those with normal BMI. Furthermore, dynamic FF and T2* change pattern secondary to thermal challenges provide an insight of the activity of BAT. When normal BAT is activated, combustion of the fatty acids leads to depletion of lipids within adipocytes, and the increased level of deoxyhemoglobin due to increased oxygen consumption results in decreased T2*. Abnormal BAT activation may be associated with potential metabolic risks, which may not be revealed by the anthropometric measurements or PET/CT imaging. Future studies including a larger sample size, a wider range of age groups, and metabolic markers to be correlated with MRI findings are warranted.Conclusion
Morphological and activity measurements of BAT using Dixon MRI can provide important complementary information of BAT tissue properties.Acknowledgements
This project was supported by Grant Number 1R21DK103145-01 from the National Institute of Diabetes and Digestive and Kidney Diseases (NIDDK).References
[1] Yoneshiro T, Aita S, Matsushita M, Kameya T, Nakada K, Kawai Y, Saito M.Brown adipose tissue, whole-body energy expenditure, and thermogenesis in healthy adult men. Obesity (Silver Spring). 2011 Jan;19(1):13-6. doi: 10.1038/oby.2010.105.
[2] Hu HH, Perkins TG, Chia JM, Gilsanz V. Characterization of human brown adipose tissue by chemical-shift water-fat MRI. AJR Am J Roentgenol. 2013 Jan;200(1):177-83. doi: 10.2214/AJR.12.8996.
[3] Hernando D, Kellman P, Haldar JP, Liang ZP. Robust water/fat separation in the presence of large field inhomogeneities using a graph cut algorithm. Magn Reson Med. 2010 Jan;63(1):79-90. doi: 10.1002/mrm.22177.
[4] Wilson JP1, Kanaya AM, Fan B, Shepherd JA. Ratio of trunk to leg volume as a new body shape metric for diabetes and mortality. PLoS One. 2013 Jul 10;8(7):e68716. doi: 10.1371/journal.pone.0068716.
Figures