1229
Metabolic Imaging of Dynamic Fat Mobilization in Activated Brown Adipose Tissue1Laboratory of Metabolic Imaging, Singapore Bioimaging Consortium, A*STAR, Singapore
Synopsis
Brown adipose tissue (BAT) is a target fat compartment for treatment of metabolic diseases due to its high metabolic capacity. BAT is major site for adaptive thermogenesis involving uncoupling protein-1. We have studied the dynamic oxidative fat metabolism in interscapular brown adipose tissue by activation of β3-adrenergic receptors. Progressive reduction of the lipids from iBAT region is indicative of oxidative metabolism by utilizing the lipids as fuel substrate. Evaluation of lipid mobilization in real time is important to assess the altered metabolic rate and mitochondrial biogenesis involving lipid oxidative metabolism.
Purpose
To
evaluate the oxidative fat
metabolism in activated brown adipose tissueIntroduction
White adipose tissue (WAT) and Brown adipose tissue (BAT) play unique role in energy storage and energy expenditure respectively. Brown adipocytes are characterized by abundant iron-rich mitochondria with multiple smaller lipid droplets1. There is a need for understanding of mechanistic pathways of BAT activation considering it is a potential endocrine organ for treatment of metabolic diseases. In this context we have studied the dynamic oxidative fat metabolism in interscapular brown adipose tissue by activation of β3-adrenergic receptors.Methods
All the experimental procedures carried out in this study were approved by institutional animal care and use committee. Male Wistar rats of twelve weeks old were randomized into two groups including β3-adrenergic agonist (n=5) treated and saline (n=5) treated groups. The β3-adrenergic agonist, CL-316243 was administered at 0.2 mg/Kg body weight of the animal. Animals were anesthetized with 1.5-2% Isoflurane in combination with air and catheterized for β3-adrenergic agonist or saline injections before imaging. The MR measurements were performed by using 7T MRI scanner (Clinscan). A 72 mm volume coil was used for radio frequency pulse transmission in combination with 2 x 2 phased array coil for signal reception. Fat-Water Dixon imaging was performed in interscapular BAT (iBAT) region with FOV 54x54 mm2, matrix size 256×256, in-plane resolution of 211μmx211μm, slice thickness of 1mm,TR=8 ms, averages=1, flip angle=8°, echo bandwidths of 1090 and 1500Hz/pixel, with out-of-phase (1.0ms) and in-phase (2.5ms) echo times. Localized PRESS sequence was employed in interscapular BAT and WAT with TR=4s, TE=13ms, NA 16, voxel volume-8mm3, SW= 3500 Hz, data points= 2048. Fat content from in vivo spectra were estimated using LC Model software2. Dynamic MRI/MRS was performed at 10 minutes (min), 30 min, 60 min, 90 min and 120 min after administration of β3-adrenergic agonist including baseline (T0 min) scans before intervention. After terminal experiments BAT and WAT samples were fixed in neutral buffered solution (10 %) for 24 hours. A slice of 5µm tissue section was stained for hematoxylin (H) and eosin (E) staining. The mRNA analysis of CPTI and UCP1 genes were performed in both WAT and BAT.Results and Discussion
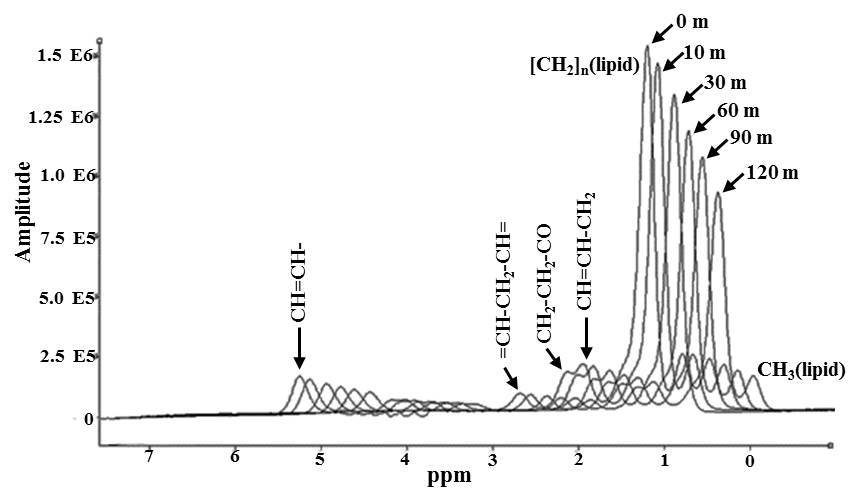
Figure 1 shows the in vivo dynamic spectra obtained from
iBAT at various time points. The amplitude of (CH2)n
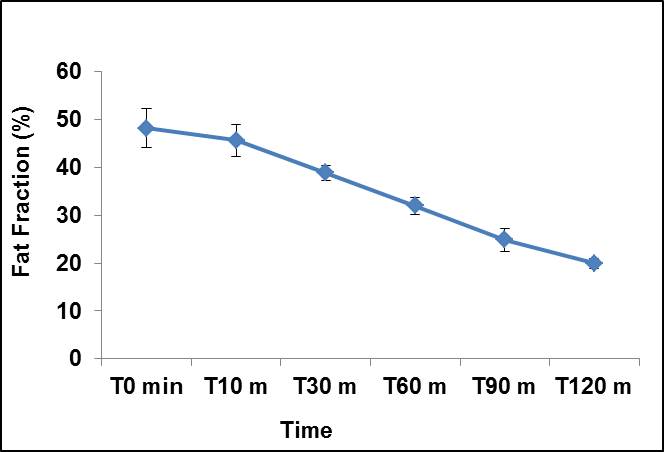
at 1.3 ppm decreased progressively after the injection of β3 agonist. Figure 2
shows the kinetics of lipids oxidation at different time
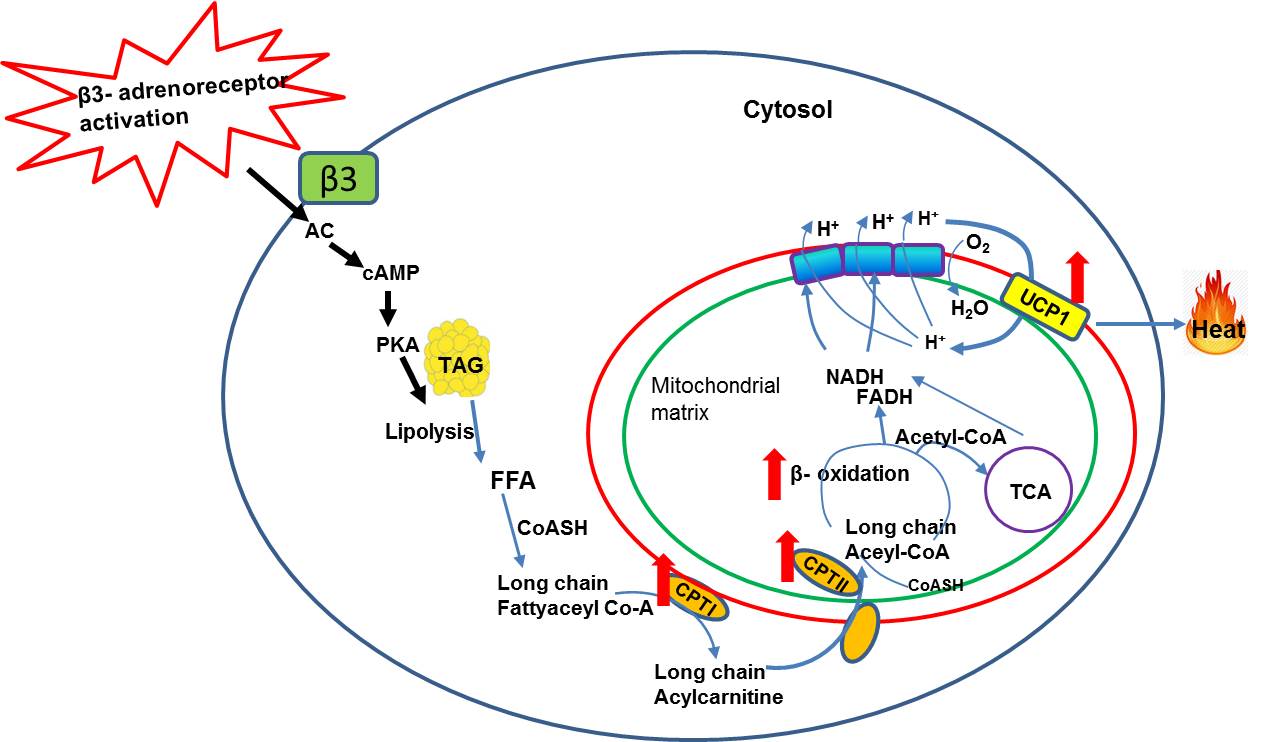
interval. In response to activation of sympathetic nervous system by
β3-adrenergic agonist, series of metabolic events occur (Figure 3)
leading to lipolysis induced thermogenesis. The β3-adrenergic
agonist is taken up by the adrenergic receptors and activates the adenylate
cyclase (AC) by Gα G-protein coupling with increased cellular concentration of
cAMP. This in turn activates protein kinase A (PKA) and results in
phosphorylation of lipid droplets3-5. The net effect is release of free
fatty acids (FFA) by the hydrolysis of triglyceride
(TG) lipid droplets. The FFAs activated to long chain fatty acyl CoAs by
acyl-CoA synthetase and converted to long chain acylcarnitine by the
up-regulation of CPT1 in the outer membrane of mitochondria. Long chain
acylcarnitines are then transported into mitochondrial matrix by carnitine
transporter which is a rate limiting step for beta oxidation. In the
mitochondrial matrix, long chain acylcarnitines are cleaved into free carnitine
and acyl CoA by the up-regulation of CPTII involved in beta oxidation leading
to UCP1 uncoupled thermogenesis. In the current study, the CPTI expression was
upregulated in iBAT indicating the elevated lipolysis. UCP1 expression was also
upregulated in iBAT evidencing the activated BAT followed by thermogenesis. Upregulation
of both CPTI and UCP1 confirms that lipolysis is inevitable for thermogenesis. The
progressive depletion of the lipids from iBAT region is indicative of oxidative
metabolism by utilizing the lipids as fuel substrate. To support the stimulated
energy requirements, utilization of intracellular energy stores by iBAT has
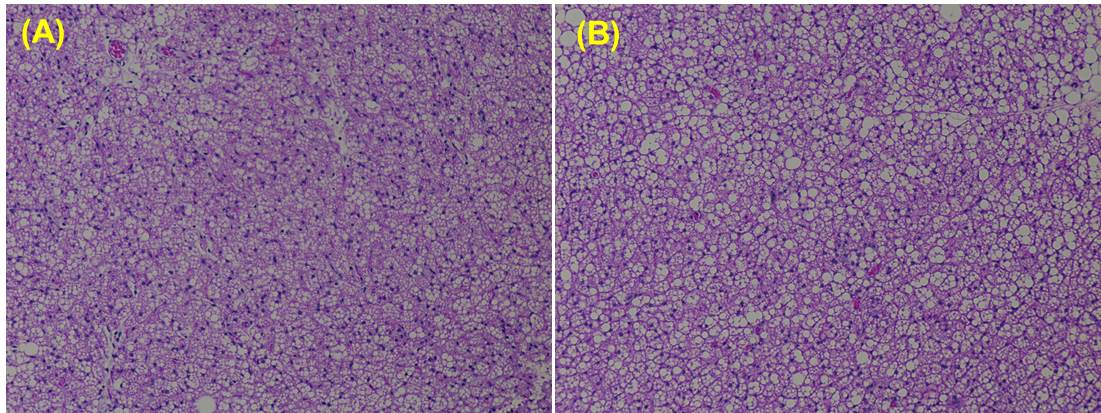
been reported by Cannon B et.al6. The iBAT might use intracellular lipid
droplets within the brown adipocytes initially and later may recruit from
neighboring white adipocytes. This was confirmed in histology of iBAT (Figure
4A, B). We noticed the significant depletion of lipid droplets in H & E
sections from iBAT of β3-adrenergic agonist treated animal compared to saline
treated.Conclusion
We have investigated the lipid oxidation by dynamic imaging and spectroscopy during BAT activation. The β3-adrenergic mediated lipid oxidation followed by thermogenesis is supported by the up-regulation of CPTI and UCP1. Evaluation of lipid mobilization in real time is important to assess the altered metabolic rate and mitochondrial biogenesis involving lipid oxidative metabolism. Our results suggest that this approach can be extended for designing targeted lipolysis and oxidation.Acknowledgements
No acknowledgement found.References
(1). Cinti S, The role of brown adipose tissue in human obesity. Nutr Metab Cardiovasc Dis. 2006;16:569-574.
(2). Provencher SW. Automatic quantitation of localized in vivo 1H spectra with LCModel. NMR Biomed. 2001;14:260-264.
(3). Silva JE, Thermogenic mechanisms and their hormonal regulation. Physiol. Rev. 2006;86:435-464.
(4). Souza SC. Christoffolete MA, Ribeiro MO. et al, Perilipin regulates the thermogenic actions of norepinephrine in brown adipose tissue. Lipid. Res. 2007;48:1273-1279.
(5). Granneman JG, Why do adipocytes make the beta 3 adrenergic receptor. Cell Signal. 1995;7:9-15.
(6). Cannon B. et al, Brown adipose tissue: function and physiological significance. Physiol Rev. 2004;84:277-359
Figures