1228
Quantifying Fat Mass and Energy Content in Brown Adipose Tissue1Gorter Center for High Field MRI, Radiology, Leiden University Medical Centre, Leiden, Netherlands, 2Endocrinology, Leiden University Medical Centre, Leiden, Netherlands
Synopsis
MRI of Brown Adipose Tissue (BAT) is gaining popularity as an alternative to PET-CT. Most commonly used marker in quantifying BAT is fat fraction, however there is no consensus to the range of fat fractions separating BAT and WAT. In this work we show how calculating energy content and total fat mass allows to avoid partial volume effect and provides more quantitative markers than fat fraction. We also argue that the fat fractions in the high end of the range (80% - 100%) contribute significantly to BAT activity.
Introduction
Obesity is a major risk factor for the development of type 2 diabetes and cardiovascular disease. Recently, brown adipose tissue (BAT) has been identified as a potential therapeutic target for obesity (1-2). While the most common technique to determine BAT activity is 18F-FDG PET-CT (3,4), assessment using MRI is gaining momentum (4-9). Due to the presence of small lipid droplets and large amount of cytoplasm the fat fraction (%fat) of BAT is lower compared to white adipose tissue (WAT). Most studies use this fact to establish an arbitrary %fat range, considering voxels within this range to be BAT and outside either WAT or lean mass. However there is currently no consensus on the range corresponding to BAT, although several studies suggest an upper separation limit of 80-90% (6-8,10). One issue with this approach is that the BAT depot is very heterogeneous, and therefore the repository will contain both WAT and BAT. Additionally, the partial volume effect means that an intra-voxel interface between lean and fatty tissue artificially lowers the measured %fat. In this study we calculate total fat mass and tissue energy instead of %fat to avoid partial volume effects. We use these quantities to show that voxels with up to 100% fat are activated, and therefore no upper limit should be placed on the BAT %fat range.
Methods
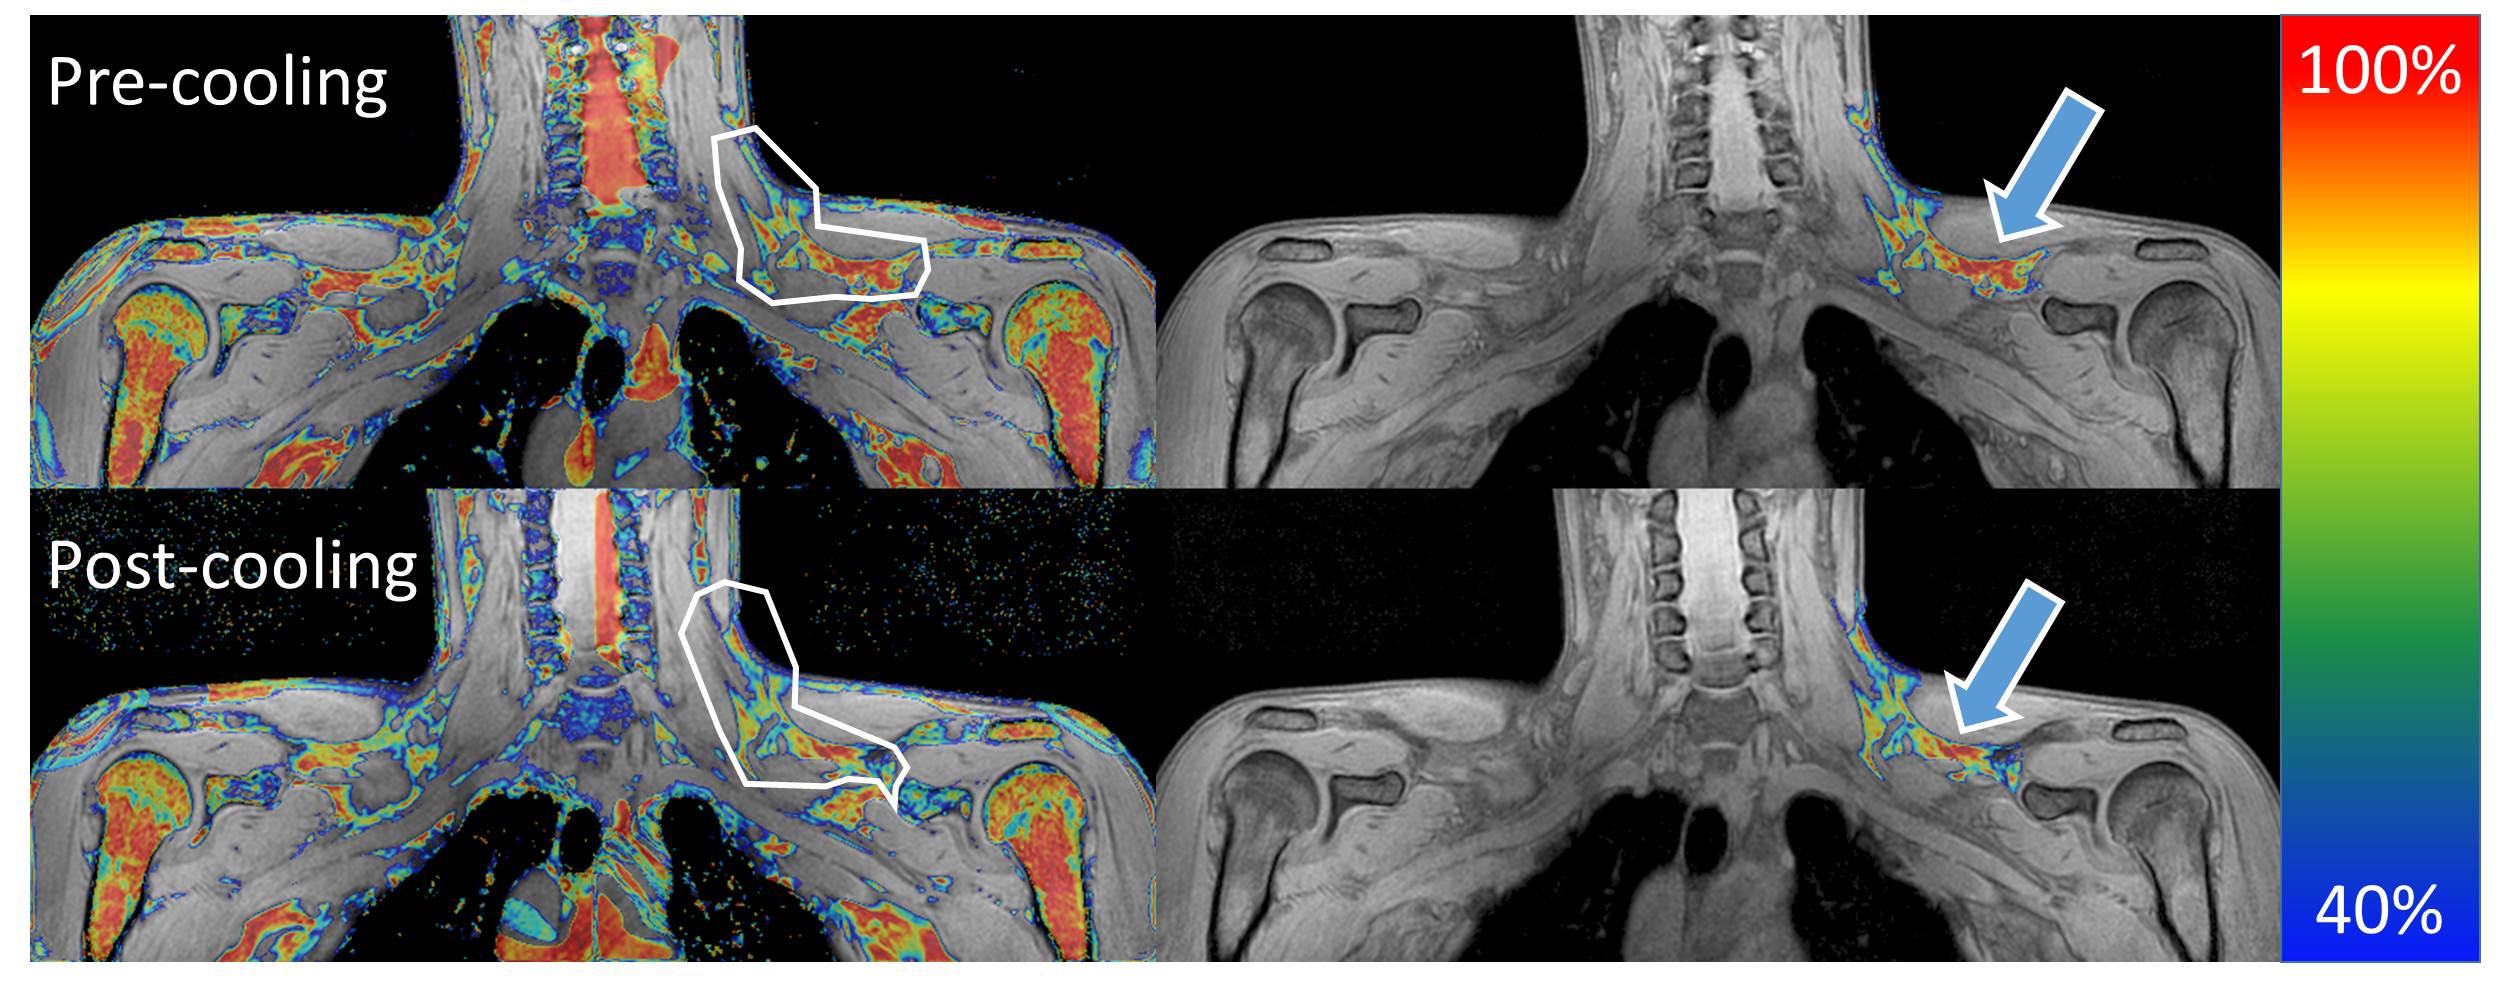
Six healthy, young (age 18-30y), lean (BMI 20-25) volunteers were scanned twice, before and directly after a two-hour cooling protocol enhancing BAT thermogenesis. Pre- and post-cooling scans were a 3D 6-point chemical-shift encoded gradient-echo acquisition using a 16-channel anterior array, 12-channel posterior array, and a posterior part of the 16-channel head and neck coil on a 3T scanner (Philips Ingenia): TR=15 ms, TE1 1.98 ms, ΔTE 1.75 ms, FA 8°, FOV 480mm x 300mm x 90mm (RL, FH, AP), 1.1 mm isotropic resolution, four signal averages. %fat maps were reconstructed off-line. Regions of interest (ROIs) were drawn manually around the left BAT repository (Figure 1). Semi-automated segmentation rejecting voxels below 40% fat was used to limit inter-analyser variability. %fat was used to calculate water and fat mass, and subsequently the total energy of the repository was estimated, assuming that 1µl of lipid equals 0.91 µg in mass, corresponding to 9.7 x 10⁻⁶ kcal. For lean mass the values were 1µl corresponding to 1.08 µg and 1 x 10⁻⁶ kcal. Energy expenditure and lean/fat mass change were assessed for different %fat. %fat, lean and fatty mass, and energy content were compared pre- and post-cooling using a t-test.Results
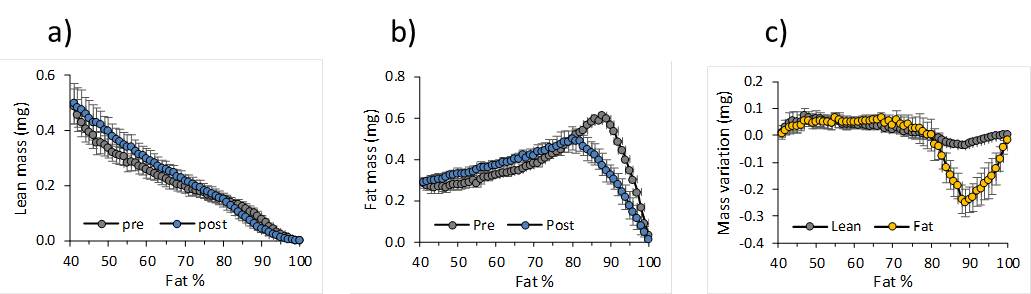
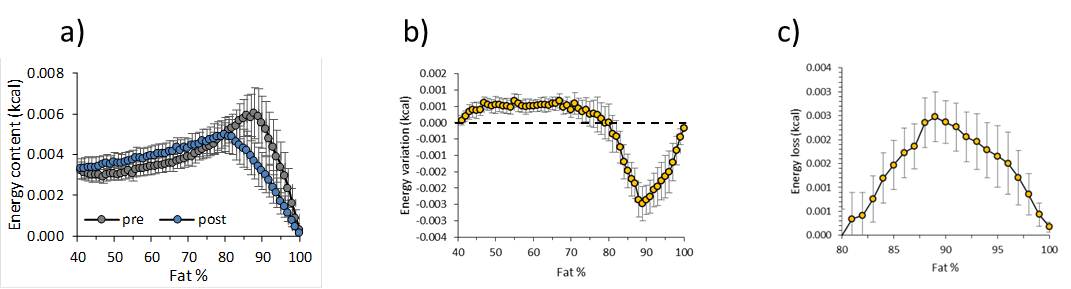
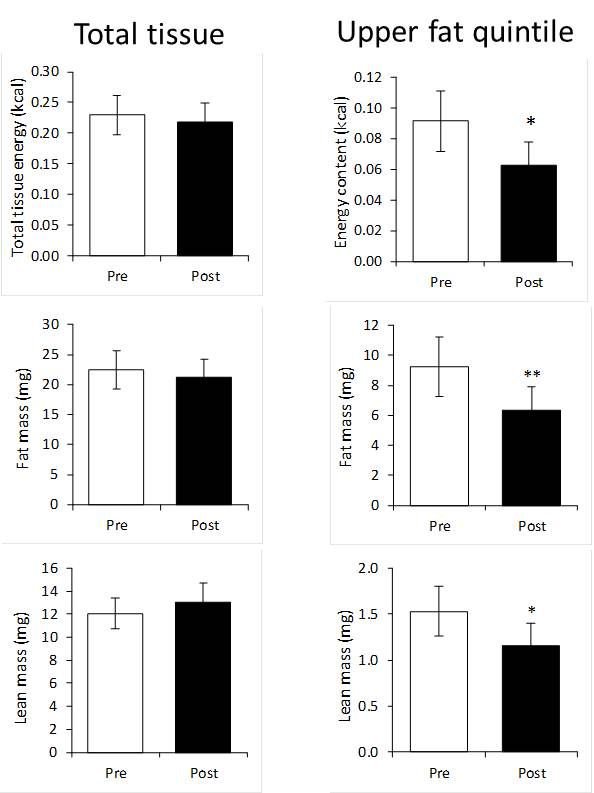
Mean lean and fatty tissue mass pre- and post- cooling at different %fat are shown in Figure 2; note the large mass changes in the 80%-100% range. This is reflected in the lower energy content, (Figure 3), particularly in the upper quantile (3c). Figure 4 illustrates how while pre-post cooling changes in the entire repository were similar, when the upper quantile of %fat is considered the total tissue energy, fat and lean mass change significantly (p<0.05). The total volume of the repository was on average only 1.2% lower after cooling. Mean %fat decreased by 2.95% ± 1.50%; in the upper quantile of %fat the mean dropped by 1.02% ± 0.45%.
Discussion
The proposed method allows calculating the fat and lean mass content separately in each voxel. Since there is little MR-invisible content in fatty tissue (11), MR fat and water signals can be converted to fat and lean volume and mass. This makes the method unbiased by partial voluming, since it is immaterial whether the fat-water content originates from intra-voxel heterogeneity or the lean-fat tissue interface. This approach has the additional advantage that mass and energy are absolute values, whereas %fat is a ratio. In Figure 3 the largest drop in energy content occurs in the upper quantile of %fat (80%-100%), even though the actual %fat drop in this range is only 1.02%, compared to 2.95% over the entire range. This is because both lean and fatty mass in this range decrease (Figure 2), however our data indicate that actually largest changes occur there. Figure 4 confirms this by demonstrating that analysing the upper quantile alone produces more significant results than the entire range.Conclusion
We present a novel approach to analysing water-fat BAT data, independent of the partial volume effect. We showed that most BAT activity-related changes take place in 80%-100% fat range, higher than proposed by previous literature. Therefore no upper limit should be placed on %fat of tissue considered to be active.Acknowledgements
No acknowledgement found.References
1. Lidell ME, Betz MJ, Enerbäck S. Brown adipose tissue and its therapeutic potential. J. Intern. Med. 2014;276:364–377. doi: 10.1111/joim.12255.
2. Sacks H, Symonds ME. Anatomical locations of human brown adipose tissue: functional relevance and implications in obesity and type 2 diabetes. Diabetes 2013;62:1783–90. doi: 10.2337/db12-1430.
3. Bakker LEH, Boon MR, van der Linden RAD, et al. Brown adipose tissue volume in healthy lean south Asian adults compared with white Caucasians: a prospective, case-controlled observational study. lancet. Diabetes Endocrinol. 2014;2:210–7. doi: 10.1016/S2213-8587(13)70156-6.
4. Franz D, Karampinos DC, Rummeny EJ, Souvatzoglou M, Beer AJ, Nekolla SG, Schwaiger M, Eiber M. Discrimination Between Brown and White Adipose Tissue Using a 2-Point Dixon Water-Fat Separation Method in Simultaneous PET/MRI. J. Nucl. Med. 2015;56:1742–7. doi: 10.2967/jnumed.115.160770.
5. Lundström E, Strand R, Johansson L, Bergsten P, Ahlström H, Kullberg J. Magnetic resonance imaging cooling-reheating protocol indicates decreased fat fraction via lipid consumption in suspected brown adipose tissue. PLoS One 2015;10:e0126705. doi: 10.1371/journal.pone.0126705.
6. Stahl V, Maier F, Freitag MT, et al. In vivo assessment of cold stimulation effects on the fat fraction of brown adipose tissue using DIXON MRI. J. Magn. Reson. Imaging 2016. doi: 10.1002/jmri.25364.
7. Gifford A, Towse TF, Walker RC, Avison MJ, Welch EB. Characterizing active and inactive brown adipose tissue in adult humans using PET-CT and MR imaging. Am. J. Physiol. - Endocrinol. Metab. 2016;311:E95–E104. doi: 10.1152/ajpendo.00482.2015.
8. Gifford A, Towse TF, Walker RC, Avison MJ, Welch EB. Human Brown Adipose Tissue Depots Automatically Segmented by Positron Emission Tomography/Computed Tomography and Registered Magnetic Resonance Images. J. Vis. Exp. 2015. doi: 10.3791/52415.
9. Deng J, Schoeneman SE, Zhang H, Kwon S, Rigsby CK, Shore RM, Josefson JL. MRI characterization of brown adipose tissue in obese and normal-weight children. Pediatr. Radiol. 2015;45:1682–1689. doi: 10.1007/s00247-015-3391-z.
10. Borga M, Virtanen KA, Romu T, Leinhard OD, Persson A, Nuutila P, Enerbäck S. Chapter Eight – Brown Adipose Tissue in Humans: Detection and Functional Analysis Using PET (Positron Emission Tomography), MRI (Magnetic Resonance Imaging), and DECT (Dual Energy Computed Tomography). In: Methods in Enzymology. Vol. 537. ; 2014. pp. 141–159. doi:10.1016/B978-0-12-411619-1.00008-2.
11. Hu HH, Li Y, Nagy TR, Goran MI, Nayak KS. Quantification of Absolute Fat Mass by Magnetic Resonance Imaging: a Validation Study against Chemical Analysis. Int. J. Body Compos. Res. 2011;9:111–122.
Figures