1227
Probing bone marrow adipocyte cell size in vivo at a clinical 3 T scanner using high b-value DW-MRS at long diffusion times1Department of Diagnostic and Interventional Radiology, Technical University Munich, Munich, Germany, 2Philips Healthcare, Hamburg, Germany, 3Department of Pathology, Technical University Munich, Munich, Germany, 4Else Kröner Fresenius Center for Nutritional Medicine, Technical University Munich, Munich, Germany
Synopsis
Despite its strong relevance in metabolism, non-invasive measurement of adipocyte size remains an unmet need. High b-value DW-MRS has been previously applied to probe diffusion restriction effects of intramyocellular lipids or brown adipocytes using preclinical systems with strong gradient systems. The present work proposes a methodology to in vivo probe diffusion restriction effects in bone marrow adipocytes with high b-value long diffusion time DW MRS in a clinical system and examines the feasibility of bone marrow adipocyte size estimation in the tibia of healthy subjects.
Purpose
Non-invasive measurement of adipocyte size has a wide range of applications in studies of obesity and metabolism1. The reduction of the apparent diffusion coefficient (ADC) with increasing diffusion times (Δ) due to diffusion restriction effects has been previously applied to extract cell size in vivo in water containing tissues2. Fat has two orders of magnitude lower diffusion coefficient than water, due to the large molecular size. The low diffusion coefficient and the spectral complexity constitute major challenges in the acquisition of diffusion-weighted (DW) MR measurements in fatty tissues. High b-value DW-MR spectroscopy (MRS) is a versatile tool to measure diffusion properties in fatty tissues, accounting for the spectral complexity3. High b-value DW-MRS was recently applied to quantify the intramyocellular lipid (IMCL) droplet size by analyzing the ADC dependence on Δ4. However, IMCLs have a diameter of the order of 1 µm, whereas white adipocytes have typically diameters between 50 and 150 µm. Therefore, the sensitization of diffusion restriction effects in white adipocytes requires long Δ. Diffusion restriction effects have been recently reported in brown adipocytes ex vivo with a strong preclinical gradient system5. However, probing diffusion restriction effects of adipocytes in vivo at a clinical scanner remains a major technical challenge due to the need for high b-value long Δ DW-MRS. The present work proposes a methodology to probe diffusion restriction effects in bone marrow (BM) adipocytes in vivo with DW MRS in a clinical system and estimates the BM adipocyte size within the tibia of healthy subjects.Methods
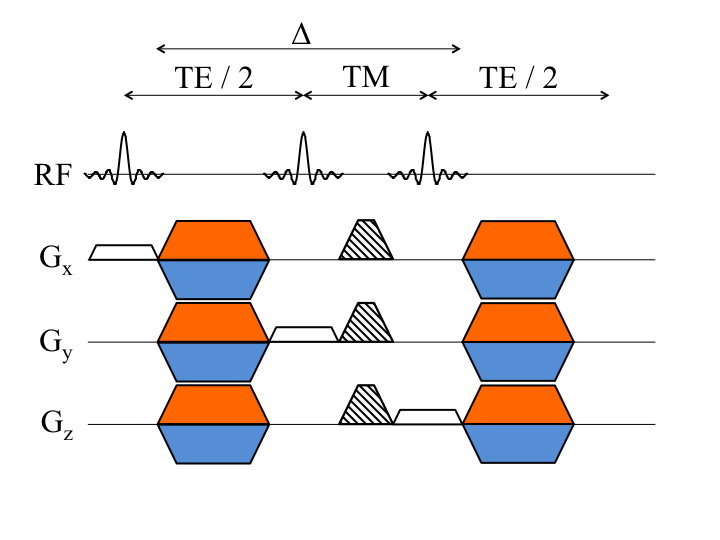
Pulse sequence:
The employed DW MRS sequence (Fig. 1) was based on a standard STEAM sequence with additional gradients after the first and third RF pulse to induce diffusion weighting6. The mixing time was increased while keeping the b-value constant to achieve the same diffusion weighting at different Δ.
In vivo measurements:
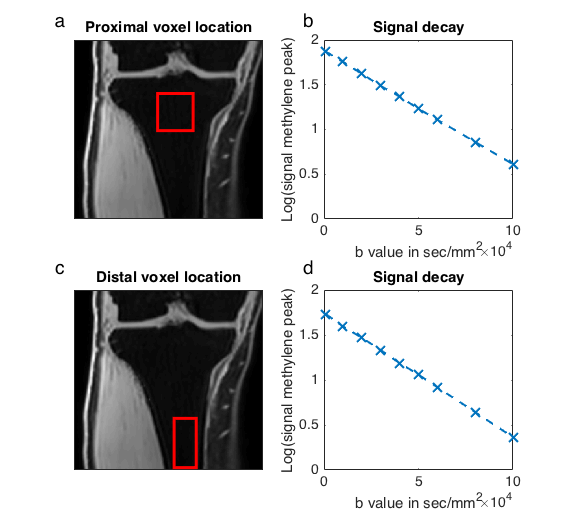
The tibia of 4 healthy volunteers (30.3±3.3 years old) was scanned at two locations (promximal and distal location in Figs. 2a and c) with a 3T system (Ingenia, Philips Healthcare) and an 8 channel extrimity coil. In both scanned locations (Figs. 2b and 2d) a mono-exponential decay of the methylene peak (at 1.3ppm) was observed and therefore only two b-values for each mixing time were acquired in the volunteer study to estimate ADC. The sequence parameters were TE=58ms, TR=2000ms, TM=300ms to 1100ms in 100ms steps, BW=5000Hz, 4096 samples, 16 averages, scan time=10:12min, VOI(proximal location)=17x17x19mm3, VOI(distal location)=12x12x25mm3 and b-values of 1,000 and 65,000mm2/s.
Analysis of MRS data:
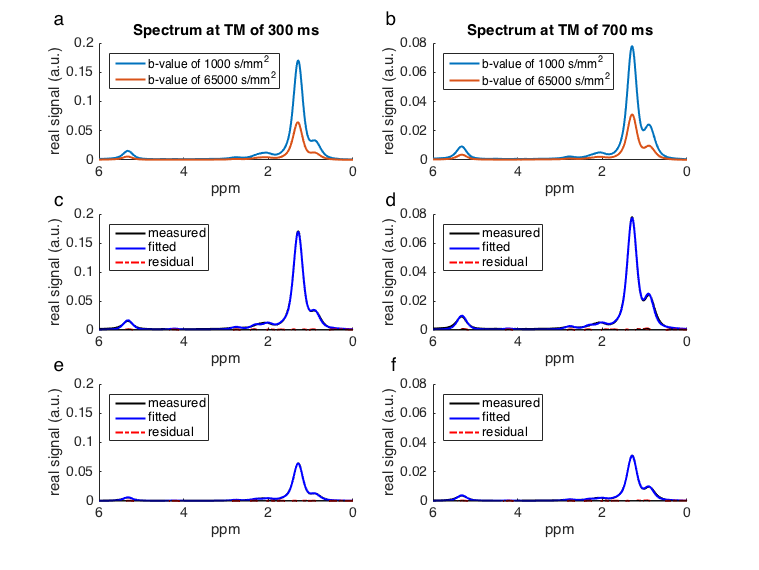
The pre-processing
of the spectra included zero order phasing and gaussian apodization. The single
averages were frequency alligned and eddy current corrected before averaging. Peak
area quantification (Fig. 3) was performed considering eight fat peaks6. Due
to the high diffusion-weighting no water peak was present. The methylene peak area
was used in the cell size estimation.
At every Δ the
ADC was estimated based on the signal at the two b-values. Assuming isotropic
diffusion for the fat and that the only source of fat diffusion restriction is
a spherically shaped adipocyte membrane, the dependence of the ADC on Δ at the
short time scale regime can be described7:
$$ ADC(\Delta)=D_{free}-\frac{8}{3\cdot\sqrt{\pi}\cdot d}\cdot D_{free}\cdot\sqrt{D_{free}\cdot\Delta}+O\left(D_{free}\cdot\Delta\right) \qquad (1) $$
where Dfree
is the free diffusion constant (without restriction effects) and d is the
adipocyte diameter. The acquired data were fitted to Eq. (1) to estimate Dfree
and d per subject and location.
Results
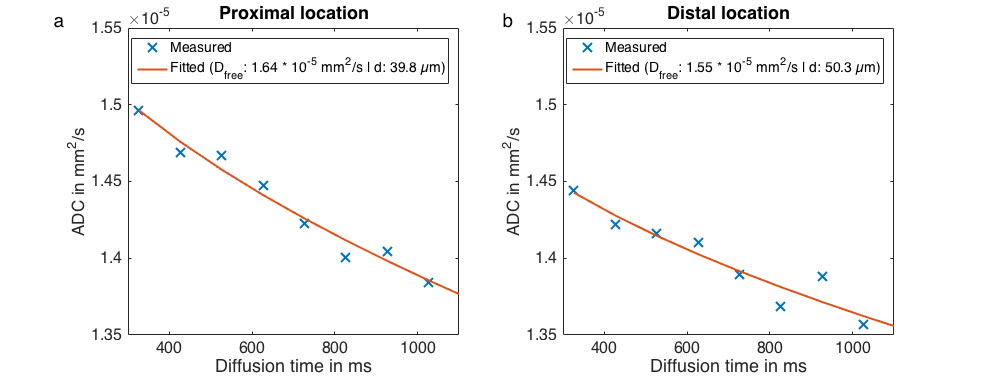
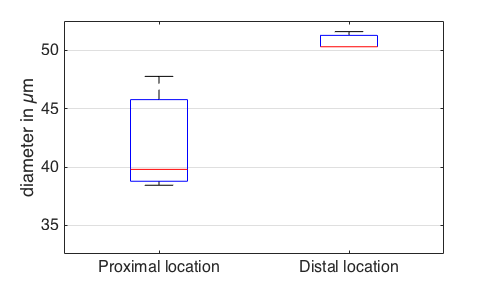
Fig. 3 shows the increased attenuation of the fat peaks with increasing diffusion weighting and the good quality of the peak fitting. Fig. 4 shows the decay of the ADC with Δ and the corresponding fitting results in one representative subject. The estimated adipocyte diameter was significanly lower (p < 10-4) at the proximal location (39.9±5.8µm) than at the distal location (51.9±2.4µm) (Fig. 5). Dfree was also significanly lower (p=0.005) at the proximal location (1.55±0.10 x 10⁻⁵ mm2/s) than at the distal location (1.63±0.10 x 10⁻⁵ mm2/s).Discussion & Conclusion
The presented methodology was able to probe marrow adipocyte diffusion restriction effects in vivo at a clinical field strength using long Δ high b-value DW-MRS and to estimate adipocyte size using the short time scale regime formula. Further validation of the MR-based adipocyte size estimates with ex vivo measurements like microscopy is necessary. BM adipocytes have a diameter of around 60 µm8 and recent findings indicate that BM adipocyte size increases from proximal to distal locations9. Therefore, the presently extracted adipocyte size is consistent with the literature and the observed differences along the axis of the tibia are in agreement with recent reports.Acknowledgements
The present work was supported by the European Research Council (grant agreement No 677661, ProFatMRI) and Philips Healthcare.References
1. Skurk T., Alberti-Huber C., Herder C. and Hans Hauner. Relationship between Adipocyte Size and Adipokine Expression and Secretion. The Journal of Clinical Endocrinology & Metabolism 2007; 92(3): 1023-1033
2. Assaf Y, Blumenfeld-Katzir T, et al. AxCaliber: a method for measuring axon diameter distribution from diffusion MRI. Magn Reson Med. 2008; 59:1347–1354
3. Lehnert A, Machann J, Helms G, Claussen CD, Schick F. Diffusion characteristics of large molecules assessed by proton MRS on a whole-body MR system. Magn Reson Imag. 2004;22:39–46
4. Cao, P., Fan, S.-J., Wang, A. M., Xie, V. B., Qiao, Z., Brittenham, G. M. and Wu, E. X., Diffusion magnetic resonance monitors intramyocellular lipid droplet size in vivo. Magn Reson Med. 2015,73: 59–69
5. Verma S.,Lee K., Xianfeng T., Yaligar J., Gopalan V., Prakash B. and Velan S. , Proc. ISMRM 2016, p. 1055
6. Ruschke, S., Kienberger, H., Baum, T., Kooijman, H., Settles, M., Haase, A., Rychlik, M., Rummeny, E. J. and Karampinos, D. C., Diffusion-weighted stimulated echo acquisition mode (DW-STEAM) MR spectroscopy to measure fat unsaturation in regions with low proton-density fat fraction. Magn. Reson. Med. 2016, 75: 32–41
7. Mitra P., Sen P. and Schwartz L., Short-time behavior of the diffusion coefficient as a geometrical probe of porous media. Phys. Rev. B 1993, 47: 8565
8. Rozman C., Reverter JC., Feliu E., et al. Variations of fat tissue fractions in abnormal human bone marrow depend both on size and number of adipocytes: a stereo logic study. Blood. 1990; 76: 892-895
9. Scheller EL, Doucette CR, Learman BS, et al. Region-specific variation in the properties of skeletal adipocytes reveals regulated and constitutive marrow adipose tissues. Nature Communications. 2015;6:7808.
Figures