1216
Quantitative Susceptibility Mapping from Unsuppressed Water Signals in 1H-MRSI Data1Shenzhen Institutes of Advanced Technology, Shenzhen, People's Republic of China, 2Beckman Institute for Advanced Science and Technology, University of Illinois Urbana-Champaign, Urbana, IL, United States, 3Department of Electrical and Computer Engineering, University of Illinois Urbana-Champaign, Urbana, IL, United States
Synopsis
This work presents a new method to extract QSM from the unsuppressed water signals in 1H-MRSI data and enables simultaneous MRSI and QSM in a single acquisition. The proposed method builds on the recently proposed subspace imaging method called SPICE (SPectroscopicImaging by exploiting spatiospectral CorrElation), which allows MRSI acquisition without water suppression, thus encoding susceptibility induced phase variations in the water spectroscopic signals. Parallel imaging, subspace-based modeling and constrained reconstruction are integrated to generate QSM and high-resolution MRSI reconstruction from such data. In-vivo experiment results demonstrate the capability of proposed method in producing susceptibility map along with metabolite spatiospectral distributions from a single 6-minute scan.
INTRODUCTION
MRSI is a unique tool for studying tissue metabolism [1], while QSM is useful for mapping tissue magnetic susceptibility, an intrinsic property that has been used for diagnosing diseases [2]. These two imaging techniques provide complementary information useful in many research and clinical applications, but require two separate scans in current practices. In this work, we present a new method called SPICEyQSM, building on the recently proposed subspace imaging method SPICE (SPectroscopic Imaging by exploiting spatiospectral CorrElation) [3,4], to extract QSM from the unsuppressed water signals in high resolution 1H-MRSI data. This enables simultaneous MRSI and QSM in a single scan.METHOD
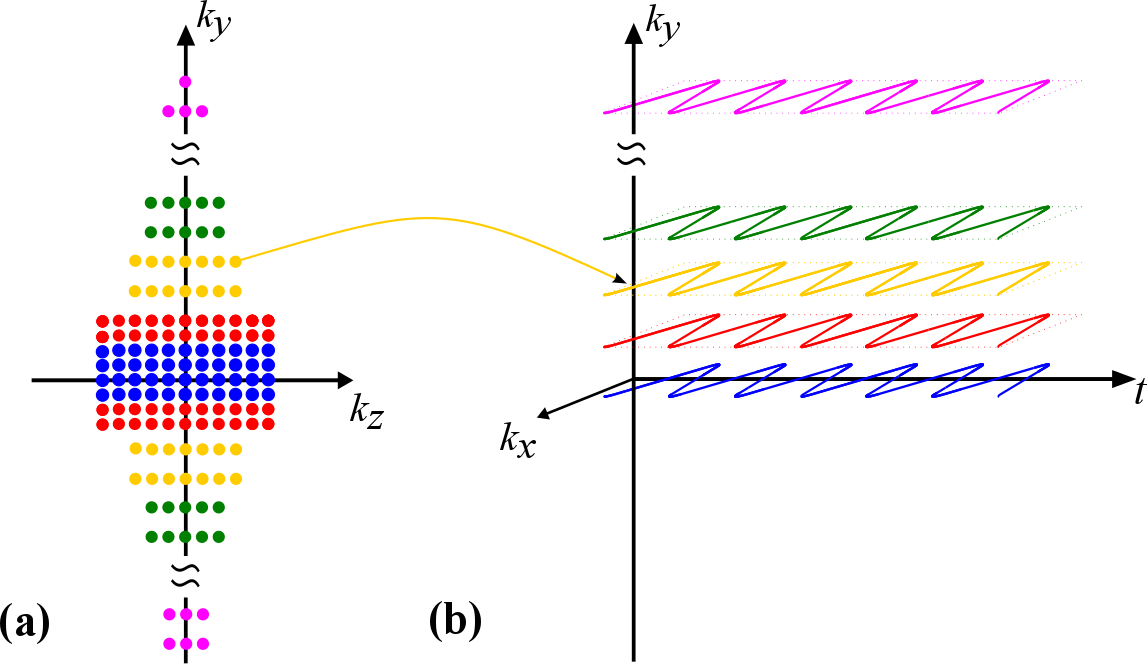
1) Data Acquisition: Conventional MRSI acquisitions typically require water suppression, long TR, and medium TE due to various technical limitations. SPICE, however enables rapid high-resolution MRSI using ultra short-TE, short-TR acquisitions [5] without water and fat suppression thus presenting a new opportunity for simultaneous MRSI and QSM. Figure 1 illustrates the acquisition scheme tailored for the proposed method. To achieve higher resolution along the phase encoding directions (e.g., ky, kz), a variable-density/parallel-imaging-based sparse sampling scheme is designed (Fig. 1a). Ramp sampling is also used to improve resolution along kx.
2) Constrained reconstruction: The proposed acquisition allows for an effective usage of parallel imaging reconstruction. Specifically, the auto calibration data in the central k-space of the early echoes are used for an initial GRAPPA reconstruction (i.e., a "sliding window" scheme is employed to take advantage of neighboring echoes for improved kernel calculation). The GRAPPA reconstructions at these echoes are then used to derive a high-SNR sensitivity map [6], with which a constrained reconstruction can be performed by integrating SENSE, sparsity and a rank constraint [7]. We note that due to various factors impacting the SNR for MRSI (e.g., readout BW, spectral BW, number of echoes), the resolution of our acquisition is still limited compared to conventional QSM scans in a 5-6 min period. Thus, this constrained reconstruction is helpful in further improving the resolution/SNR tradeoff for the proposed method.
3) QSM reconstruction: The total field inhomogeneity is estimated from the phase of the reconstructed water images using a complex fitting procedure. With proper phase unwrapping [8], the background field from external sources out of the ROI is removed [9] and tissue susceptibility is reconstructed using morphology enabled dipole inversion [10].
4) MRSI reconstruction: The SPICE reconstruction described in [4] was used to obtain metabolite spatiospectral distributions from the same data. A training dataset with limited k-space coverage but higher spectral BW is obtained to determine the temporal bases of metabolites for high-SNR reconstruction. The water and fat signals were removed using the method in [11].
RESULTS AND DISCUSSION
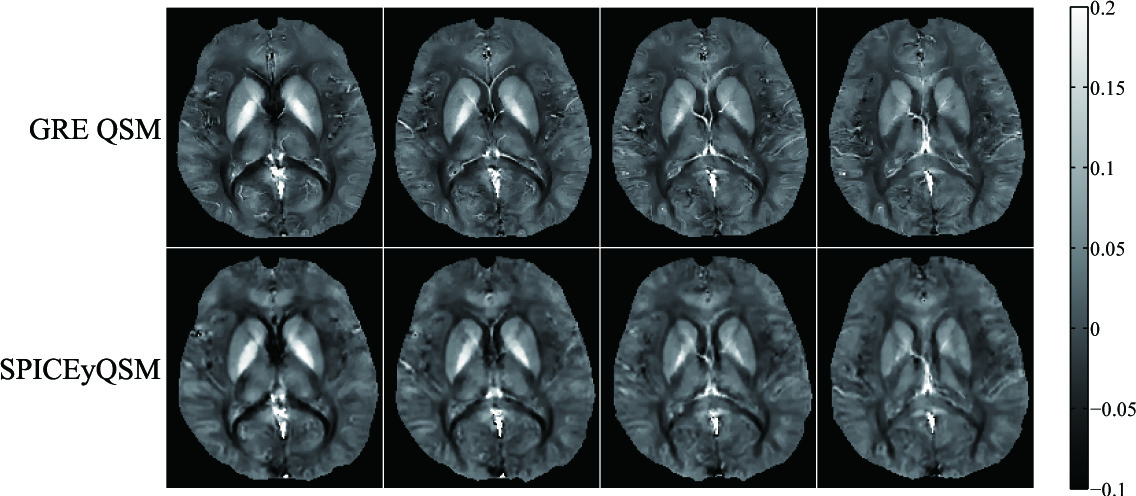
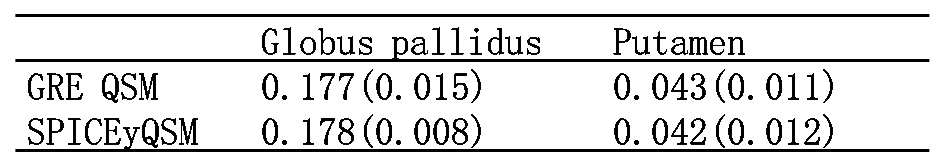
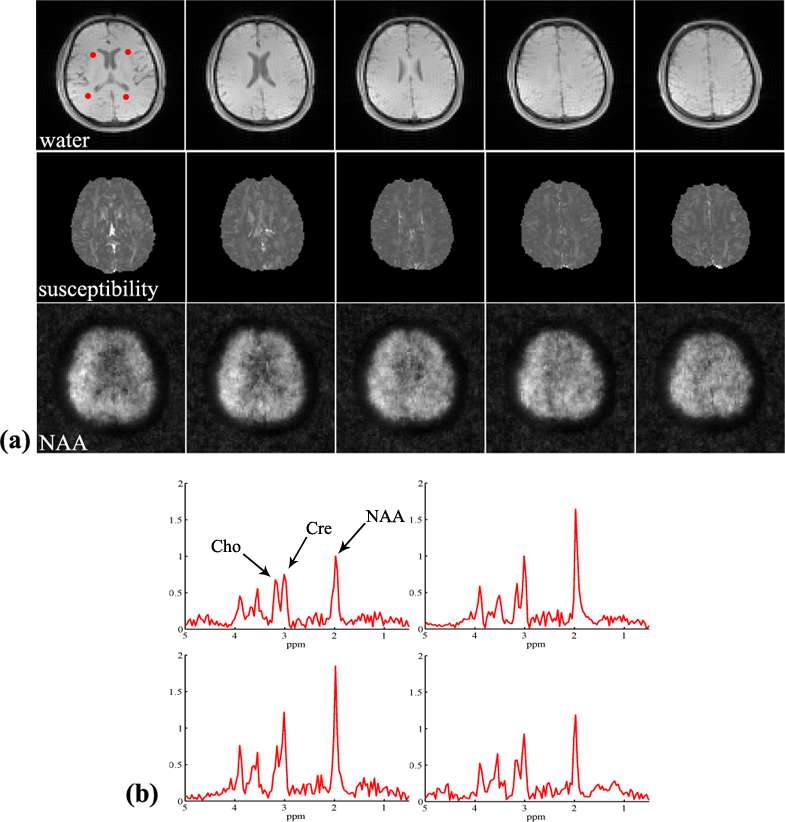
Proton MRSI data without water suppression were collected from a healthy volunteer on a 3T Siemens scanner with IRB approval using a 12-channel head coil. The data were acquired using an FID-EPSI sequence (TR 210ms, TE 4ms, flip angle 31 degree, # of spectral encodings 92, echo spacing 1.78ms, BW 167kHz, FOV 230×230×72mm3). A total of 120×124×24 spatial encodings were generated in a 6-min scan. To validate the susceptibility maps from SPICEyQSM, a 3D multi-echo gradient-echo dataset was acquired over the same volume position with matrix size 256×256×24 (resolution 0.9×0.9×3mm3, flip angle 20 degree, TR 40ms, TE 4.55ms, echo spacing 3.65ms, # of echoes 8). Susceptibility maps generated from both datasets were compared in Fig. 2 and Table 1. The proposed method provides comparable susceptibility maps and regional values in selected deep gray matter regions. The metabolites reconstructed at 3×3×3mm3 resolution are shown in Fig 3. with clearly identified regions (e.g., ventricle) and high quality spectra (Fig. 3c). The corresponding susceptibility maps are shown alongside the metabolite reconstruction, demonstrating the powerful capability of the proposed technique for simultaneous metabolic imaging and susceptibility mapping.CONCLUSION
A new technique for extracting QSM from the unsuppressed water signals in 1H-MRSI data is proposed. The technique integrates parallel imaging, subspace-based modeling and constrained reconstruction to provide a new capability to obtain QSM and high-resolution MRSI results from a single MRSI scan. Future work may include further increasing the resolution of QSM by extending k-space coverage using sparser sampling and slice-direction acceleration.Acknowledgements
We would like to acknowledge NIH-R21-EB021013-01, NIH-1R01-EB013695, NSFC-61671441, NSFC-81120108012.References
[1] de Graaf RA. In Vivo NMR Spectroscopy: Principles and Techniques, 2nd Edition. 2007 John Wiley & Sons, Ltd.
[2] Wang Y, Liu T. Quantitative Susceptibility Mapping (QSM): Decoding MRI Data for a Tissue Magnetic Biomarker. Magn Reson Med 73: 82-101.
[3] Lam F, Liang Z-P. A subspace approach to high-resolution spectroscopic imaging. Magn Reson Med 71: 1349–1357.
[4]Lam F, Ma C, Clifford B, Johnson CL, Liang Z-P. High-resolution 1H-MRSI of the brain using SPICE: Data acquisition and image reconstruction. Magn Reson Med 76: 1059–1070.
[5] Sheikh M, Lam F, Ma C, Clifford B, Liang Z-P. Rapid, High-Resolution 3D 1H-MRSI of the Brain Based on FID Acquisitions. ISMRM 2016. p2353.
[6] Walsh DO, Gmitro AF, Marcellin MW. Adaptive reconstruction of phased array MR imagery. Magn Reson Med 43: 682–690.
[7] Zhao B, Haldar JP, Christodoulou AG, Liang ZP. Image reconstruction from highly undersampled (k, t)-space data with joint partial separability and sparsity constraints. IEEE Transactions on Medical Imaging 31: 1809-1820.
[8] Schofield MA, Zhu Y. Fast phase unwrapping algorithm for interferometric applications. Opt Lett 28: 1194-196.
[9] Zhou D, Liu T, Spincemaille P, Wang Y. Background field removal by solving the Laplacian boundary value problem. NMR Biomed 27: 312–319.
[10] Liu J, Liu T, de Rochefort L, Ledoux J, Khalidov I, Chen W, Tsiouris AJ, Wisnieff C, Spincemaille P, Prince MR, Wang Y. Morphology enabled dipole inversion for quantitative susceptibility mapping using structural consistency between the magnitude image and the susceptibility map. Neuroimage 59: 2560-2568.
[11] Ma C, Lam F, Johnson CL, Liang ZP. Removal of nuisance signals from limited and sparse 1H MRSI data using a union-of-subspaces model. Magn Reson Med 75: 488–497.
Figures