1215
An interleaved sequence for simultaneous MRA, SWI and QSM1Sino-Dutch Biomedical and Information Engineering School, Northeastern University, Shenyang, People's Republic of China, 2Department of Radiology, Wayne State University, Detroit, MI, United States, 3The MRI Institute for Biomedical Research, Waterloo, ON, Canada, 4The MRI Institute for Biomedical Research, Detroit, United States
Synopsis
MRA, SWI and QSM are important for identifying thrombus, hemorrhage, CMBs and assessing oxygen saturation and iron deposition in diseases such as stroke and traumatic brain injury (TBI). Practically, it is important to acquire these data with sufficient resolution, good SNR, co-registered and rapidly. Therefore, we developed a 3D interleaved GRE sequence that produces MRA, SWI, R2* and QSM for imaging arteries, veins and the basal ganglia in 4 minutes at 3T for the entire brain with a resolution of 0.67x1.33x2.0mm3. Five healthy volunteers’ data were acquired approved by the local IRB to demonstrate the utility of this approach.
PURPOSE
MRA, SWI and QSM are playing a major role in identifying thrombus, hemorrhage and cerebral microbleeds (CMBs) and assessing oxygen saturation and iron deposition in diseases such as stroke and traumatic brain injury.1-5 Practically, it is important to acquire these data with sufficient resolution, good SNR, co-registered and rapidly. However, these images were commonly acquired separately, which leads to misregistration and long scanning time. Therefore, we developed a 3D interleaved GRE sequence that produces co-registered MRA, SWI, R2* and QSM for imaging arteries, veins and basal ganglia in 4 minutes at 3T for the entire brain with a resolution of 0.67x1.33x2.0mm3. Especially, the MRA showed small arteries very well and the QSM was optimized for both veins and basal ganglia.METHODS
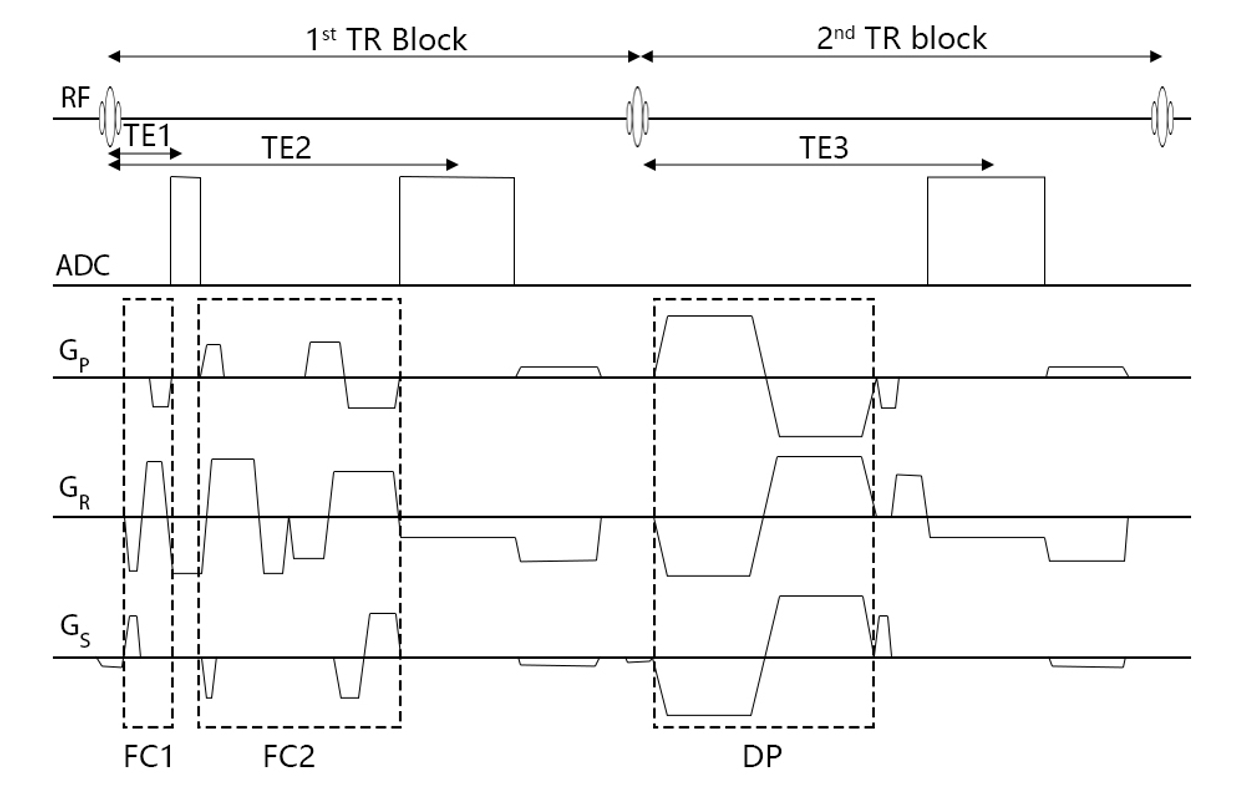
Sequence Design. We developed a fully flow compensation GRE sequence using dynamic calculated gradients for first-order moment nulling on all three directions6, unlike the fly-back gradient in the readout direction which was commonly used in the magnetic resonance angiography and venography (MRAV) multi-echo sequence5. There are two echoes in the first TR block and one echo in the second TR block (Figure 1), acquired in an interleaved manner1. The two echoes in first TR were designed to be set with different flow compensation strategies, sampling bandwidth and asymmetric ratio respectively, which make the first echo possible to the shortest in-phase time at 3T without adding additional scanning time. The flow-dephased echo was implemented by bipolar velocity encoding (VENC) gradients on each direction.
Data acquisition. Five healthy volunteers were scanned on a Siemens 3T Verio system with a product 32-channel head coil. Imaging parameters were: TR=20ms, FA=9o, TE1/TE2/TE3=2.5/12.5/12.5ms, BW1/BW2/BW3=650/240/240 Hz/pixel, voxel size=0.67x1.33x2.0mm3, 64 transversal slices, GRAPPA acceleration factor of 2, and TA=3:59. The VENC gradient amplitude was 24mT/m and duration was 3.5ms, which lead to a VENC value about 1.84cm/s to dephase both arteries and veins. Flow compensation was set to readout direction only on the first echo and 20% sampling points before the echo center asymmetrically that made the 2.5ms echo time possible. The second echo was fully flow compensated for SWI and QSM.
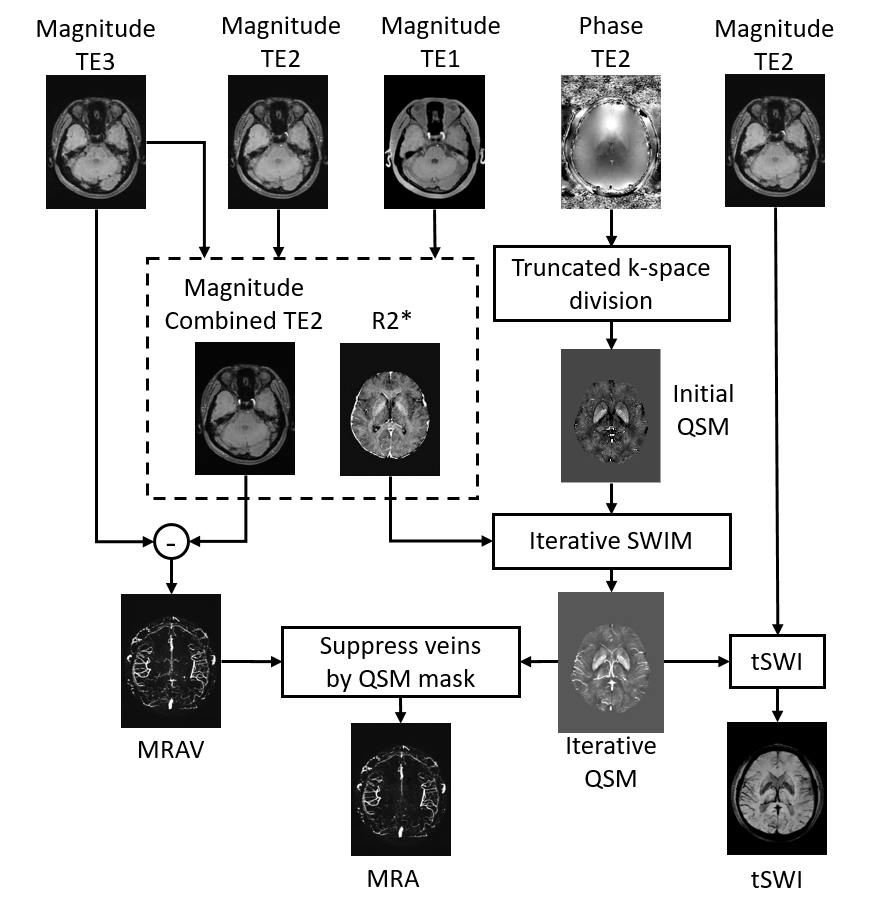
Data processing. R2*: R2*map was generated using the two echoes in first TR. QSM: For QSM reconstruction, an initial susceptibility map was created using truncated k-space division. Then a weighting mask was created using R2* maps and was multiplied to the initial susceptibility map to enhance the contrast for veins and grey matter structures and to better extract their geometries. Next, updated QSM was generated using the initial QSM together with the extracted geometry, using the iterative SWIM algorithm7. tSWI: The final QSM map was used together with the magnitude image at the longer TE to create true-SWI image8. MRA: The subtraction of two echoes that had identical imaging conditions but the phase preparations gave a MRAV image denoting flowing spins. A non-linear subtraction between the short echo of 2.5ms and the MRAV was used to generate an arteries mask for large arteries. We used the arteries mask to MIP the large arteries between the two echoes in the first TR block, thus a new MRAV was generated without signal loss on those large arteries with fast flow and nearby the air/tissue interface. Finally, the QSM mask that denoting veins was used to suppress veins on the new MRAV image to generate a MRA image. An overview of the data processing steps is shown in Figure 2.
RESULTS
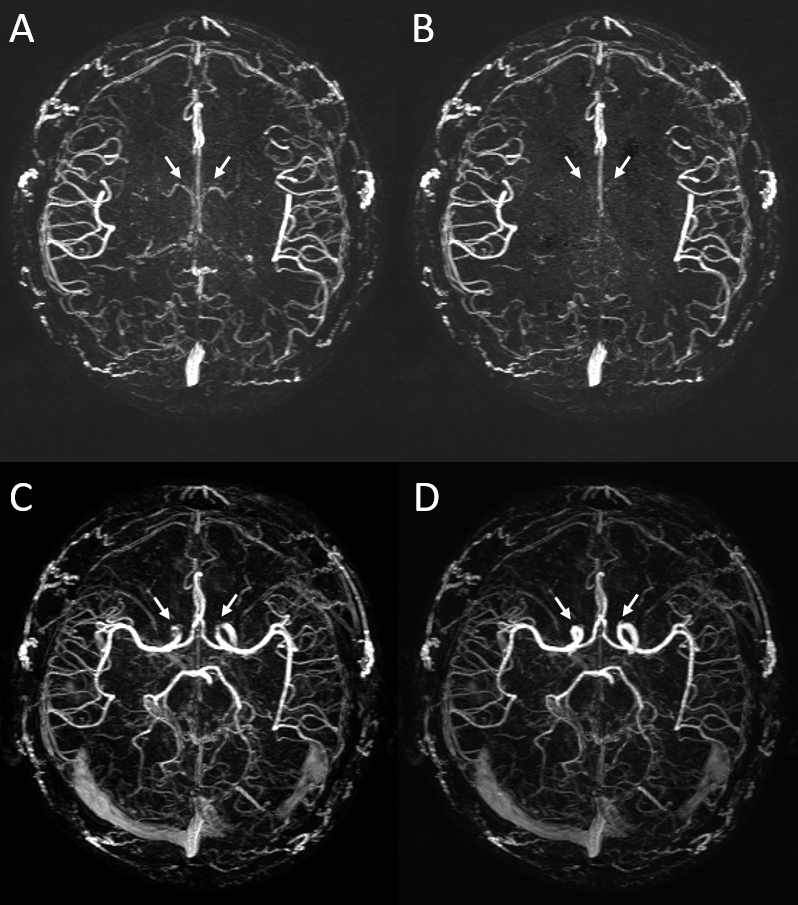
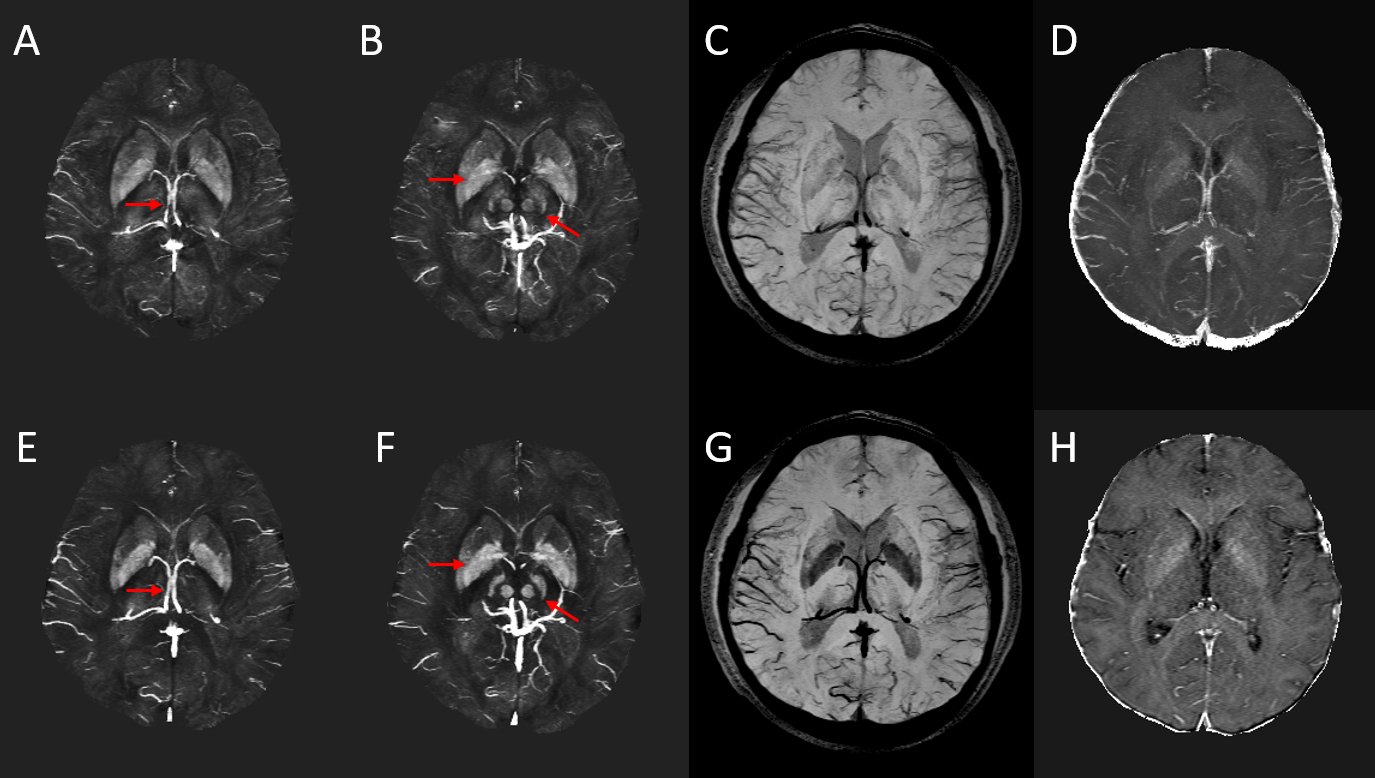
The MRAV showed both arteries and veins with particular visualization of small arteries and definitely clear background from stationary tissues (Figure 3). On the MRA, veins were suppressed using QSM mask. Signal loss on large arteries with fast flow and turbulence were retrieved using the short echo. The optimized QSM showed better visualization and accuracy on veins and basal ganglia than conventional QSM (Figure 4). tSWI demonstrated that we may not need a longer echo for SWI. Even 12.5ms worked well for veins and high susceptibility lesions such as microbleeds and hemorrhage.DISCUSSION AND CONCLUSIONS
This practical sequence opens the door to producing these co-registered images in a single scan for studying vasculature related diseases such as stroke and TBI. The veins can be easily separated from arteries using MRA, tSWI and QSM, for the entire brain. In addition, it can be run with any resolution matching the clinical imaging requirements. Although the MRA still has venous contamination from the venous sinuses they will be possible to remove in the future using the QSM processing and at the moment they are easily identified by the radiologist.Acknowledgements
No acknowledgement found.References
1. Ye Y, Hu J, Wu D, Haacke EM. Noncontrast-enhanced magnetic resonance angiography and venography imaging with enhanced angiography. J Magn Reson Imaging. 2013;38(6):1539-48.2. Haacke EM, Liu S, Bush S, et al. Quantitative susceptibility mapping: current status and future directions. Magn Reson Imaging. 2015;33(1):1-25.
3. Liu S, Bush S, Chen Y, et al. Susceptibility-weighted imaging: current status and future directions. NMR in Biomedicine. 2016.
4. Rastogi R, Ding Y, Xia S, et al. Recent advances in magnetic resonance imaging for stroke diagnosis. Brain Circulation. 2015;1(1):26.
5. Du YP, Jin Z. Simultaneous acquisition of MR angiography and venography (MRAV). Magnetic resonance in medicine. 2008;59(5):954-8.
6. Wu D, Liu S, Bush S, et al. A fully flow-compensated multiecho susceptibility-weighted imaging sequence: The effects of acceleration and background field on flow compensation. Magn Reson Med. 2016;76(2):478-89.
7. Tang J, Liu S, Neelavalli J, et al. Improving susceptibility mapping using a threshold-based K-space/image domain iterative reconstruction approach. Magn Reson Med. 2013;69(5):1396-407.
8. Liu S, Mok K, Neelavalli J, et al. Improved MR venography using quantitative susceptibility-weighted imaging. J Magn Reson Imaging. 2014;40(3):698-708.
Figures