1214
Nuclear susceptibility shift1Biomedical Engineering, Sungkyunkwan University, Suwon, Korea, Republic of, 2Center for Neuroscience Imaging Research (CNIR), Institute for Basic Science, Suwon, Korea, Republic of
Synopsis
We have observed in a clinical scanner that the center frequency of water MRI changed with the 1H spin flip angle. The amount of the change could be explained by the tip-angle dependent nuclear spin paramagnetic susceptibility, much the same way as the usual, tissue electronic para- and dia-magnetic susceptibility induces B0 shift in MRI. The observed shift, corresponding to nuclear susceptibility of +0.004 ppm in water, may affect the ultimate accuracy of MR-based tissue magnetic susceptibility measurements if not properly accounted for.
Introduction
Thermal equilibrium alignment of nuclear spins with the applied static magnetic field B0 is the first step in conventional NMR and MRI signal generation1. For 1H in water this corresponds to the nuclear spin paramagnetic susceptibility χnucleq =μ0Mzeq/B0 = μ0μp2ρn/kBT = 3.89 x 10⁻⁹ ≈ 4ppb, at T=37°C. (Mzeq is the longitudinal magnetization at equilibrium, μ0 is the vacuum permeability, μp is the proton magnetic moment, kB is the Boltzmann’s constant, and ρn is the 1H spin density.) Because of its small magnitude, direct detection of longitudinal magnetization of nuclear spins (“longitudinal NMR”) usually requires sensitive magnetometers such as a SQUID2,3. Here we show that nuclear susceptibility in fact makes a measurable shift in the MRI center frequency in a clinical scanner, and discuss its implications for MR-based quantitative susceptibility measurements.Theory
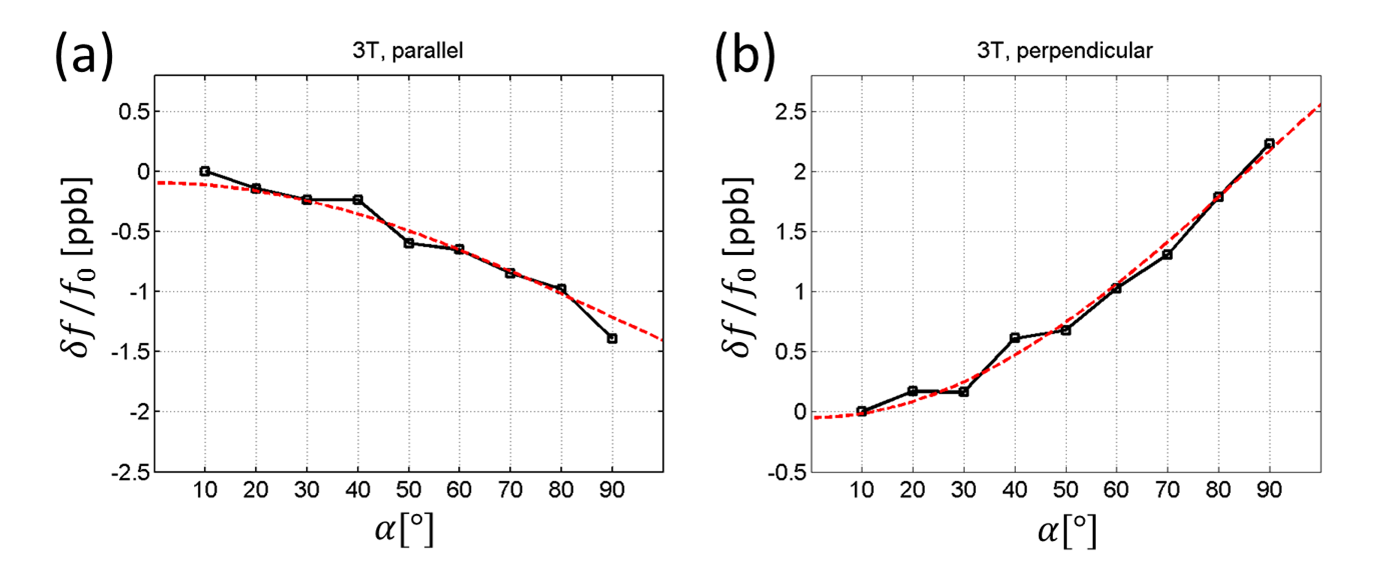
In a sequence with the repetition time (TR) much longer than T1, the 1H longitudinal magnetization immediately after the excitation is Mzeq cosα where α is the tip-angle. This gives rise to the tip-angle dependent nuclear paramagnetic susceptibility χnucl= χnucleq cosα. The total tissue susceptibility is the sum of this and the electronic contribution, χtissue=χnucl+χelec where χelec≈ -9 ppm. Through χnucl, the tissue susceptibility in principle varies during and among MRI scans. χnucl gives rise to nuclear longitudinal polarization-dependent MR frequency shift, which we will call nuclear susceptibility shift (NSS). Similar to conventional susceptibility-induced B0 inhomogeneity, NSS depends on the shape of the susceptibility boundary. For example, inside a thin slab with uniform susceptibility χnucl, the induced magnetic field is given by4 $$\delta B_{0,paral}=(1/3) B_0 \chi_{nucl} = (1/3) B_0 \chi_{nucl}^{eq} \cos\alpha \,\,\,\,\,\,\,\,\,\,(1)$$ when the slab’s face is parallel to B0, but it is $$\delta B_{0,perp}=-(2/3) B_0 \chi_{nucl} = -(2/3) B_0 \chi_{nucl}^{eq} \cos\alpha \,\,\,\,\,\,\,(2)$$ when the face is perpendicular to B0. Eqs.(1,2) include the Lorentz sphere effect5. NSS can be experimentally isolated from the bulk electronic susceptibility effect through tip-angle modulation.Methods
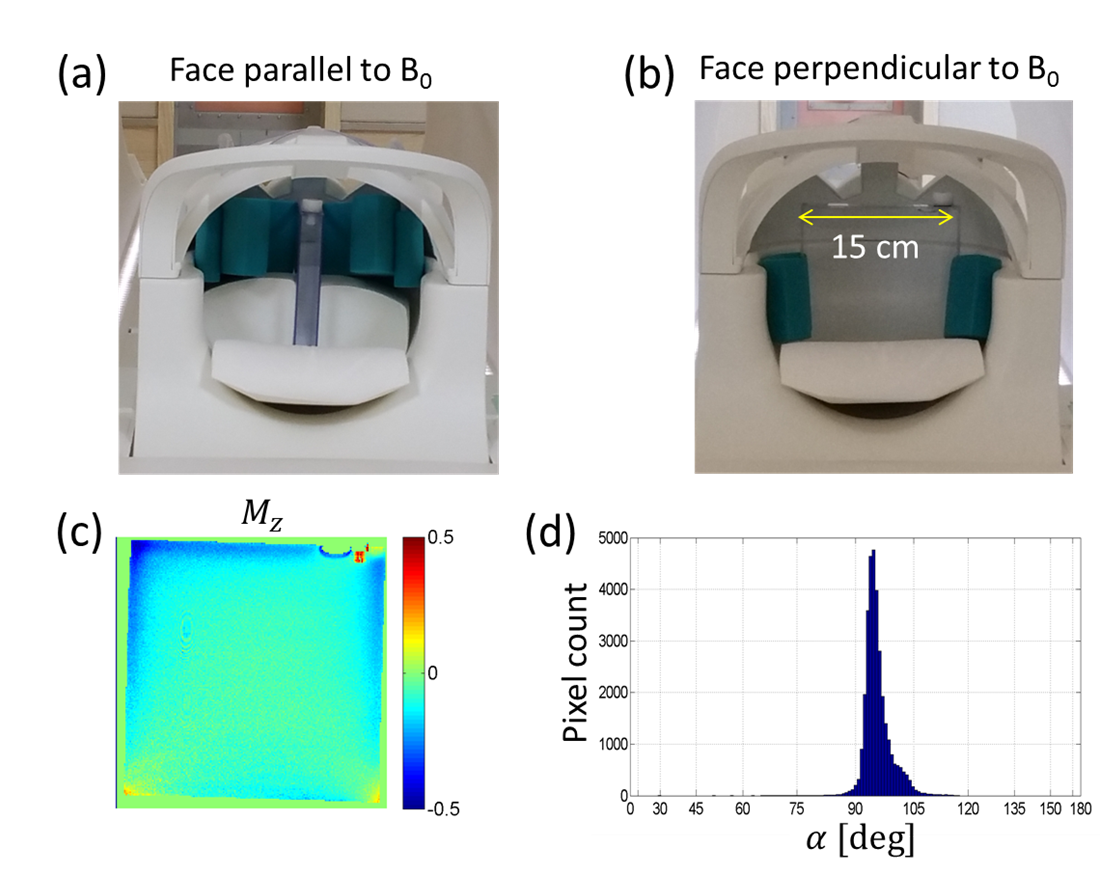
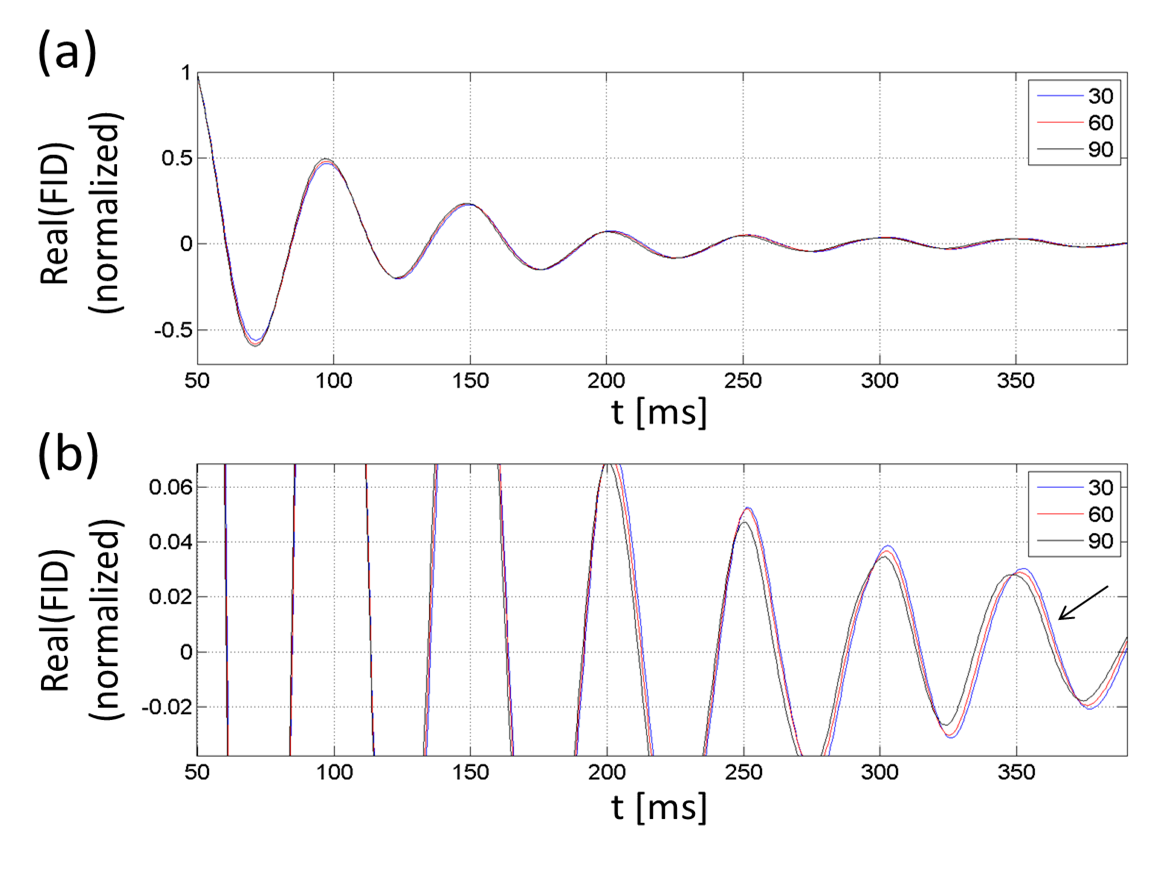
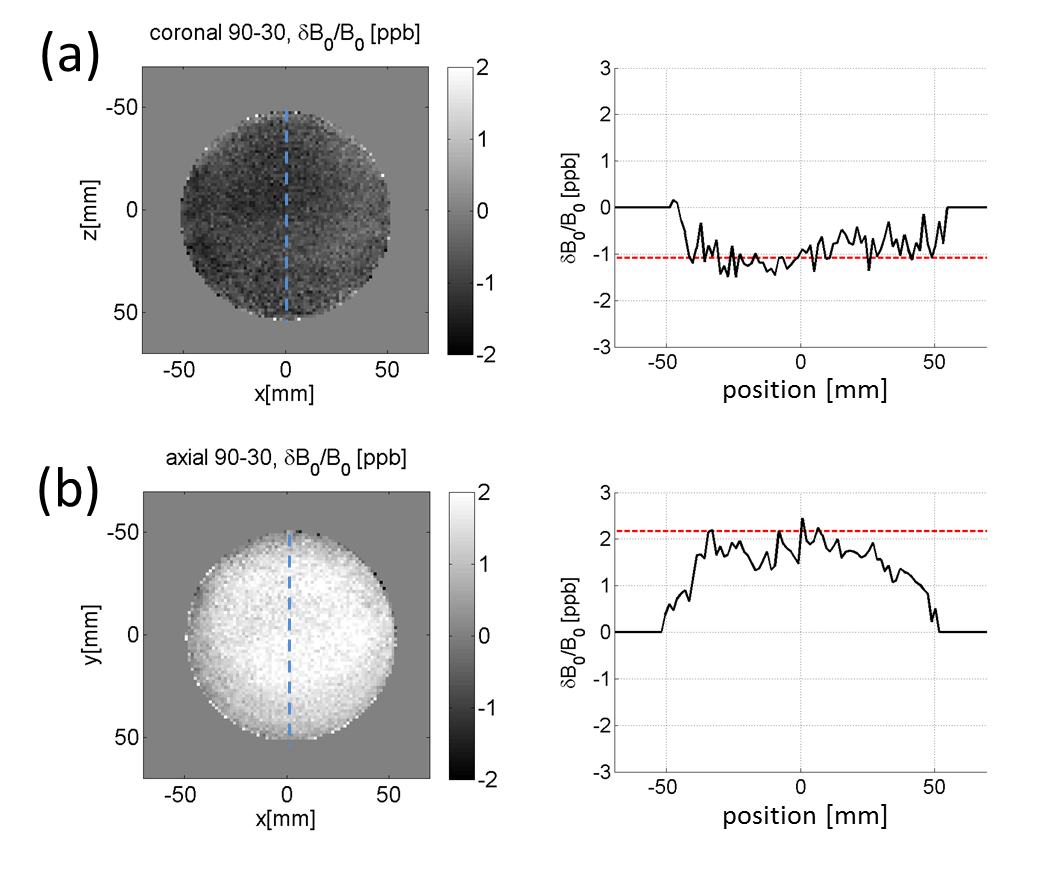
FID measurements. A flat square phantom filled with Gd-doped saline (T1=700 ms) was prepared for scans at 3T (Siemens Prisma). The phantom was scanned at two different orientations, with its face parallel or perpendicular to B0 (Fig. 1a,b). The scans consisted of free induction decay (FID) measurements without spatial encoding, at α=10° to 90°. Long TR (>5T1) ensured full magnetization recovery. The FID time traces were apodized, zero-padded, and Fourier-transformed to determine the peak frequency with 3.8 mHz bin size. The main magnetic field drift was accounted for by measuring low-tip-angle FID signals every 1~2 minutes and subtracting the interpolated drift frequencies from the data. For each tip-angle, 4 to 8 FIDs were averaged in an interleaved manner. The B0 drift during a typical measurement session (5~10 min) was a fraction of the range of the measured frequency variation. B0 mapping. A 10-cm diameter spherical phantom with T1=330ms was scanned at 3T for B0 mapping on two different—axial and coronal—slices (thickness=5mm). A double-echo gradient echo sequence with TR= 1s, TE= 10,30ms was used. For each slice, B0 maps were obtained with α=30° and 90°. Their difference, δB090-30, served to test NSS in 2D.Results
Figure 2 shows samples of FID signals (carrier at -20 Hz) at α=30°,60°,90° for the case when the flat phantom was parallel to B0. A progressive phase shift is observed. The raw data were subject to magnet drift preventing accurate shift measurements. After the drift correction and averaging, the tip-angle dependent frequency shift was more clearly measurable (Fig. 3). As the phantom’s orientation changed, the sign of the tip-angle dependence reversed, and the magnitude of the shift was in good agreement with Eqs.(1,2) (after accounting for the slab's finite thickness by numerical dipolar field simulation). Figure 4 shows the B0 map difference between α= 30° and 90° at two slice orientations. The sign of the B0 change agrees with the theory. The shift amplitude was somewhat smaller than the theoretical predictions, potentially due to imperfect slice profile, tip-angle inhomogeneity, T1 relaxation, and magnet drift during the B0 map scan.Disucssion
The high sensitivity of phase imaging in MRI allows measurement of thermal equilibrium nuclear spin polarization through its effect on the Larmor frequency in the imaged object. Given recent advances in quantitative susceptibility mapping (QSM)6,7, nuclear susceptibility can potentially make difference in ppb-level tissue susceptibility quantification. Through a static (e.g., proton density) as well as dynamic effects (e.g., tip-angle non-uniformity, longitudinal relaxation, excitation profiles), NSS can also add uncertainties to high susceptibility-resolution QSM. With sufficient hardware stability, it may be possible to use NSS as an independent, dipolar-field-based method to measure proton density8.Acknowledgements
This work was supported by IBS-R015-D1.References
[1] Bloch F. Phys Rev 1946;70:460.
[2] Thompson DO, Chimenti DE (ed), Review of Progress in Quantitative Nondestructive Evaluation, Plenum, 1995, vol 14, p.1751.
[3] Schenck JF. Med Phys 1996;23:815.
[4] Zangwill A. Modern Electrodynamics. Cambridge University Press, 2013, p. 413.
[5] Marque JP et al., Concept Magn Reson 2005;25B:65.
[6] Wang Yi et al., MRM 2015;73:82.
[7] Wei H et al., NeuroImage 2016;137:107.
[8] Gutteridge S et al., MRM 2002;47:871.
Figures