1213
Signal compartments modelled from 7T multi-echo GE data showed variation across the corpus callosum1University of Queensland, St. Lucia, Australia
Synopsis
Quantitative assessment of myelin water fraction using a multi-compartment model can be useful to improve our understanding of white matter diseases. Our work aims to explore tissue microstructure information contained in voxel signals by analysing voxel compartment volume fraction, frequency shift and $$$T_2^*$$$ from data acquired at 7T. We performed our analysis across from the rostrum to the splenium of corpus callosum. Parameterisation of tissue characteristics can potentially delineate structural and chemical changes in tissue with biologically meaningful information. This in turn provides a framework for new imaging biomarker development in neurodegenerative diseases and disorders, such as multiple sclerosis
Introduction
Frequency shifts mapped as a function of echo time from ultra-high field GRE-MRI data show distinct variations which have been suggested to be influenced by white matter microstructure.1–3 Additionally, it was shown that magnetic susceptibility derived from frequency shift maps can also vary as a function of echo time.4 The variation in these values can be explained by compartmentalising the voxel signal into distinct signal compartments.5–8 In white matter, the compartments have been associated with axonal, myelin and extracellular spaces. Each compartment has a volume fraction, frequency shift and $$$T_2^*$$$ relaxation time and it is assumed that these three compartments contribute entirely to the measured voxel signal. In this study, our aim was to investigate how the three compartment model parameters change across the sagittal midline of the corpus callosum (CC), which is known to have variation in myelin levels and axon radii.9,10Methods
The study was approved by the local human ethics committee and written informed consent was obtained from five healthy volunteers (aged 30-41). The data were acquired using a 3D GRE-MRI sequence on a 7T whole-body MRI research scanner (Siemens Healthcare, Erlangen, Germany) with a 32 channel head coil (Nova Medical, Wilmington, USA) using the following parameters: TE1=2.04ms with echo spacing of 1.53ms and 30 echoes, TR=51ms, flip-angle=15o, voxel-size=1mm$$$\times$$$1mm$$$\times$$$1mm and matrix size=210$$$\times$$$168$$$\times$$$144. A brain mask for each participant was created using MIPAV (Medical Imaging Processing and Visualisation, https://mipav.cit.nih.gov).11 iHARPERELLA (http://people.duke.edu/~cl160,STI Suite12) was used to compute tissue phase at each echo point from which 30 frequency shift maps were generated for each participant. The CC was manually segmented into eight regions using a standardised template,13 regions shown in Fig 1. Signal fitting was performed using the following three compartment model:14 s\left(t\right)=\left(A_{my}e^{-\left(\frac{1}{T_2^*my}+i2\pi\triangle f_{my}\right)t}+A_{ax} e^{-\left(\frac{1}{T_2^*ax}+i2\pi\triangle f_{ax}\right)t}+A_{ex}e^{-\left(\frac{1}{T_2^*ex}+i2\pi\triangle f_{ex}\right)t}+C\right)e^{-i2\pi\triangle f_{bg}t-i\Phi_{0}} where Amy, Aax and Aex are volume fractions for the myelin, axonal, and extracellular compartments, respectively, and corresponding T2,my*, T2,ax* and T2,ex* and $$$\triangle$$$fmy, $$$\triangle$$$fax and $$$\triangle$$$fex are the compartment relaxation times and frequency shifts. Fitting was performed in MATLAB (MathWorks, Natick, MA) using lsqnonlin. We used a term to adjust background offset,14 which contains background frequency shift ($$$\triangle$$$fbg) and phase offset($$$\Phi_{0}$$$). We added a constant term (C) in the model to account for the noise floor in the measured data. We considered the case when T2* values for each region were allowed to vary (11 parameter model–M11) or were fixed (8 parameter model–M8). Fixed T2* values for the M8 were obtained by calculating the median of the voxel-by-voxel computed T2* values for each CC region. We performed a one-way ANOVA to test whether compartment parameters changed across the CC.Results
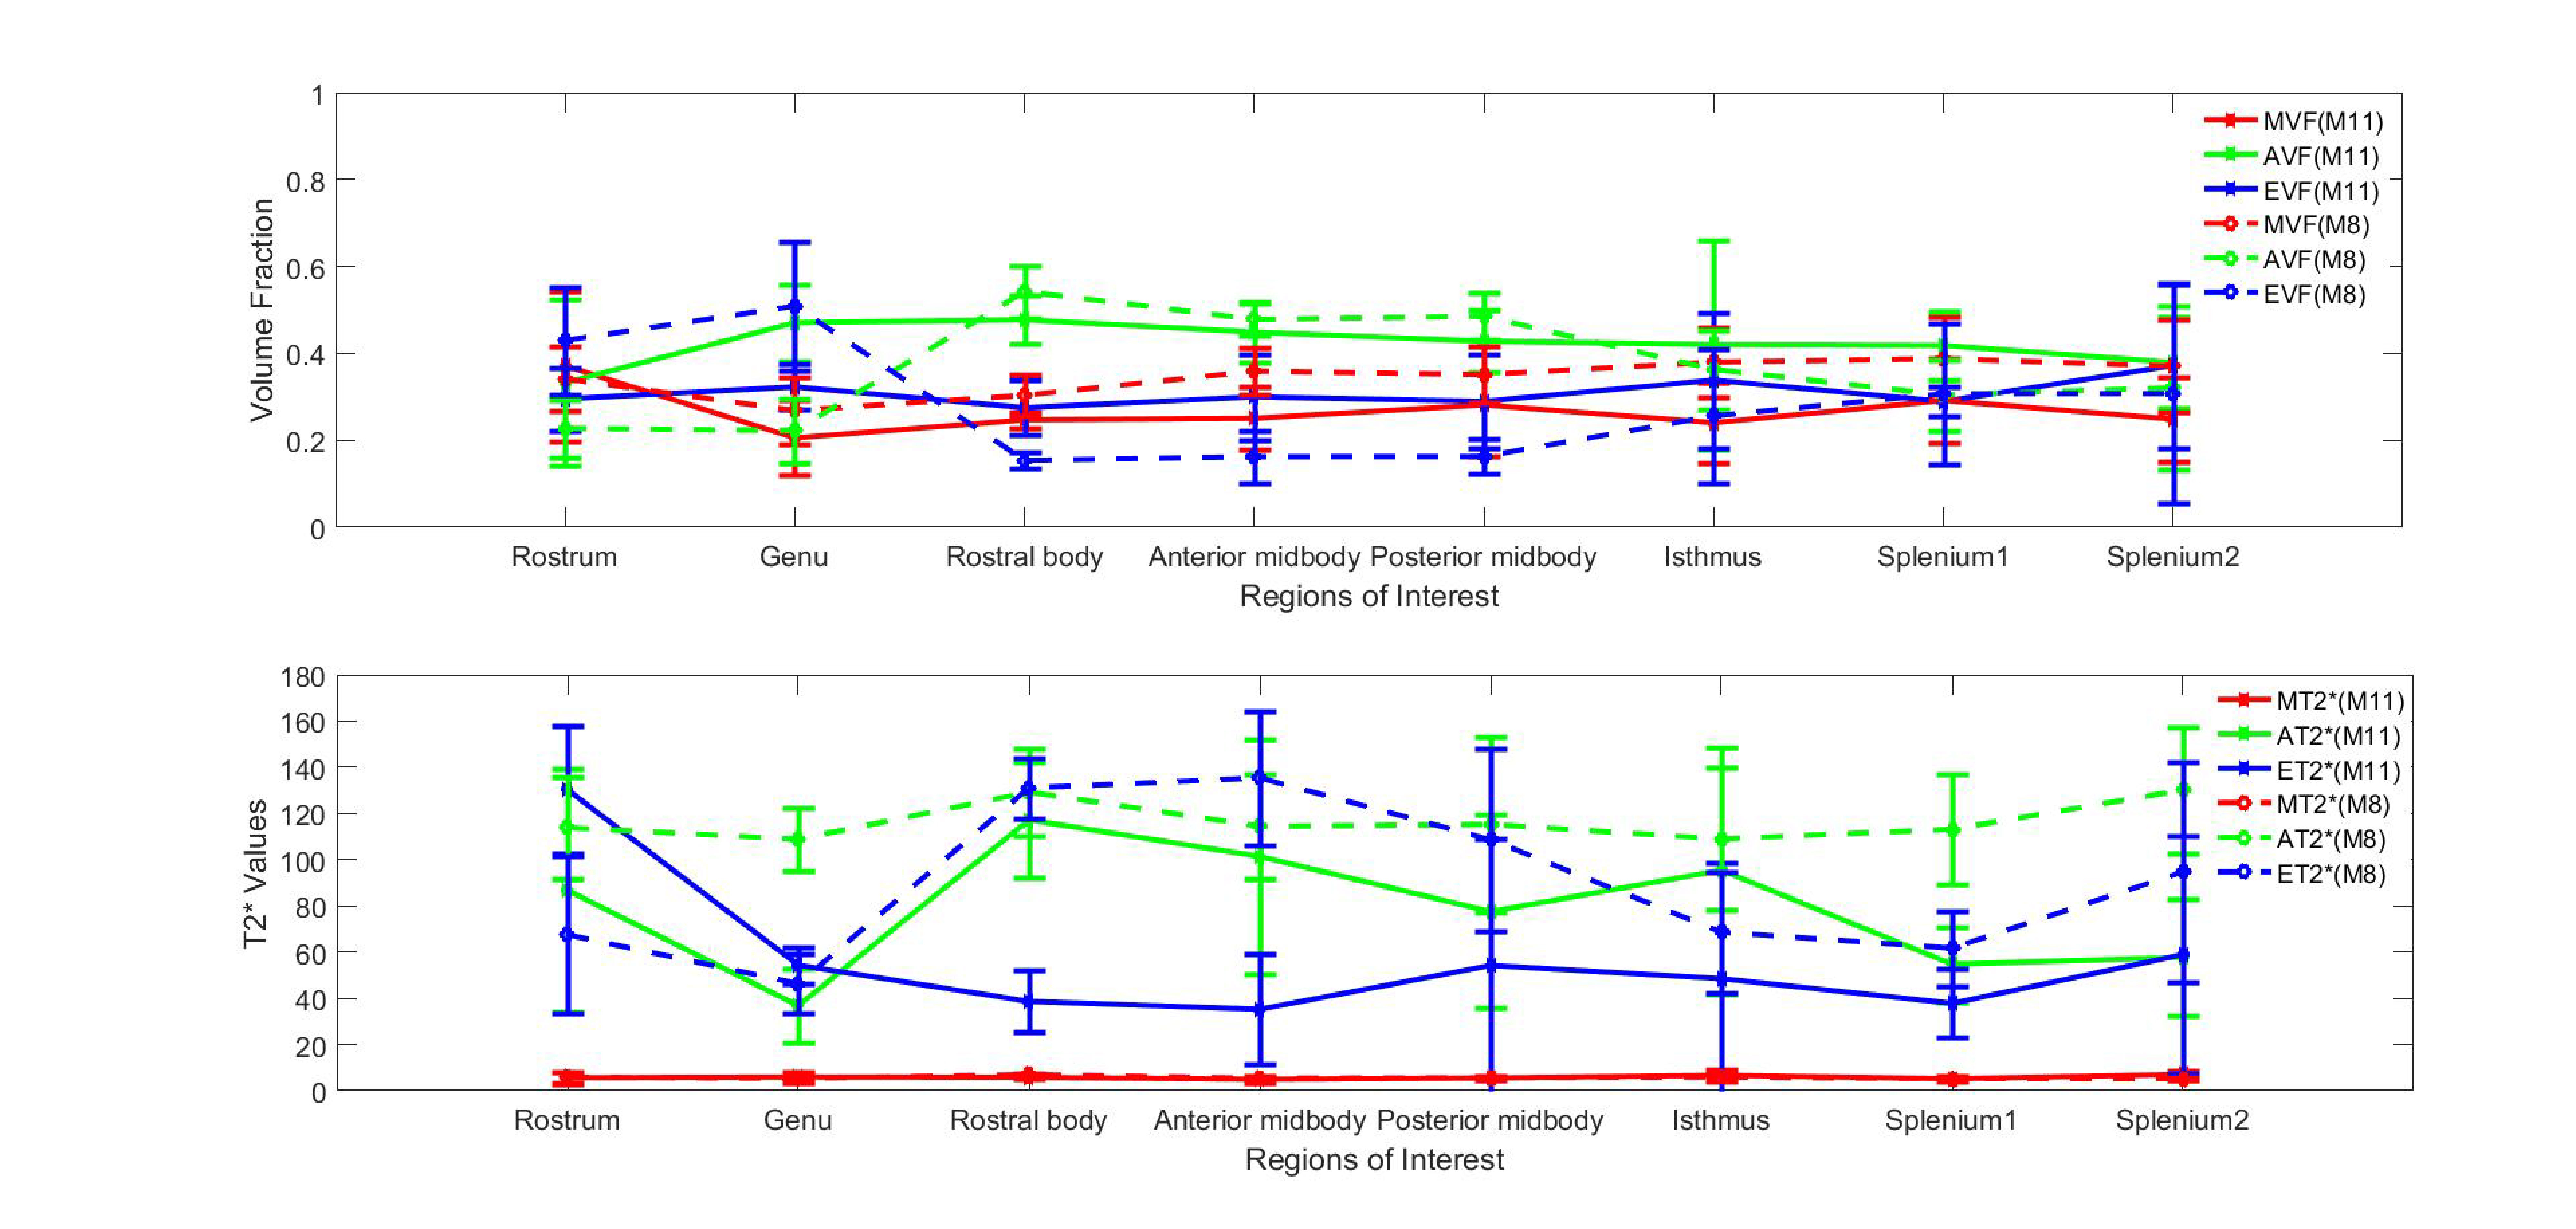
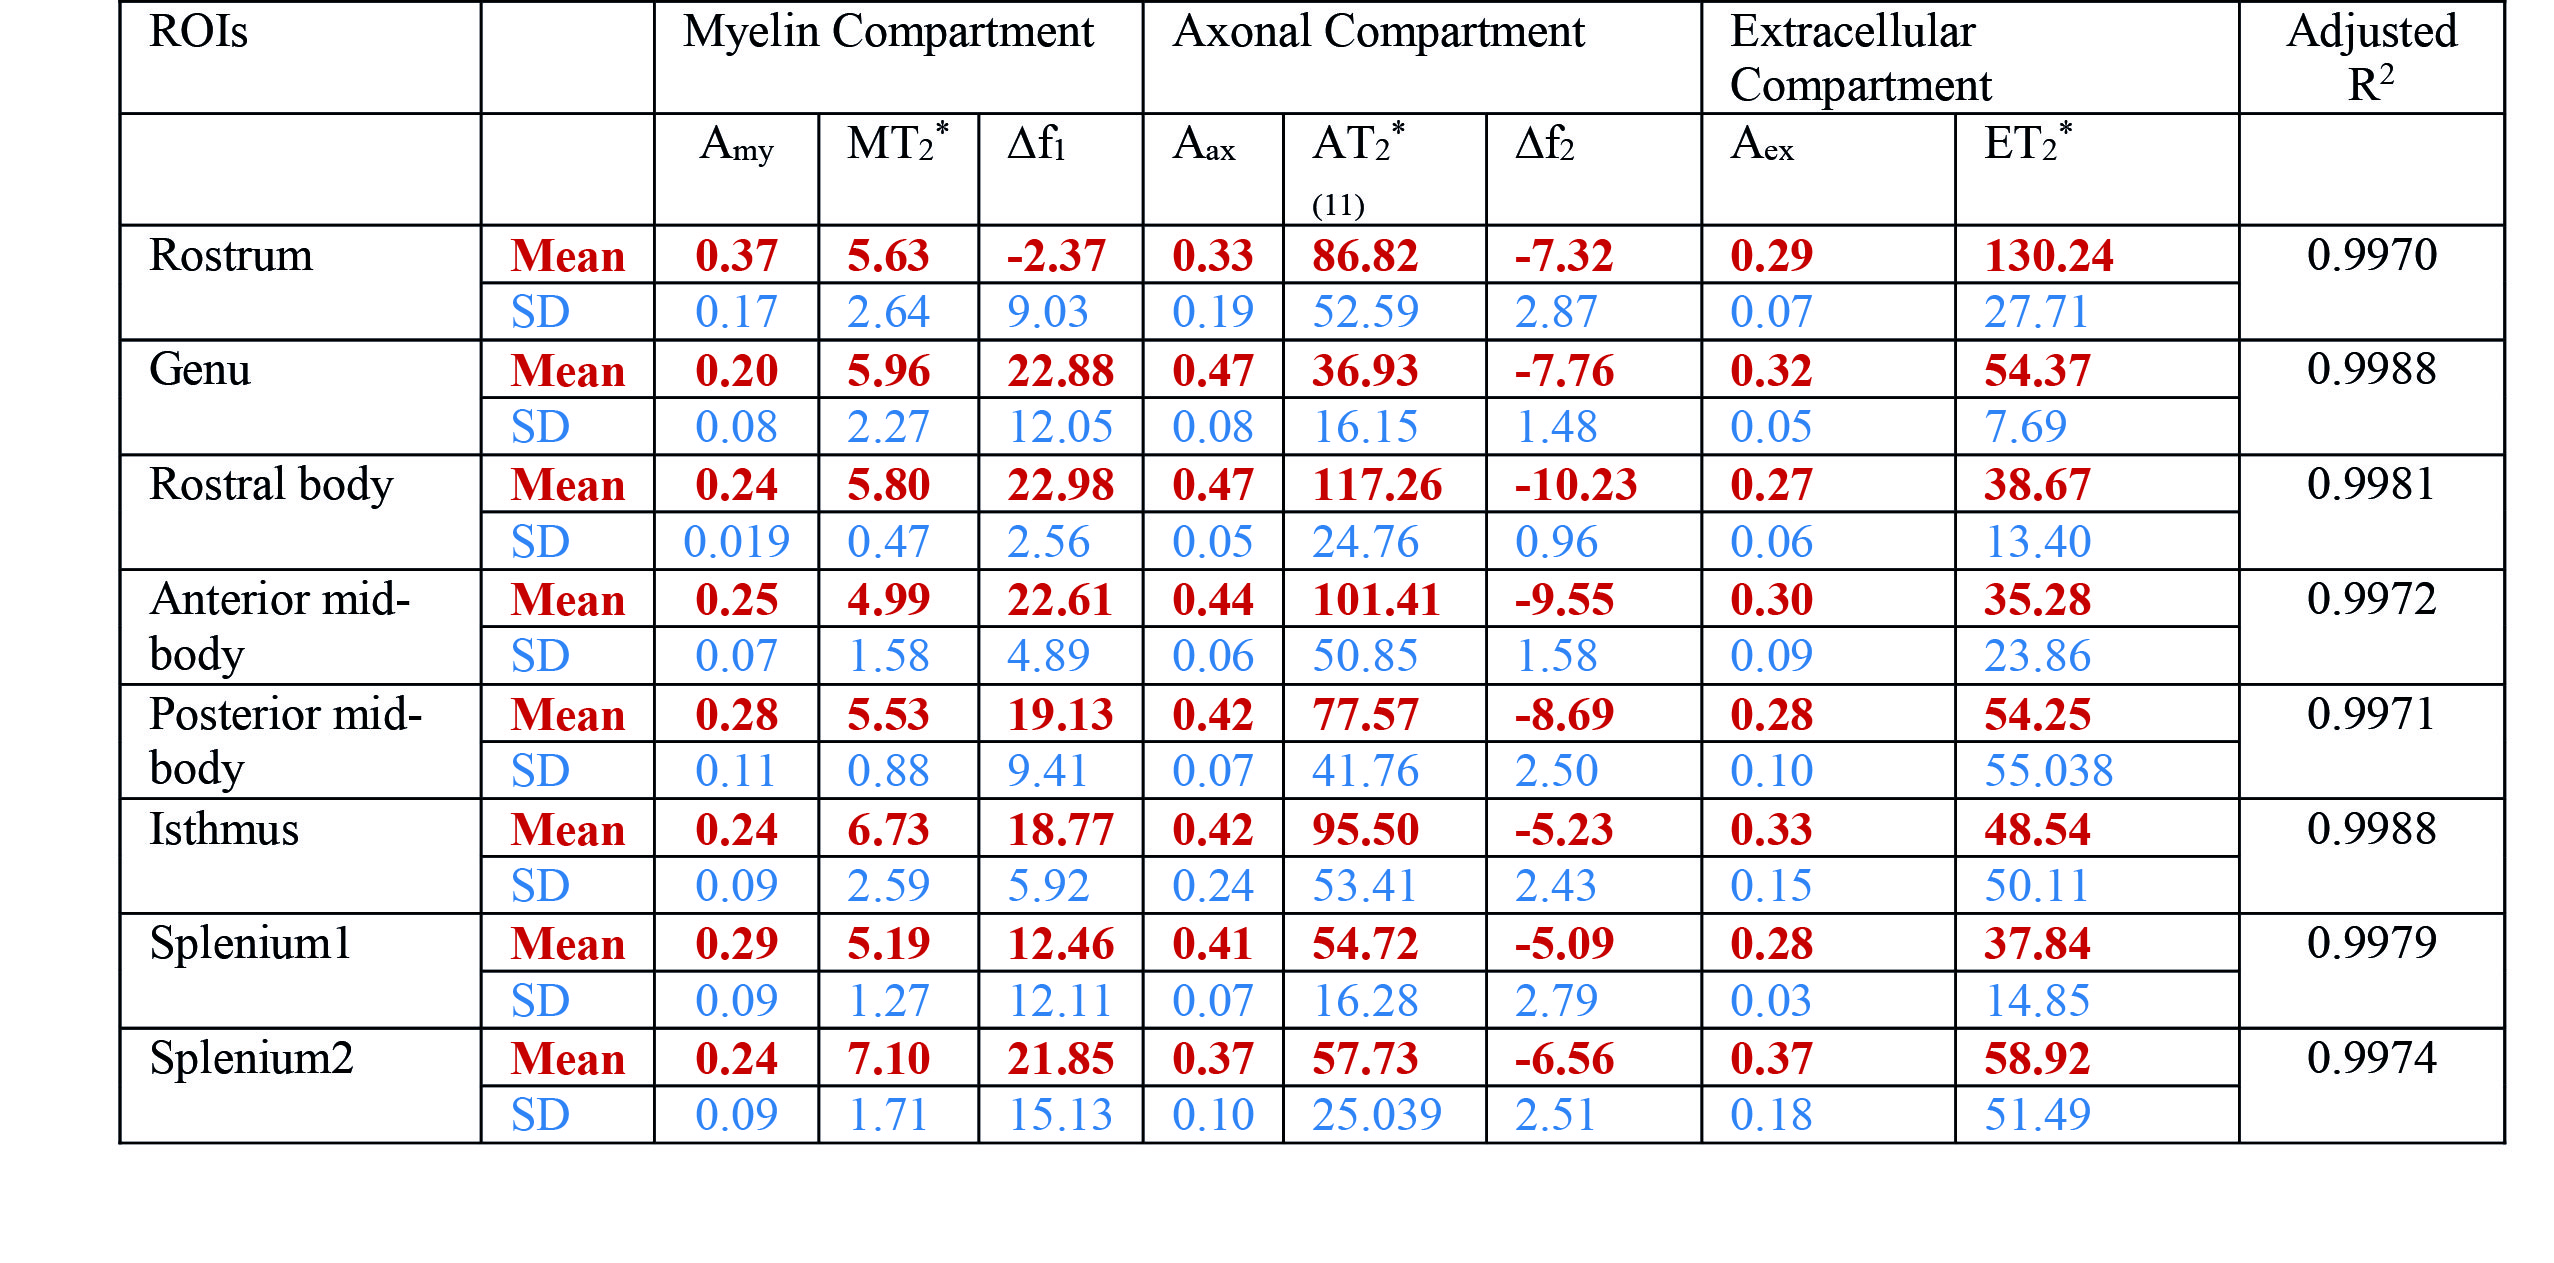
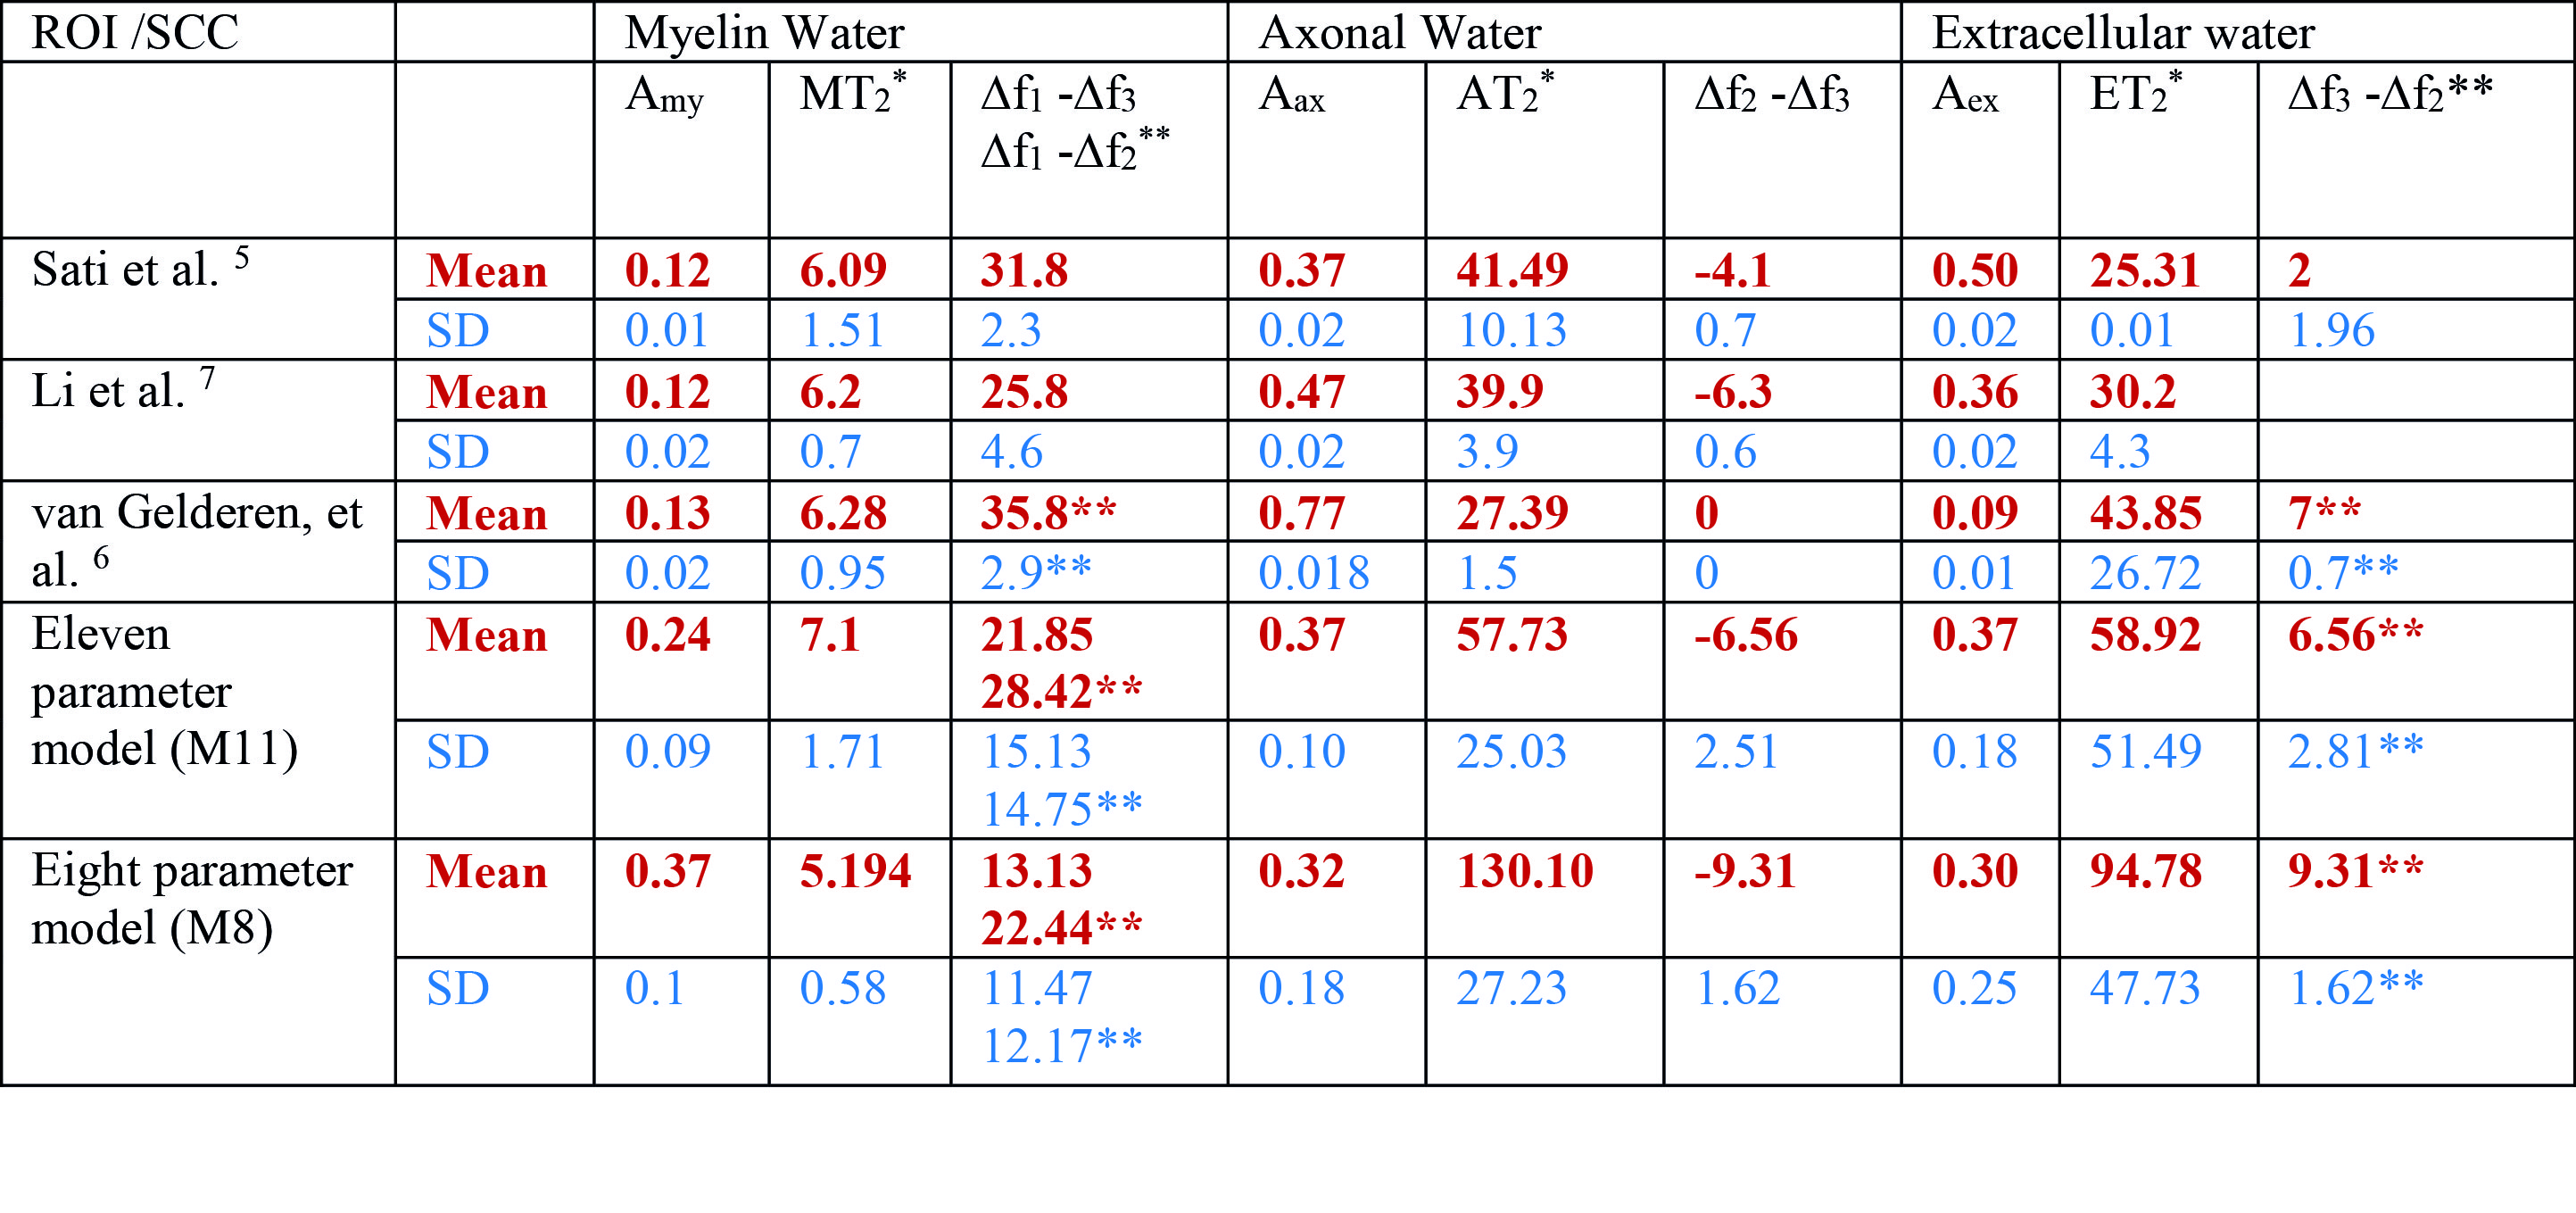
Fig 2-3 show how the compartment parameters vary for the five participants across eight CC regions studied using M11 and M8, that show a similar trend except for extracellular T2*. Low variability in volume fraction shown by M11 suggests that it is the more appropriate model, and hence, we used the results from M11 for further analysis. All the compartment parameter values computed using M11 are summarised in Table 1. We found that volume fraction, T2* and frequency shift of the myelin and extracellular compartments did not change significantly whereas axonal volume fraction, T2*, and frequency shift did vary significantly across CC regions, see Fig 2-3. A comparison between our findings and those previously reported for the splenium of the CC are provided in Table 2. A significant difference in axonal volume fraction (p=0.047), T2* (p=0.014) and frequency shift (p=0.009) was present across CC regions.Discussion
Axon radius, myelination and packing density have been shown to change across the CC,9,10 but white matter signal compartments derived from GRE-MRI data have not reported a dependence on CC structure.7,8 We found volume fraction and T2* of myelin and extracellular compartments to not change significantly across the CC, which may be due to a small sample size (i.e. N=5). We did however find a significant change in axonal compartment parameters.Conclusion
Our findings suggest that signal compartments derived from 7T multiple-echo GRE-MRI data are sensitive to white matter microstructure. Signal compartmentalisation may play a key role in neuroimaging studies in which white matter is implicated.Acknowledgements
MB acknowledges funding from Australian Research Council Future Fellowship grant FT140100865. SB acknowledges funding from UQ Postdoctoral Research Fellowship grant and an NVIDIA Hardware Seed Grant. The authors acknowledge the facilities of the National Imaging Facility (NIF) at the Centre for Advanced Imaging, University of Queensland. VV would also like to thank the Australian Research Council for discovery grant funding (DP140103593).References
1. Wharton, S. & Bowtell, R. Fiber orientation-dependent white matter contrast in gradient echo MRI. Proc. Natl. Acad. Sci. U. S. A. 2012; 109:18559–18564.
2. Lee, J. et al. T2*-based fiber orientation mapping. NeuroImage, 2011; 57: 225–234.
3. Sati, P. et al. In vivo quantification of T2? anisotropy in white matter fibers in marmoset monkeys. NeuroImage, 2012; 59: 979–985.
4. Sood, S. et al. Echo time-dependent quantitative susceptibility mapping contains information on tissue properties. Magn. Reson.2016;26281
5. Sati, P. et al. Micro-compartment specific T2? relaxation in the brain. NeuroImage, 2013; 77:268–278.
6. van Gelderen, P. et al. Non-exponential T2* decay in White Matter. Magn. Reson. Med. 2012; 67; 110–117.
7. Li, X. et al. Detection of demyelination in multiple sclerosis by analysis of relaxation at 7 T. NeuroImage Clin. 2015; 7: 709–714.
8. Hwang, D., Kim, D.-H. & Du, Y. P. In vivo multi-slice mapping of myelin water content using T2* decay. NeuroImage, 2010; 52:198–204.
9. Aboitiz, F., Scheibel, A. B., Fisher, R. S. & Zaidel, E. Fiber composition of the human corpus callosum. Brain Res. 1992, 598:143–153.
10. Tomasch, J. Size, distribution, and number of fibres in the human Corpus Callosum. Anat. Rec. 1954; 119, 119–135.
11. McAuliffe, M. J. et al. Medical Image Processing, Analysis and Visualization in clinical research. Proc. 14th IEEE Symposium on 2001; 381–386.
12. Li, W., Avram, A. V., Wu, B., Xiao, X. & Liu, C. Integrated Laplacian-based phase unwrapping and background phase removal for quantitative susceptibility mapping. NMR Biomed. 2014; 27:219–227.
13. Witelson, S. F. Hand and Sex Differences in the Isthmus and Genu of the Human Corpus Callosum. Brain , 1989; 112: 799–835.
14. Nam, Y., Lee, J., Hwang, D. & Kim, D.-H. Improved estimation of myelin water fraction using complex model fitting. NeuroImage, 2015; 116:214–221.
Figures