1212
The effect of white matter fiber orientation in Quantitative Susceptibility Mapping at 7T1University of Pisa, Pisa, Italy, 2Imago7 Research Center, Pisa, Italy, 3IRCCS Stella Maris, Pisa, Italy
Synopsis
The tensorial nature of magnetic susceptibility affects frequency-shift images and quantitative maps (QSM), whose reliability should be questioned. Three healthy volunteers underwent 7T MRI exams including diffusion tensor imaging (DTI) and three QSM acquisitions, each with different orientation of the head. In order to assess the effect of susceptibility anisotropy, we sorted brain voxels depending on their fractional anisotropy (FA) and, by plotting their QSM values against the angle between the static field and the eigenvector corresponding to the largest eigenvalue in DTI, we observed an empirical threshold of FA that reflects the reliability of susceptibility measures.
Purpose
It has recently been demonstrated that the quantitative evaluation of magnetic susceptibility of brain tissues in vivo has several clinical applications. Magnetic susceptibility is a second-order tensor, whose estimation requires at least six acquisitions1, each one with the patient’s head oriented differently with respect to the static magnetic field. Dramatically long exams and patients’ discomfort limit the feasibility of this approach in the clinical practice, therefore quantitative susceptibility mapping (QSM) techniques relying on one single acquisition are more often applied. In such simplified approach, magnetic susceptibility is approximated with a scalar quantity and orientation-dependent anisotropies are ignored, and reproducibility of QSM measurements becomes an issue. The aim of this contribution is to evaluate the impact of orientation-dependent susceptibility anisotropy and assess the reliability of single-orientation acquisition strategies providing a threshold-based criterion to identify and exclude voxels that are largely affected by structural orientation. To this purpose, we analyzed the interplay between diffusion parameters (describing structural anisotropy) and values of frequency shift and QSM.Methods
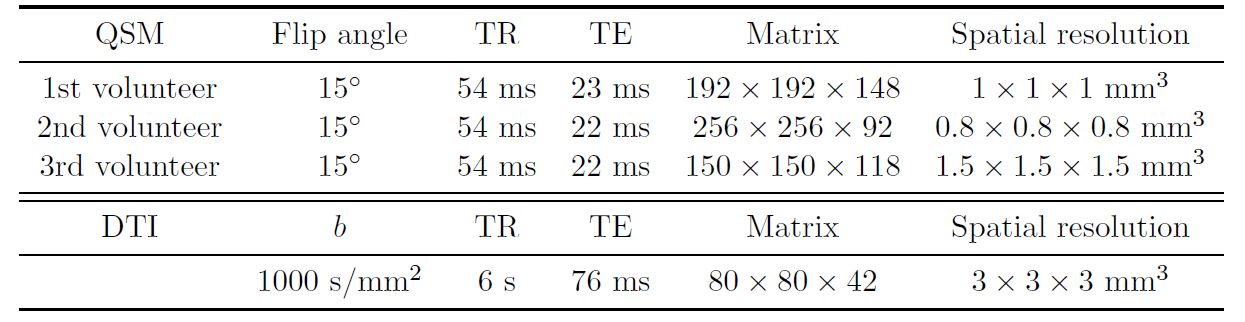
By using an MR950 7T system (GE Healthcare, Milwaukee, WI, USA), data of three healthy volunteers were acquired. Subjects were laid supine on the scanner bed and their head was placed in a 2ch-tx/32ch-rx coil (Nova Medical, Wilmington, MA, USA). For each subject, three datasets were collected; during the first acquisition, the head was in the conventional position, while it was slightly rotated during the other two acquisitions. On the basis of diffusion tensor imaging (DTI), maps of fractional anisotropy (FA) and tissue orientation (θ, defined as the angle between the largest eigenvector and static magnetic field) were calculated for each subject. Acquisition parameters are summarized in Figure 1. Brain masks were generated from the magnitude images via FSL-BET2. Phase images were unwrapped using a Laplacian-based algorithm3,4, the background field was removed with V-SHARP5 and frequency-shift (FS) images were obtained; susceptibility maps were computed using the iLSQR3,6 method. FS and QSM data were co-registered using FSL-FLIRT7,8 to the DTI image acquired with no diffusion gradient applied. Ten intervals of FA were defined (0:0.1; 0.1:0.2; …; 0.9:1), and QSM values corresponding to voxels in each FA interval were plotted against θ (averaging over intervals of 1°). The variability (standard deviation) of FS and QSM values was assessed as a function of θ within each FA interval.Results
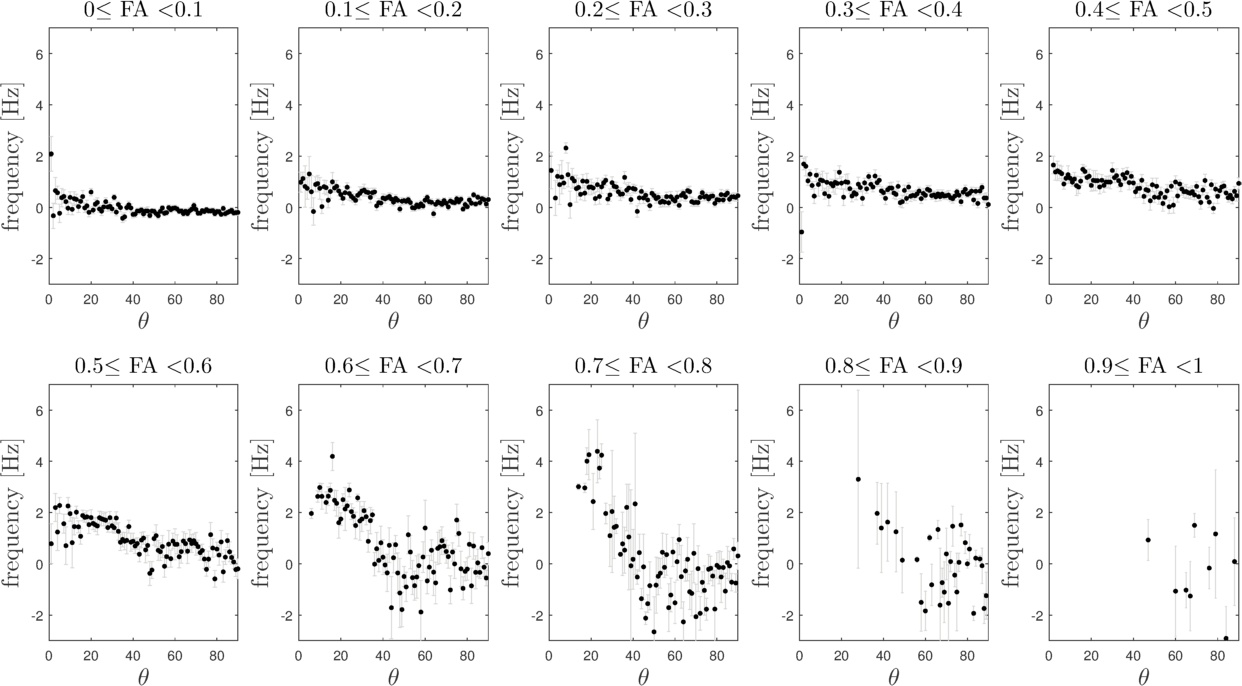
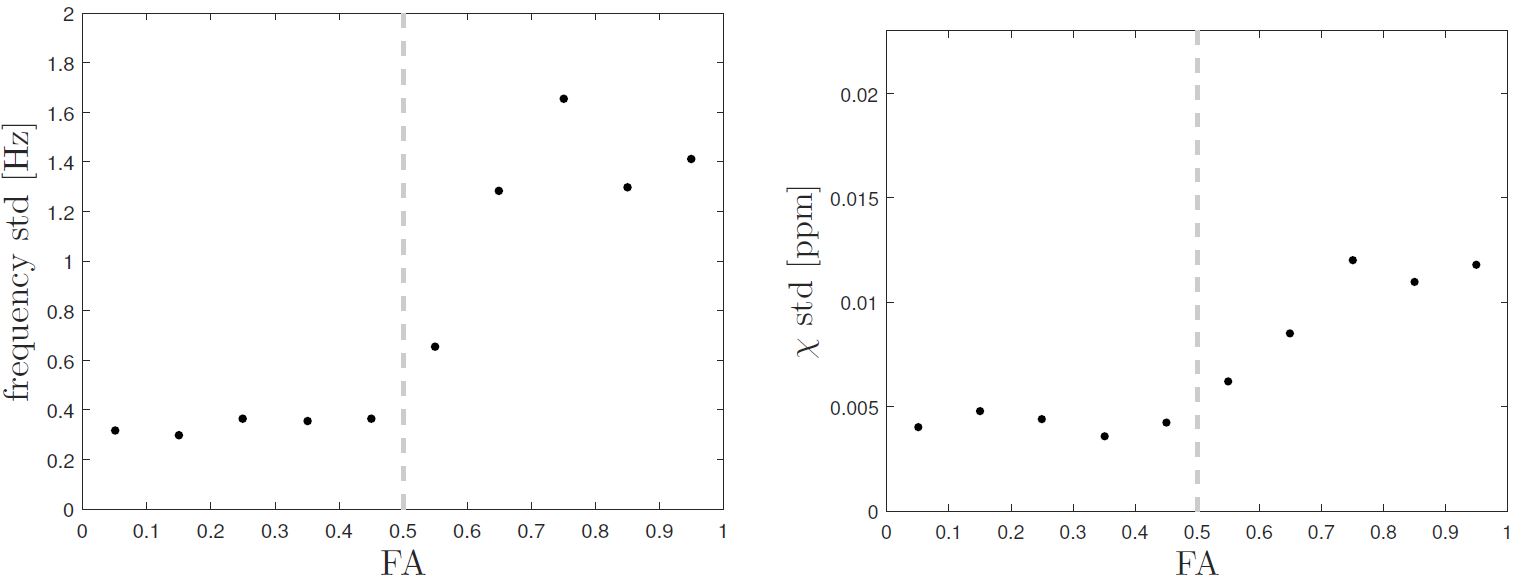
With increasing FA, FS values (hence QSM) tend to vary more as a function of θ. This observation is represented in Figure 2. The trend of the standard deviations of FS and QSM values for each interval of FA is shown in Figure 3. The consistency of FS and QSM values at FA < 0.5 is disrupted for FA > 0.5, where their standard deviations increase. Slightly decreasing standard deviations were observed for FA > 0.8, where fibers with small θ were very few with respect to those with large θ (voxels covering the corpus callosum). The analysis was consistent through data acquired in three differently tilted head positions and for different areas of white matter separately (anterior and posterior halves of the brain), which confirmed that the observations above do not depend on some particular structures with different bulk susceptibility oriented along particular angles.Discussion
Susceptibility anisotropy is known to be related to structural anisotropy9,10,11 by sinusoidal relationships between θ and FS or QSM11,12 Our observations show that the variability of susceptibility values increases with FA. Based on Figures 2 and 3, voxels with FA < 0.5 seem to be minimally affected by the dependence on θ and their QSM values could be considered reliable, reflecting their bulk susceptibility, while in regions with high FA the effect of white matter fiber orientation would require the use of more sophisticated QSM techniques such as STI1.
An improved estimation of the actual variability of the QSM values in particular structures of clinical interest could be performed via a voxel-by-voxel analysis of susceptibility over the orientation angles. This analysis was not possible in this study due to the limited room in our head coil, which allowed a maximum of ~15° head rotation.
Conclusion
A FA-based empirical threshold allows a simple estimation of the reliability of QSM maps. Single-orientation QSM methods provide replicable values with little variability in brain regions with FA < 0.5, while QSM data should be interpreted with care in large fiber bundles with large FA.Acknowledgements
No acknowledgement found.References
1. Liu C. Susceptibility tensor imaging. Magnetic resonance in medicine, 63(6):1471-1477, 2010.
2. Smith S.M. Fast robust automated brain extraction. Human brain mapping, 17(3):143-155, 2002.
3. Li W, Wu B, Liu C. Quantitative susceptibility mapping of human brain reflects spatial variation in tissue composition. NeuroImage 55, 1645–1656, 2011.
4. Schofield M.A, Zhu Y. Fast phase unwrapping algorithm for interferometric applications. Opt. Lett. 28, 1194–1196, 2013.
5. Schweser F, Deistung A, Lehr B.W, and Reichenbach J.R. Quantitative imaging of intrinsic magnetic tissue properties using MRI signal phase: an approach to in vivo brain iron metabolism? Neuroimage, 54(4):2789-2807, 2011.
6. Li W, Wang N, Yu F, Han H, Cao W, Romero R, Tantiwongkosi B, Duong T.Q and Liu C. A method for estimating and removing streaking artifacts in quantitative susceptibility mapping. Neuroimage, 108:111-122, 2015.
7. Jenkinson M and Smith S. A global optimisation method for robust affine registration of brain images. Medical image analysis, 5(2):143-156, 2001.
8. Jenkinson M, Bannister P, Brady M, and Smith S. Improved optimization for the robust and accurate linear registration and motion correction of brain images. Neuroimage, 17(2):825-841, 2002.
9. He X and Yablonskiy D.A. Biophysical mechanisms of phase contrast in gradient echo MRI. Proceedings of the National Academy of Sciences, 106(32):13558-13563, 2009.
10. Li W, Wu B, Avram A.V and Liu C. Magnetic susceptibility anisotropy of human brain in vivo and its molecular underpinnings. Neuroimage, 59(3):2088-2097, 2012.
11. Lee J, van Gelderen P, Kuo L.W, Merkle H, Silva A.C, and Duyn J.H. T2* - based fiber orientation mapping. Neuroimage, 57(1):225-234, 2011.
12. Oh S.H, Kim Y.B, Cho Z.H, and Lee J. Origin of B0 orientation dependent R2*(= 1/T2*) in white matter. Neuroimage, 73:71-79, 2013.
Figures