1211
Quantitative Susceptibility Mapping (QSM) Overcomes R2* Confounding Factors for Measuring Liver Iron1Shanghai Key Laboratory of Magnetic Resonance and Department of Physics, East China Normal University, Shanghai, People's Republic of China, 2Department of Radiology, Ruijin Hospital,Shanghai Jiao Tong University School of Medicine, Shanghai, People's Republic of China, 3Department of Radiology, Weill Medical College of Cornell University, New York, New York, United States, 4Department of Radiology, Shanghai Tenth People's Hospital Affiliated to Tongji University, School of Medicine, Shanghai, People's Republic of China, 5MR Collaboration NE Asia, Siemens Healthcare, Shanghai, People's Republic of China, 6Department of Hematology, Ruijin Hospital, Shanghai Jiao Tong University School of Medicine, Shanghai, People's Republic of China, 7Department of Pediatrics, Columbia University, New York, New York, United States, 8Department of Biomedical Engineering, Cornell University, Ithaca, New York, United States
Synopsis
A major challenge in the R2 and R2* methods for mapping liver iron content is that they can be confounded by fat, fibrosis and other changes in cellularity that are known to contribute to R2 and R2*. In this paper, the fat contribution to liver susceptibility was estimated and removed from the measured liver susceptibility with validation on a gadolinium-fat-water phantom. In patients, fat-corrected QSM was found to be insensitive to liver diseases including fat and tumor, which had extensive effects on R2*. Therefore, QSM can overcome confounding factors in R2* for mapping liver iron content.
Purpose
The purpose of this study was to develop quantitative susceptibility mapping (QSM) of liver iron content for overcoming confounding factors in R2* including fat, fibrosis and edema.Materials and Methods
To validate Gd quantification in the presence of fat, four fat-water- gadolinium (Gd) phantoms were constructed comprising of twenty-four balloons with a 28-mm diameter in varying fat/water concentrations with proton-density fat-fraction (PDFF) = 0, 14.3, 28.9, and 43.7% and Gd concentration =1.25, 2.5, 5.0, 7.5, and 10.0 mmol/L. The fat-water- Gd phantoms and nine subjects with focal lesions were imaged using a clinical Siemens 3.0T MR imaging system. Nine subjects with no known hepatic disease, and nine subjects with known or suspected hepatic iron overload were studied using a clinical Siemens 1.5T MR imaging system. Liver QSM and R2* mapping were obtained from the same 3D GRE data.
To obtain the susceptibility field for QSM reconstruction, simultaneous phase unwrapping and chemical shift removal were performed using graph cuts with conditional jump moves followed by fine-tuning the field map with T2*-IDEAL.1 The fat contribution to liver susceptibility was estimated and removed from the measured liver susceptibility with validation on a gadolinium-fat-water phantom.
Results
Figure 1 shows the measured susceptibility and R2* maps from fat-water- Gd phantoms. Susceptibility measured in the Gd-doped solutions was proportional to Gd concentration, with Gd molar susceptibility given by the linear regression slope (321, 318 , 294, and 227 ppm L/mol for PDFF=0, 14.3, 28.9, and 43.7%, respectively) (Figs.1i&1k) and the fat contribution to solution susceptibility given by measured value at vials of zero Gd on Fig.1i. The fat contribution to solution total susceptibility was linearly proportional to the fat concentration for Gd concentrations up to 2.5mmol/L (Fig.1j). R2* values had complex relationships with Gd concentration that depended on fat contents: linear at PDFF=0, quadratic at PDFF=14.3%, and very nonlinear at higher PDFFs (Fig.1l).
The focal lesions had substantial effects on R2* but minimal effects on fat-corrected QSM. Figure 2 shows the T2 weighted image, water map, fat map, QSM susceptibility map without fat correction, susceptibility map with fat correction, and R2* map from a patient with hepatic hemangioma. The lesion showed hyperintensity in T2 weighted images (Fig. 2a) and there was a reduction on R2* (Fig. 2f). After fat correction, there was no visually detectable contrast in the mean susceptibility value (Fig.2e).
In the patients with focal lesions, there was a correlation between liver R2* measurements and fat percentages (Fig. 3a, R2 =0.787, P = 0.001), but no significant correlation between liver susceptibility values and fat percentages (Fig. 3b, R2= 0.193, P = 0.236).
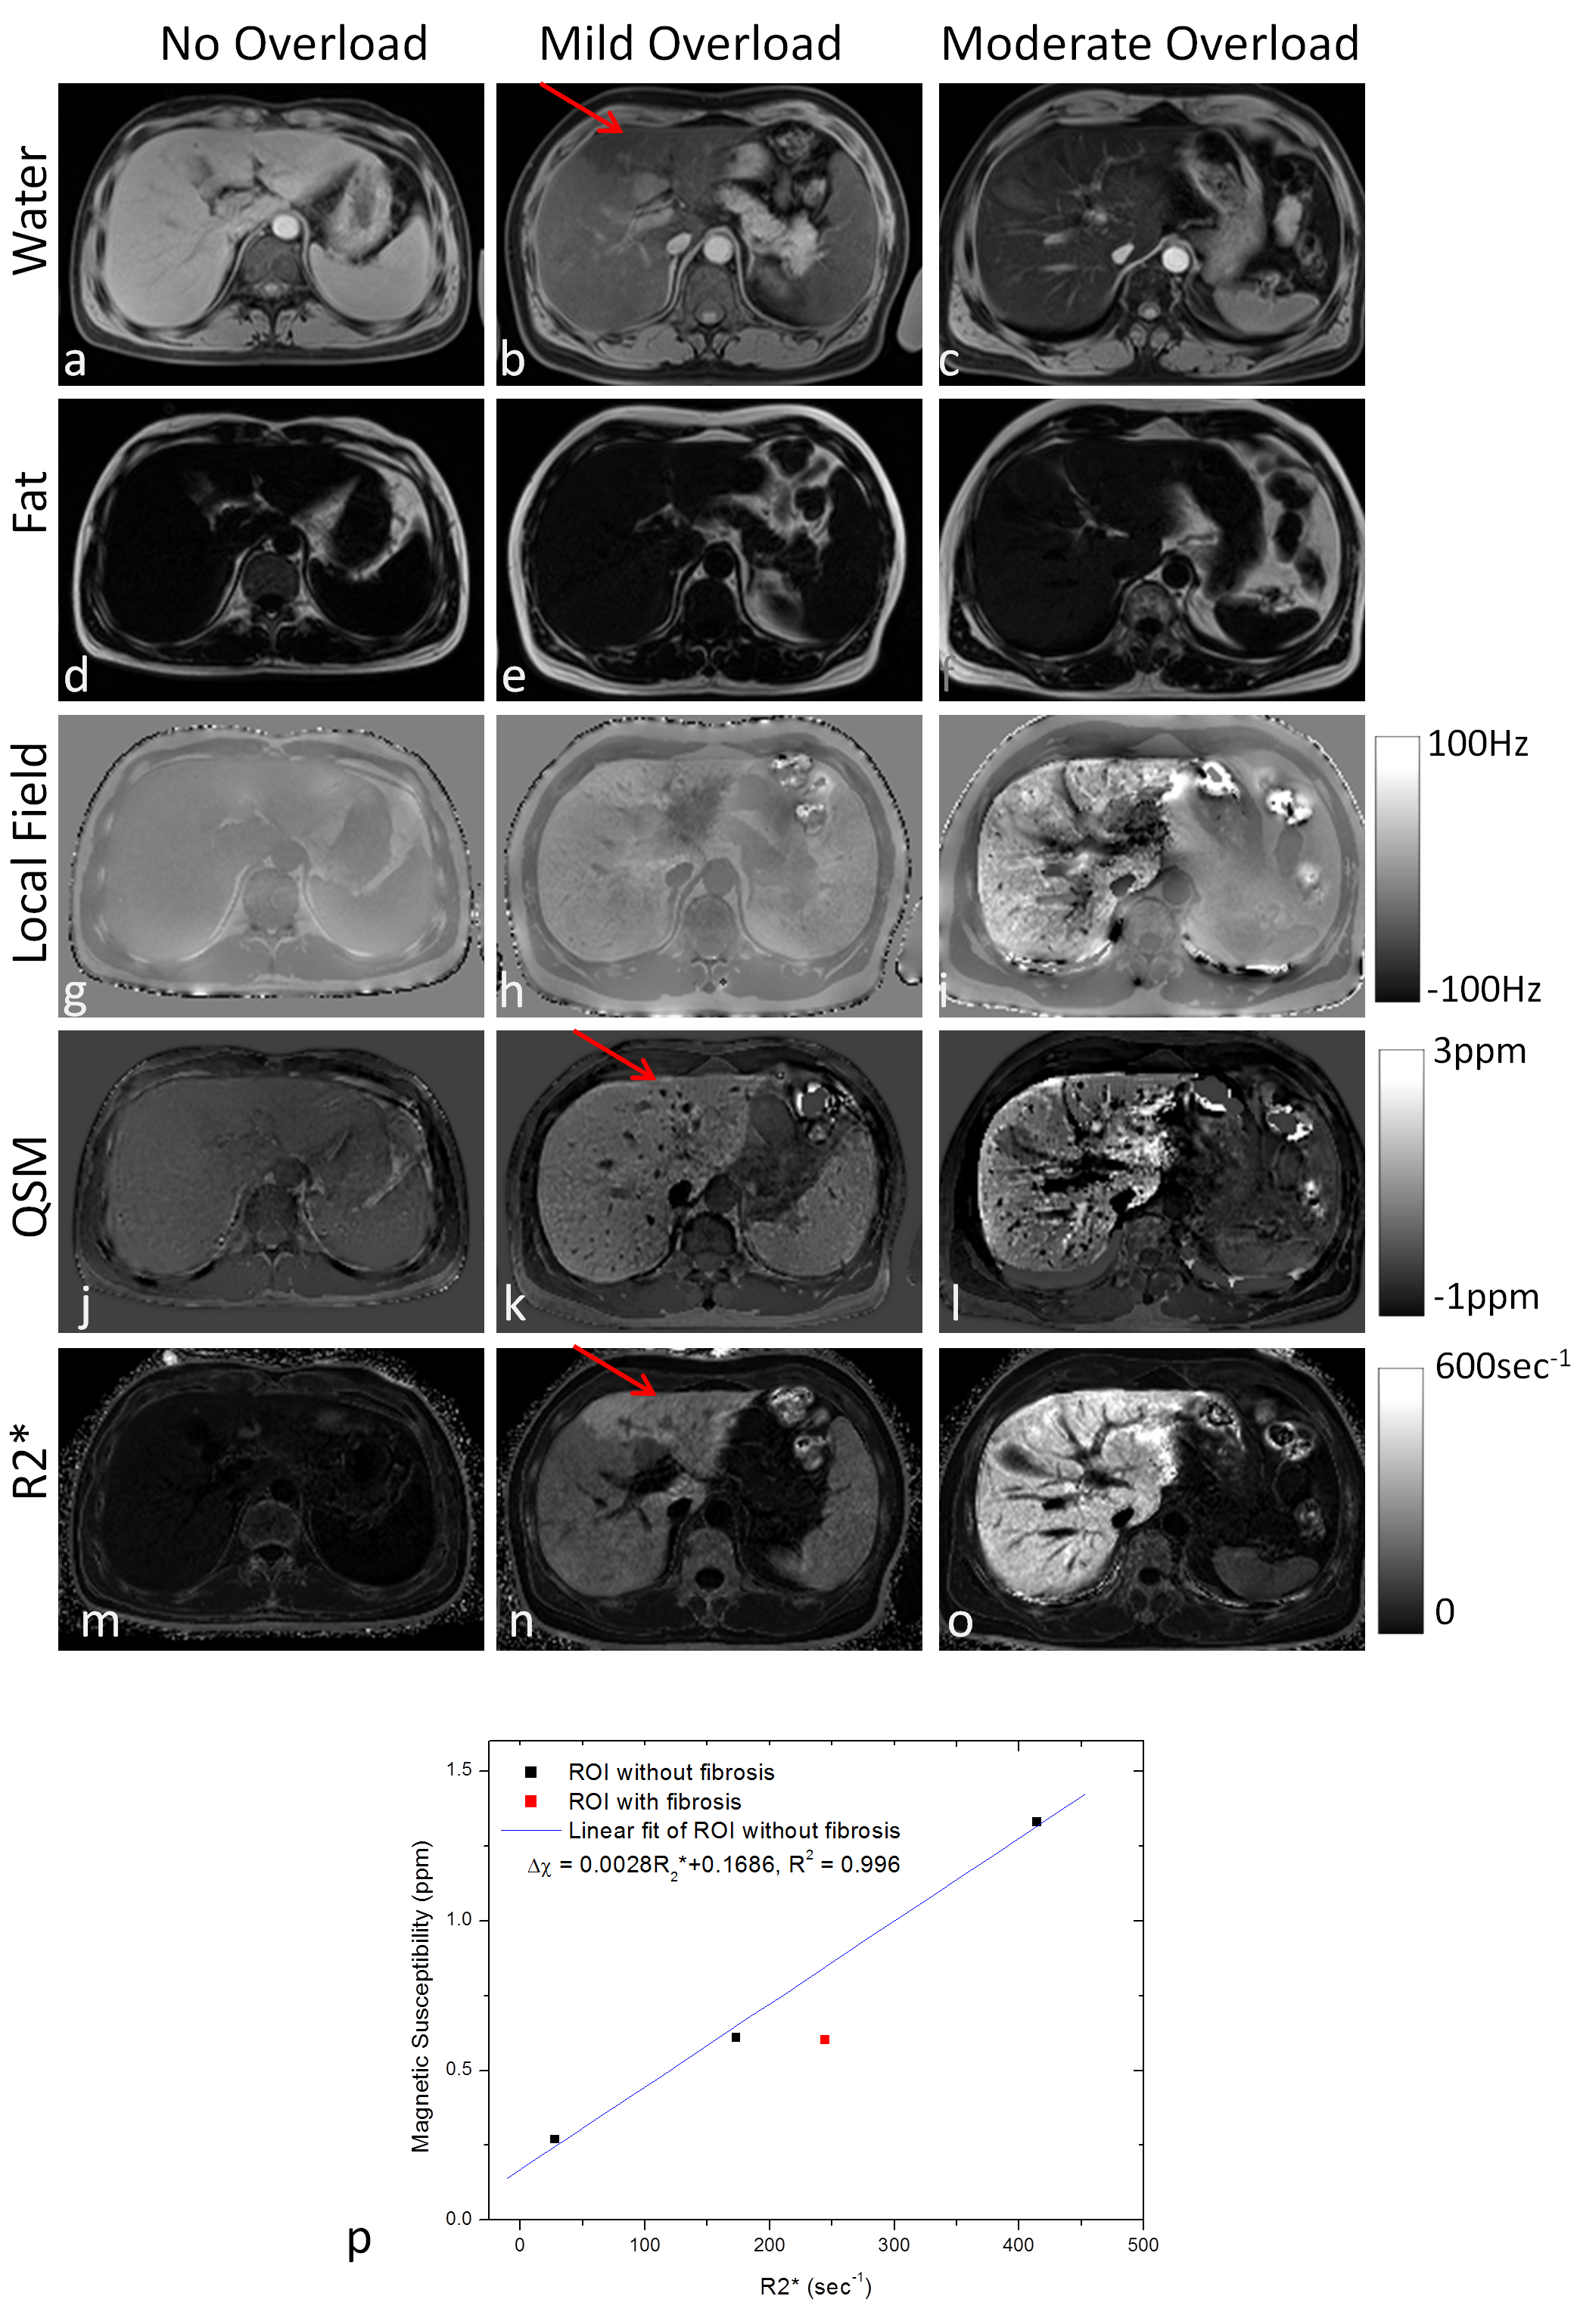
Figure 4 shows the water, fat, local field, susceptibility, and corresponding R2* maps from three subjects with different levels of iron overload, ranging from no iron overload to moderate iron overload. As iron levels increased, both susceptibility and R2* increased. For the patient with mild iron overload, there was also suspected fibrosis in the left lobe that did not affect QSM but increased R2* (red arrows in the 2nd column). Among this group of patients, liver magnetic susceptibility and R2* were linearly correlated (R2=0.996, P=0.039, Fig. 4p) in the liver regions without fibrosis, but not in the liver regions with fibrosis.
For ROI measurements that avoided focal lesions and vascular structures, liver susceptibility and R2* measurements were linearly correlated (R2=0.797, P<0.0001, Fig.5a). For measurements in ROIs on focal lesions, no significant correlation between lesional susceptibility and R2* measurements was found (P=0.51, Fig.5b).
Discussion and Conclusion
Liver tissue susceptibility in this work was modeled from paramagnetic iron (gadolinium substitute in the phantom) and fat. Through signal phase analysis, the chemical shift of fat allows fat quantification (SPURS + T2*-IDEAL)1 and subsequent QSM.1-3 The intravoxel mixture of fat and water with different susceptibilities causes additional field inhomogeneity within a voxel and increases the apparent R2* that depends on imaging parameters including voxel size, field strength and echo time.4 The strong fat contribution to R2* may explain the correlation between the lesional R2* measurements and the fat percentages (Fig. 3a). As expected, lesion susceptibility values measured on fat corrected QSM were correlated with neither fat percentages (Fig. 3b) nor R2* values (Fig.5b). Avoiding focal lesions and vascular structures, ROI measurements demonstrated a high correlation between QSM and R2* (Figs. 4p&5a).
In summary, QSM overcomes confounding factors in R2* for mapping liver iron content.
Acknowledgements
No acknowledgement found.References
1. Dong J, Liu T, Chen F, et al. Simultaneous phase unwrapping and removal of chemical shift (SPURS) using graph cuts: application in quantitative susceptibility mapping. IEEE transactions on medical imaging. 2015;34(2):531-40.
2. Dimov AV, Liu T, Spincemaille P, et al. Joint estimation of chemical shift and quantitative susceptibility mapping (chemical QSM). Magnetic resonance in medicine. 2015;73(6):2100-10.
3. Sharma SD, Hernando D, Horng DE, Reeder SB. Quantitative susceptibility mapping in the abdomen as an imaging biomarker of hepatic iron overload. Magnetic resonance in medicine. 2015;74(3):673-83.
4. Hernando D, Kramer JH, Reeder SB. Multipeak fat-corrected complex R2* relaxometry: theory, optimization, and clinical validation. Magnetic resonance in medicine. 2013;70(5):1319-31.
Figures