1210
Magnetic Susceptibility Anisotropy of Collagen Fibrils in the Articular Cartilage1Department of Electrical Engineering and Computer Sciences, University of California, Berkeley, Berkeley, CA, United States, 2Center for In Vivo Microscopy, Duke University, Durham, NC, United States
Synopsis
Articular cartilage with depth dependent ultra-layer structure is constructed by collagen fibrils, which is shown by histology having three distinct layers: the fibrils are mostly parallel to the surface, randomly distributed and mostly oriented perpendicular to the surface in superficial zone, middle zone and deep zone, respectively. Quantitative susceptibility mapping is particularly sensitive to molecular content and cellular arrangement, thus is suitable to probe such highly organized microstructure and evaluate its magnetic susceptibility. Our study shows a clear B0-orientation-dependent susceptibility contrast in the articular cartilage and that the collagen fibril orientations can be well measured by susceptibility tensor imaging.
INTRODUCTION
Articular cartilage is a thin covering layer at the end of the bones in the joints. This depth dependent ultra-layer structure is essentially constructed by collagen fibrils, which is shown by histology having three distinct layers. These layers are: superficial zone, where the fibrils are mostly parallel to the surface; the middle zone, where the fibrils are relatively randomly distributed; the deep zone, where the fibrils are mostly oriented perpendicular to the surface. Quantitative susceptibility mapping (QSM)1-3 is particularly sensitive to molecular content, cellular arrangement and tissue microstructure, and thus may be suitable to probe such highly organized microstructure and evaluate its magnetic susceptibility at different depths with different physical fibril orientations. Our study shows a clear B0 field orientation-dependent magnetic susceptibility contrast in the articular cartilage and that the collagen fibril orientations can be well measured by susceptibility tensor imaging (STI)4.METHODS
All animal preparation protocols were approved by the University Institutional Animal Care and Use Committee. Fresh samples of two adult pig knee joints were obtained from a local abattoir. Central piece of each articular cartilage was removed from the femoral cartilage. The experiments were performed using a 9.4-T vertical bore Oxford magnet. The specimen cartridge was placed inside a sphere, allowing for an arbitrary specimen orientation inside the coil. Magnitude and phase data were acquired using a 3D GRE sequence with 15 echoes (TE1/𝛥TE/TE15=10/2/38 ms). TR=150 ms, flip angle=35°, matrix size=150×150×150, isotropic voxel size=100 μm, total scan time per orientation=40 mins. The specimen was repositioned in a new orientation prior to every image acquisition. To assess the B0 orientation dependence of magnetic susceptibility, 15 image orientations were acquired for each specimen. The raw phase was processed by Laplacian-based phase unwrapping and V_SHARP background phase removal5. The susceptibility tensor was calculated using STISuite software (http://people.duke.edu/~cl160/). The eigenvalues of the susceptibility tensor (χ1, χ2, χ3), mean susceptibility=(χ1+χ2+χ3)/3, magnetic susceptibility anisotropy (MSA) given by 𝛥χ=χ1–(χ2+χ3)/2 were calculated.RESULTS
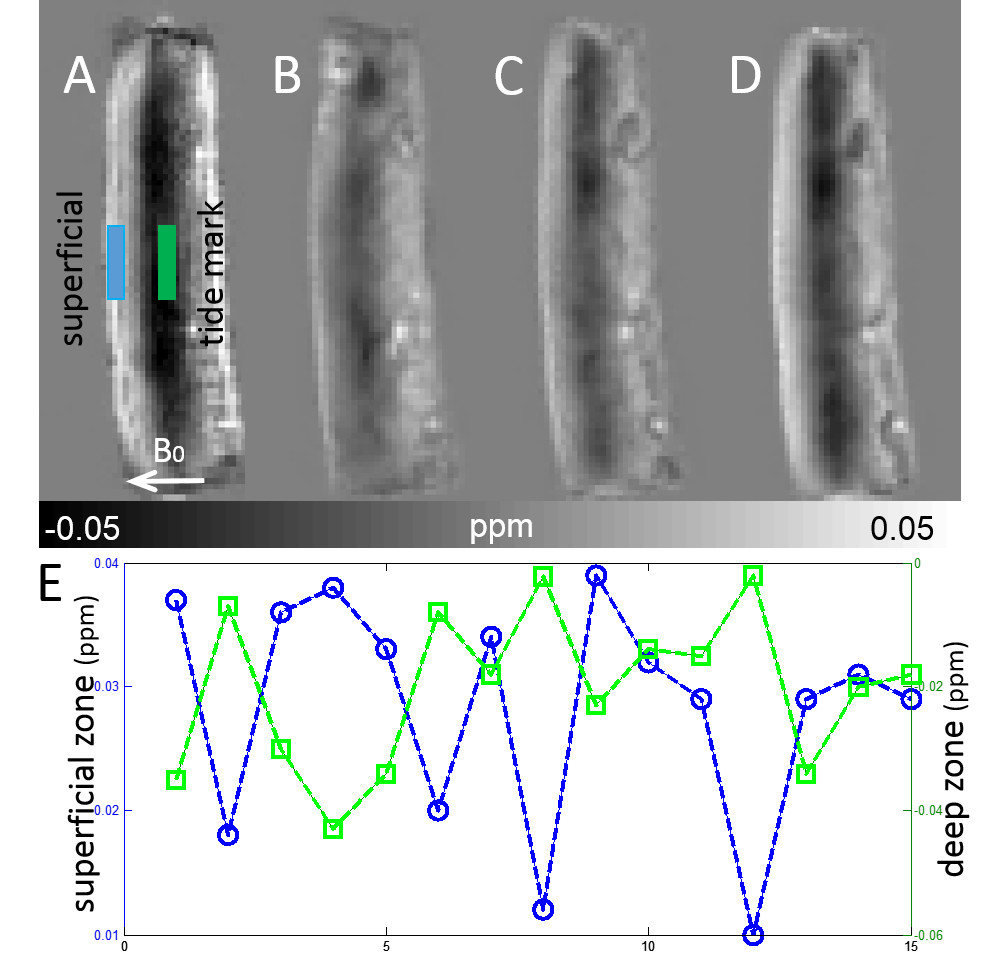
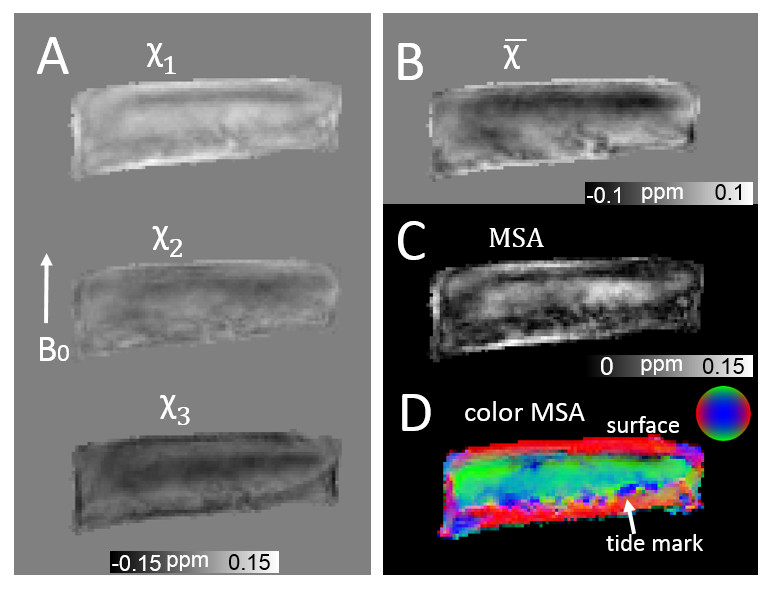
Fig. 1 shows examples of susceptibility maps acquired at different orientations. The susceptibility maps exhibited local contrast specific to different cartilage layers, which showed significant dependence on collagen fibril orientation relative to B0. Specifically, the cartilage exhibits a paramagnetic susceptibility within superficial zone where collagen fibrils are mainly perpendicular to B0 (Fig.1A). On the other hand, the susceptibility is relative diamagnetic in the deep zone where the collagen fibrils are mainly parallel to B0. Plots of susceptibility measurements as a function of orientation in the superficial zone (blue box) and deep zone (green box) are shown in Fig.1E. The B0-orientation-dependent susceptibility contrast is clearly observed in each of these layers. With STI, the measured susceptibility tensor is decomposed into three eigenvectors and three associated eigenvalues, denoted as χ1, χ2, χ3, as in a descending order. Examples of eigenvalue maps, mean susceptibility and MSA are shown in Fig.2. The MSA is further color coded based on the direction of the eigenvector associated with tertiary (most diamagnetic) susceptibility (Fig.2D). The predominant orientation of the eigenvectors is parallel to the cartilage surface in the superficial zone. Similarly, in an ribbon-like area close to the tide mark a predominantly tangential alignment of the eigenvectors can be seen. In between these two regions, covering an area of about 60% of the total thickness of the cartilage, the predominant orientation of the eigenvectors is perpendicular to the cartilage surface.DISCUSSION and CONCLUSION
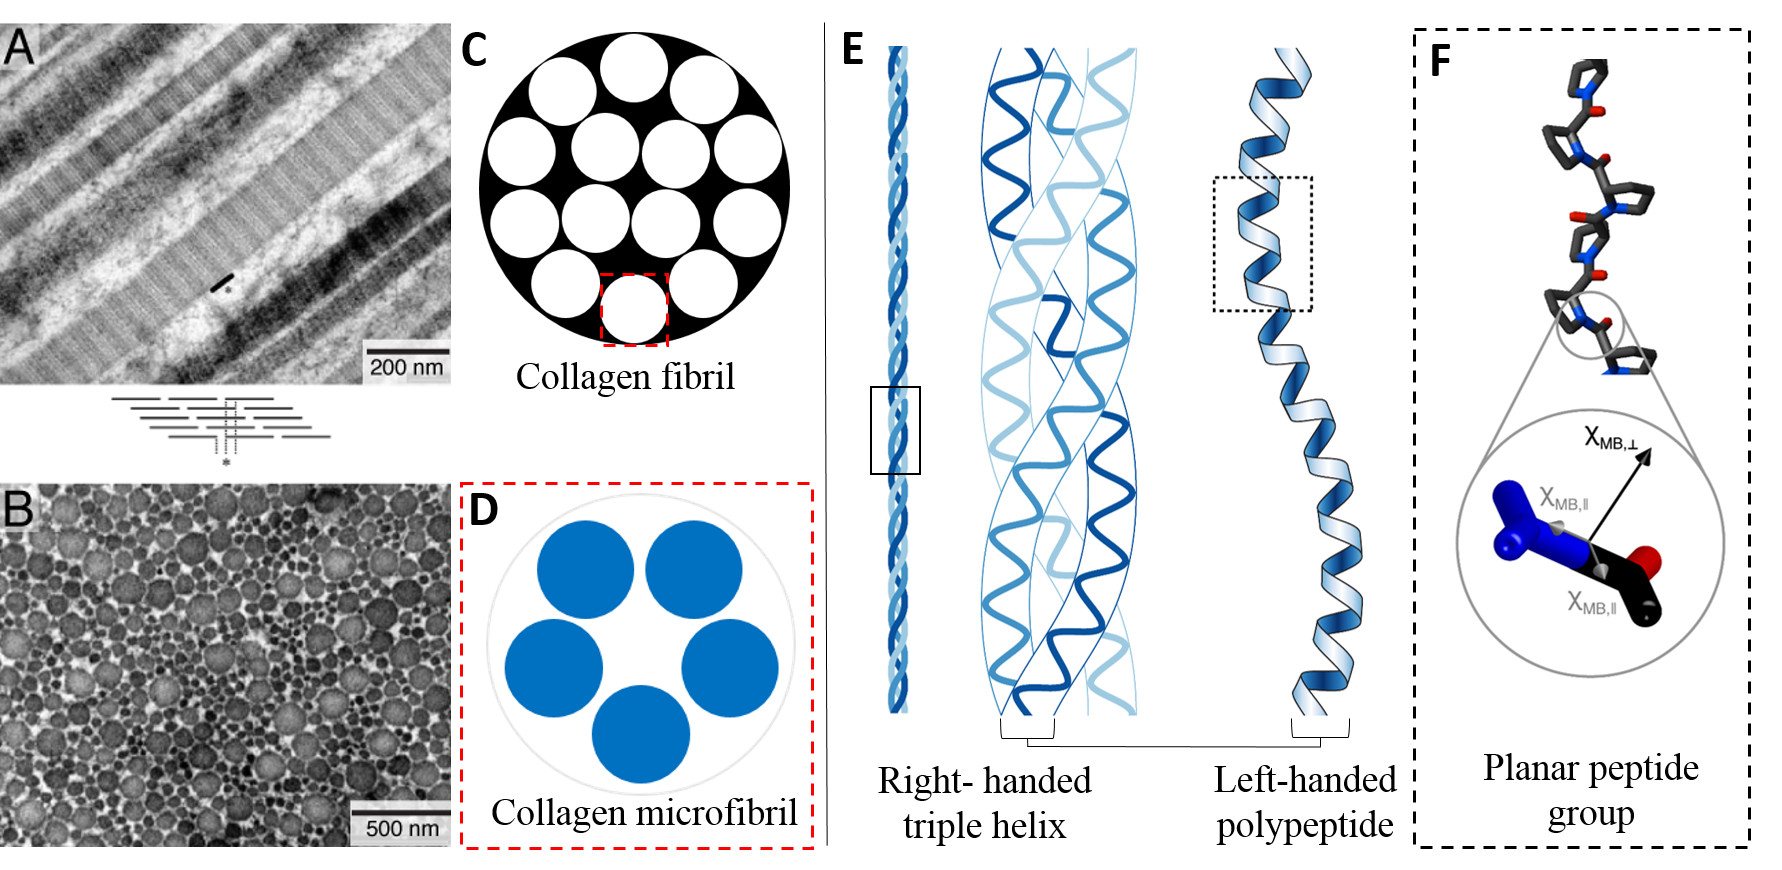
Our study shows that susceptibility anisotropy within articular cartilage produces particularly interesting magnetic susceptibility contrast. When collagen fibrils are mostly oriented perpendicular to B0 field, the susceptibility values are more paramagnetic, e.g. in the superficial zone. When collagen fibrils are mostly parallel to B0 field, the susceptibility values become more diamagnetic, e.g. in the deep zone. The macroscopic susceptibility anisotropy of collagen comes from the diamagnetic anisotropy of the peptide group at the molecular level. The collagen triple helix contains peptide group planes oriented at approximately 45° to the fibril axis6. Because the most diamagnetic susceptibility is oriented normal to the peptide group plane, the net susceptibility of collagen fibrils is most diamagnetic in the direction parallel to the fibril axis (Fig.3). This trend is the opposite of the susceptibility anisotropy observed in brain white matter. Our results show that QSM and STI are promising tools to investigate magnetic susceptibility anisotropy of collagen fibrils in the articular cartilage which opens a new clinical application to diagnose and evaluate different knee diseases.Acknowledgements
No acknowledgement found.References
1. Dibb R, Xie L, Wei H, Liu C. Magnetic susceptibility anisotropy outside the central nervous system. NMR in Biomedicine 2016.
2. Liu C, Wei H, Gong N-J, Cronin M, Dibb R, Decker K. Quantitative Susceptibility Mapping: Contrast Mechanisms and Clinical Applications. Tomography: a journal for imaging research 2015;1(1):3-17.
3. Wei H, Xie L, Dibb R, Li W, Decker K, Zhang Y, Johnson GA, Liu C. Imaging whole-brain cytoarchitecture of mouse with MRI-based quantitative susceptibility mapping. NeuroImage 2016;137:107-115.
4. Liu C. Susceptibility tensor imaging. Magnetic resonance in medicine 2010;63(6):1471-1477.
5. Li W, Wu B, Avram AV, Liu C. Magnetic susceptibility anisotropy of human brain in vivo and its molecular underpinnings. Neuroimage 2012;59(3):2088-2097.
6. Brodsky B, Ramshaw JA. The collagen triple-helix structure. Matrix Biology 1997;15(8):545-554.
Figures