1209
Discrimination of volumes with positive and negative functional QSM activation within fMRI-positive volumes in high-resolution, high-field task-based and resting-state dataPinar Senay Özbay1,2, Lars Kasper2, Klaas Paul Pruessmann2, and Daniel Nanz1
1Department of Radiology, University Hospital Zürich, Zurich, Switzerland, 2Institute of Biomedical Engineering, ETH Zürich, Zurich, Switzerland
Synopsis
In this work, we wanted to explore the bidirectional activation in functional Quantitative Susceptibility Mapping (fQSM) via Independent Component Analysis (ICA) in various cases, hence we included i) visual paradigm, ii) motor task and iii) resting state experiments with high-resolution data acquired at 7-Tesla. We investigated the behavior in terms of activation patterns and temporal evaluations of functional-PHASE, fQSM and traditional fMRI. Furthermore, we compared regions of activation with phase-contrast-angiography data. In all scenarios, we have found out that the total (positive + negative) activated area in fQSM was well matching with positive activation in fMRI.
Purpose
Our aim was to explore the consistently reported patterns of apparent positive and negative activations, derived via independent-component-analysis (ICA), in high-resolution functional QSM (fQSM1-3) acquired at 7-Tesla and to compare them with fMRI results, using phase-contrast-angiograms for identification of large vessels. Statistical maps were generated from magnitude, phase, and susceptibility data collected during visual and motor task, and resting-state experiments.Materials & Methods
Experiment Gradient-echo-2D-EPI (TR=3s, TE=25ms,
FA=850, SENSE=3.5, voxel-dimensions=1.25x1.25x1.3mm,
reconstructed-matrix=176x176x34) images of 4 consenting volunteers were
acquired at 7-Tesla (Philips). The scan was repeated to acquire
whole-brains with 160 slices. T1-Contrast-Anatomical-Scan 3D-inversion-recovery
gradient-echo, TR=8.2ms, TE=3.79ms, FA=80, voxel-dimensions=0.94x0.94x1mm, Phase-Contrast-Angiography
(PCA) 3D-Gradient-echo, TR=35.9ms, TE=7ms, FA=100,
voxel-dimensions=0.9x0.9x0.9mm, VENC=15cm/sec. The paradigm4 required volunteers to first fix a projected cross for 9s.
Subsequently, 10 blocks of upper-left/lower-right (ULLR) and
upper-right/lower-left (URLL) color-changing wedges were presented over 200
EPI-scans. For motor-task, they were asked to perform a simple button-response
task, i.e. right button press once they see the cross pointing right, or vice
versa (event-related). Resting-state experiments were acquired with the same sequence parameters
as the task experiment. QSM-Processing
Phase data were unwrapped via the Laplacian approach5, and background-field-corrected via a variant of SHARP with
variable spherical kernels (V-SHARP6, 7, Rmax=12.5mm,
threshold=0.012mm-1). By means of field
to susceptibility dipolar-inversion, QSM images were
generated using an LSQR8, and a
threshold-based k-space division (TKD)9 algorithms. A temporal-band-pass-filter [0.01-0.11Hz] was applied to fQSM data. Functional-Processing
The sign of QSM data was inverted and the minimum value over all-time series
was subtracted from each pixel value for QSM and SHARP data. The processed
series of phase, QSM and magnitude data were normalized to MNI-space with 1.8mm
isotropic-voxel-size, smoothed with a 2.5mm-Gaussian-kernel, and denoted as
fPHASE, fQSM and fMRI, respectively. The data were subject to the
spatial-domain ICA (FAST-ICA, GIFT10), allowing 20
components. Number of voxels in thresholded z-score maps were counted, in
volumes-of-interest, i.e. in the visual cortex, in the thresholded-PCA, and in
automatically segmented gray-matter.Results
Single-voxel time-courses of the raw-phase showed large discontinuities that were eliminated during unwrapping and background-field-removal. While the SHARP-signal time-courses faintly resembled that of the magnitude, there was a much better similarity with that of the (-)QSM data (Fig. 1). Figure-2 shows patterns of positive and negative activations in fQSM (ULLR, |Z|>1.2). Activation maps for fPHASE (first row, hot & blue), fQSM (second and third row, hot & blue), and fMRI (green) are compared in Figure-3. Positive (hot) and negative (blue) patterns were also observed in z-score maps derived from corrected phase data (top, Fig. 3). After dipolar-inversion (fQSM), the area of apparent activation was more focused in the region expected according to the paradigm (white dotted-circle, Fig. 3). Some activations in fPHASE data that did not exist in fMRI data were eliminated by the dipolar inversion (white arrows, fPHASE). The total activated area (hot + blue) in fQSM data matched better with the area of positive fMRI activation (green), than it did in fPHASE. A slightly more confined activated area was observed in LSQR derived fQSM results vs. TKD. Figure-3 shows single-voxel signal time-courses for voxels (thick arrows), i.e. one voxel with positive z-scores in both fQSM (hot) and fMRI and one voxel with a negative z-score in fQSM (blue) and positive in fMRI. Components related to the visual and motor network are shown for fMRI (green, Z>1.2), fQSM (positive (hot), negative (blue), |Z|>1.2), and overlaid with thresholded-PCA (Figure 4b-c). For this specific subject, the ratio of commonly activated voxels of fQSM (|Z|>1.2) and fMRI (Z>1.2) with respect to the number of voxels in fQSM was ~40%, for both ULLR and URLL stimulation. The percentage of activated voxels in thresholded-PCA regions vs. total activated voxels was ~30%, and in the segmented gray-matter regions ~65%, for both fQSM (|Z|>1.2) and fMRI (Z>1.2). As observed in task cases, for resting state experiment, the area of visual network activation in fMRI (Z>1.2) is separated into regions of positive (Z>1.2) and negative (Z<-1.2) activation in fQSM (Fig.5).Discussion
ICA-based
fQSM analysis detected areas of significant positive and negative activations
within areas of positive fMRI activation both in task-based and resting-state
experiments. In contrast, there were no voxels with such a statistically
significant negative activation in the fMRI z-score maps. Understanding the
underlying reason for the differentiation of the apparent homogeneous positive
fMRI activation in positive and negative fQSM activations needs further
investigation, potentially in combination with other methods, such as measuring
blood flow to understand counterbalancing effects to oxygenation. Furthermore,
if it is of physiological origin, fQSM might offer unique opportunities, e.g.,
for disentangling variations in the hemodynamic response and neuronal
activation.Acknowledgements
No acknowledgement found.References
1. Balla DZ, Sanchez-Panchuelo RM, Wharton SJ, Hagberg GE, Scheffler K, Francis ST et al. Functional quantitative susceptibility mapping (fQSM). NeuroImage 2014; 100: 112-24. 2. Ozbay PS, Warnock G, Rossi C, Kuhn F, Akin B, Pruessmann KP et al. Probing neuronal activation by functional quantitative susceptibility mapping under a visual paradigm: A group level comparison with BOLD fMRI and PET. NeuroImage 2016; 137: 52-60. 3. Chen Z, Liu J, Calhoun VD. Susceptibility-based functional brain mapping by 3D deconvolution of an MR-phase activation map. Journal of neuroscience methods 2013; 216(1): 33-42. 4. Kasper L, Haeberlin M, Dietrich BE, Gross S, Barmet C, Wilm BJ et al. Matched-filter acquisition for BOLD fMRI. NeuroImage 2014; 100: 145-60. 5. Schofield MA, Zhu Y. Fast phase unwrapping algorithm for interferometric applications. Optics letters 2003; 28(14): 1194-6. 6. Schweser F, Sommer K, Deistung A, Reichenbach JR. Quantitative susceptibility mapping for investigating subtle susceptibility variations in the human brain. NeuroImage 2012; 62(3): 2083-100. 7. Özbay PS, Deistung A, Feng X, Nanz D, Reichenbach JR, Schweser F. A comprehensive numerical analysis of background phase correction with V-SHARP. NMR in biomedicine 2016. 8. Li W, Wu B, Liu C. Quantitative susceptibility mapping of human brain reflects spatial variation in tissue composition. NeuroImage 2011; 55(4): 1645-56. 9. Özbay PS, Rossi C, Kocian R, Redle M, Boss A, Pruessmann KP et al. Effect of respiratory hyperoxic challenge on magnetic susceptibility in human brain assessed by quantitative susceptibility mapping (QSM). NMR in biomedicine 2015; 28(12): 1688-96. 10. Calhoun VC. Group ICA of fMRI Toolbox (GIFT). Available at: http://icatb.sourceforge.net. 2004.Figures
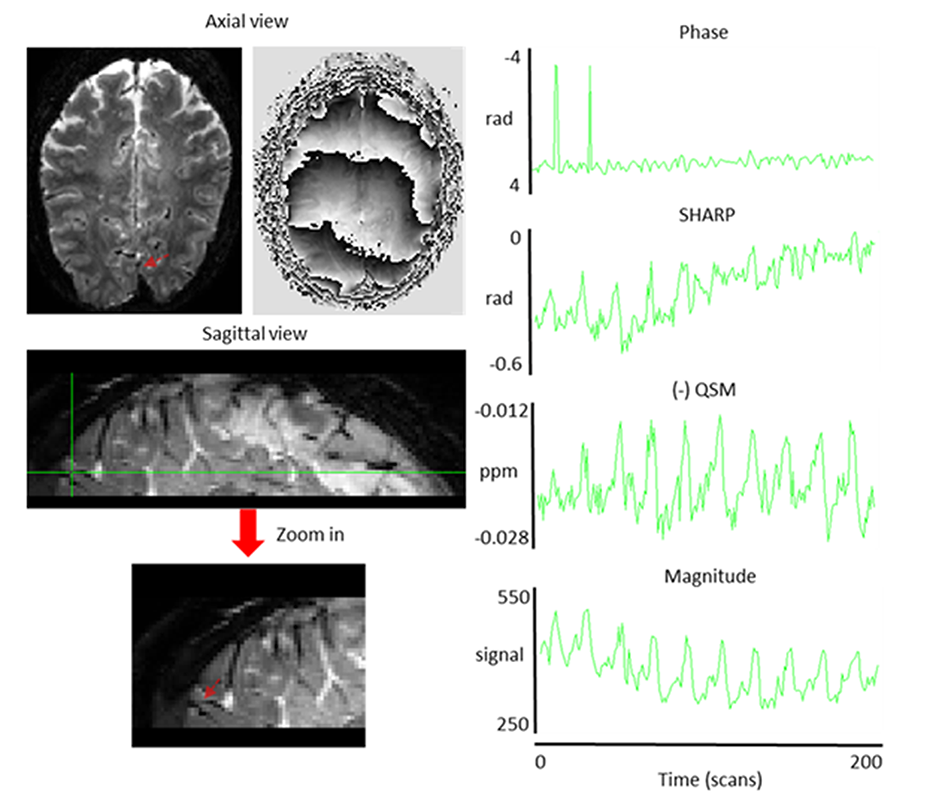
Figure 1: Magnitude
(left) and phase (middle) [-3.14 3.14 rad] images from a single scan during the visual-motor
experiment of subject 1. Red
arrows show the voxel, from which the signal time courses on the right were extracted.
The sign of QSM data was inverted for
visualization purposes.
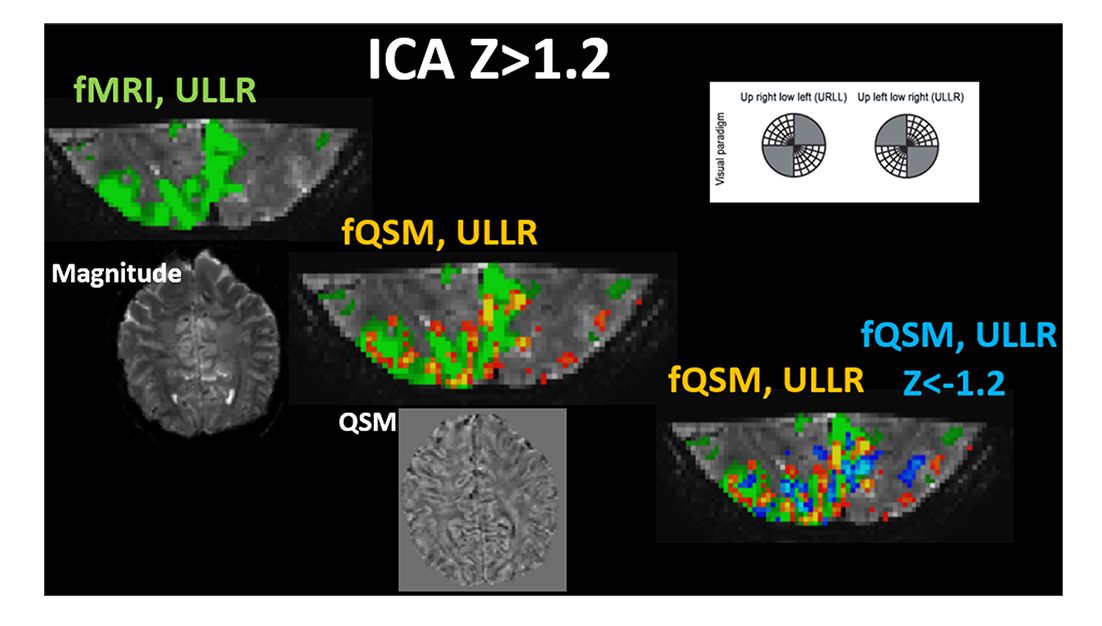
Figure 2: ULLR visual components derived via ICA fMRI (left most, green) (Z > 1.2), fQSM
(middle, positive (hot), Z>1.2), and fQSM with negative scores (right, positive (hot) & negative (blue), |Z|>1.2) on EPI magnitude
images. Axial images show exemplary slices from Magnitude (left most) and QSM
(middle) series. Results from subject 2.
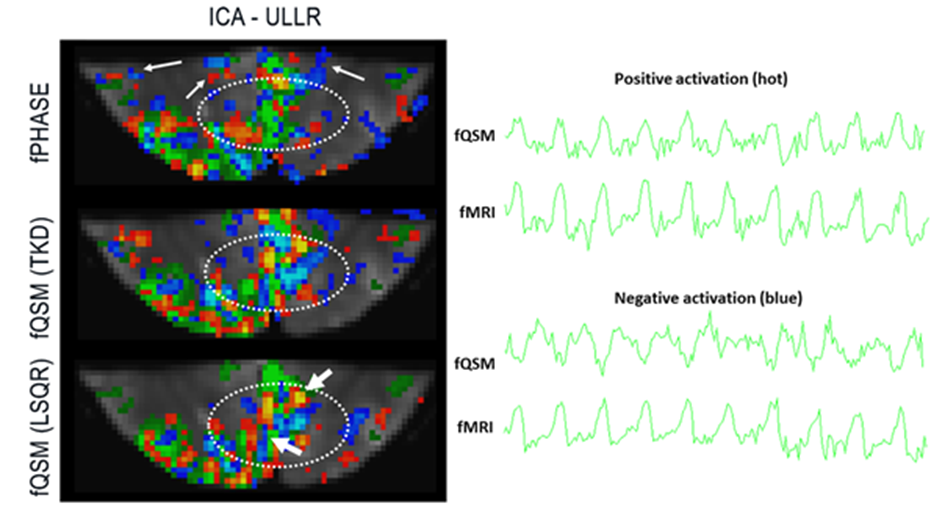
Figure 3: (left) Activation
maps for fPHASE (first row, hot & blue, |Z|>1.2), fQSM (second and third
row, positive (hot) & negative (blue), |Z|>1.2), overlaid on fMRI (green, Z>1.2), and EPI
magnitude image. (right) Temporal signal changes corresponding to voxel shown
via thick arrows, (top) a common voxel in positive Z-score of fQSM (hot) and
fMRI, and (bottom) a common voxel in negative Z-score in fQSM (blue) and
positive in fMRI. Results from subject 2.
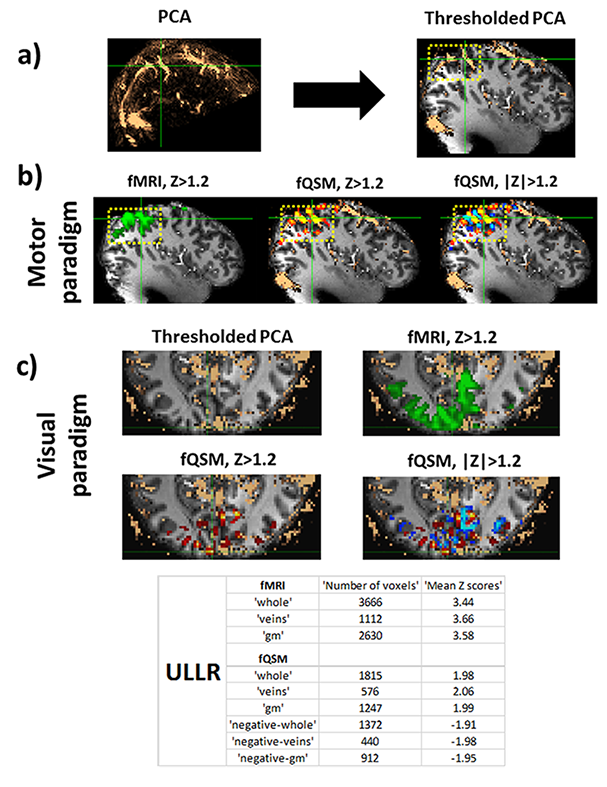
Figure 4: a) Phase contrast
angiography in MNI-space, thresholded and overlaid on T1w image, b) Motor
components derived via ICA (left most) fMRI (green) (Z > 1.2), (middle) fQSM
(positive (hot), Z > 1.2), (right) fQSM with negative scores (positive (hot) & negative (blue), |Z|
> 1.2) overlaid with thresholded-PCA, c) (top left) Thresholded-PCA, axial
view, (top right) fMRI (green) (Z > 1.2), (bottom left) fQSM (hot) (Z >
1.2), and (bottom right) fQSM (positive (hot) & negative (blue), |Z|> 1.2). Number of voxels
and mean z-scores in volumes of interest are given in embedded table. Results
from subject 2. gm: gray-matter.
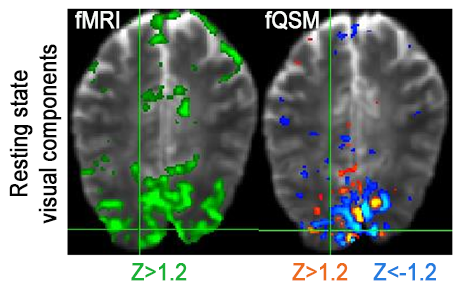
Figure 5: Resting state, visual
components derived via ICA (left) fMRI (green) (Z > 1.2), (right) fQSM (positive (hot)
& negative (blue)) (|Z| > 1.2) overlaid on EPI magnitude images. Results from
subject 1.