1208
Correlations of beta-Amyloid and brain iron load (QSM): preliminary results of simultaneous assessment in a large sample1Institute for Regenerative Medicine, University of Zurich, Zurich, Switzerland, 2F.M. Kirby center for Functional Brain Imaging, Kennedy Krieger Institute and Johns Hopkins School of Medicine, MD, United States, 3Department of Nuclear Medicine, University of Zurich, Switzerland
Synopsis
To extend findings on the use of QSM in Alzheimer’s Disease and possible direct interactions with Amyloid-β, this study is investigating a growing sample of elderly subjects using simultaneous assessment of Amyloid-PET for Aβ-load and QSM for estimation of iron load (indicated by susceptibility) using a combined PET-MRI instrument.
Our preliminary data suggests a significant correlation between susceptibility and Aβ in subjects with high brain Aβ load or clinically diagnosed Mild Cognitive Impairment, in several cortical and sub-cortical regions. The sample is expected to grow considerably in the upcoming months.
Introduction
Quantitative Susceptibility Mapping (QSM) has been used to infer on cerebral iron accumulation in several neurodegenerative diseases, including Alzheimer's disease1 (AD), Multiple Sclerosis2,3, Huntington’s disease4 and Parkinson’s disease5. While the accumulation of cerebral beta-Amyloid (Aβ) is a neuropathological hallmark in AD, which can be measured in cognitively healthy elderly subjects long before manifestation of clinical symptoms6, several studies also report increases in iron throughout the brain7–9. Moreover, associations between Aβ and iron using QSM (or other iron-sensitive techniques such as phase- or R2*-mapping) have been reported earlier1,10,11. To extend findings of the use of QSM in AD and possible direct interactions with Aβ, this study is investigating a growing sample of elderly subjects using simultaneous assessment of 18F-Flutemetamol-PET for Aβ-load and QSM for estimation of iron load (indicated by susceptibility). Currently our sample consist of 80 adults, including 6 subjects clinically diagnosed with Mild Cognitive Impairment (MCI) and 44 Super-Agers (subjects over the age of 85 without cognitive impairments). The sample is expected to grow considerably in the upcoming months.Methods
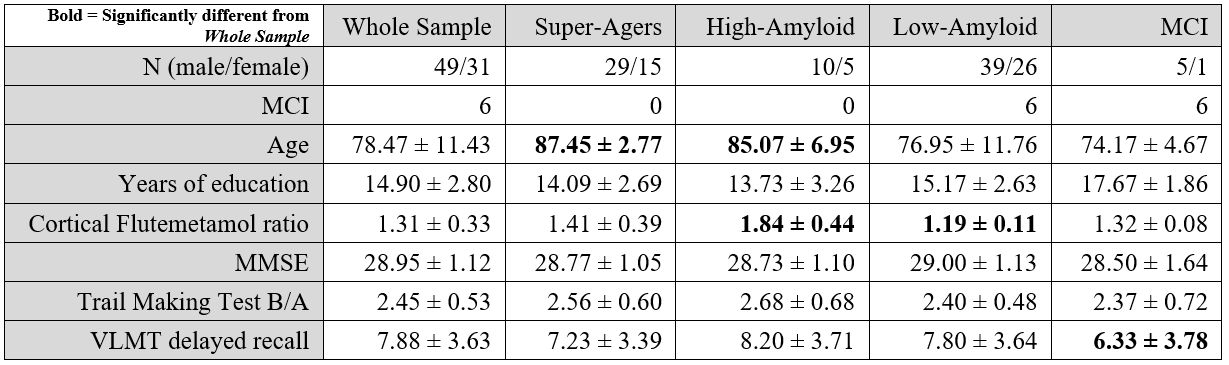
80 elderly individuals (Figure 1) were studied using a 3T SIGNA General-Electrics Healthcare combined PET-MR instrument. All participants received medical and psychiatric examination, as well as standardized neuropsychological assessment to assure normal cognitive function in cognitive subdomains. Significant brain pathologies were excluded by visual inspection of MRI-scans (by P.G.U.). A T1-weighted BRAVO image (TI=450ms, voxel size=1x1x1mm3, flip-angle=12°, ASSET factor=2) was acquired for segmentation using a multi-atlas approach12,13. In total 43 bilateral gray matter regions were selected as regions of interest (ROIs) which were eroded by 2 pixels before being applied as a mask in further processing. QSM images were reconstructed from a 3D multi-echo GRE sequence (TR/TE/ΔTE=40/6/4ms, voxel size=1x1x1mm3, flip angle=15°, bandwidth=±62.5 kHz, flow compensated, ASSET factor=2) using the echoes with echo time between 15 and 27ms. Sequentially, Laplacian phase unwrapping, V-SHARP for background removal14 and an iLSQR based approach for dipole inversion15 were used to create the QSM image. After removal of the background field, the resulting images of the 4 echoes were averaged16. Deep frontal white matter was selected as a reference region for the final susceptibility quantification. All reported susceptibility values are relative to this reference region. Aβ-plaque density was estimated by PET acquisition of 18F-Flutametamol17 (85-105 minutes post injection) and reconstructed using time-of-flight reconstruction (voxel size=1.2x1.2x2.78mm3). The PET image was segmented using the parcellation created from the T1-weighted image and all PET-values were referenced to the cerebellar gray matter, resulting in regional, referenced standardized uptake values (SUVR) . Single measure of individual cortical Aβ-plaque-density for each subject was determined as the average of a number of cortical gray matter ROIs18. In order to investigate subjects with a high-Aβ-plaque density separately from subjects with low-Aβ-plaque density, a cutoff was determined at SUVR=1.51, as reported earlier17. Regression analysis was performed on the whole sample and sub-populations separated by Super-Ager status, Aβ burden or MCI status while correcting for age and gender. All p-values obtained from regression analysis were corrected using False Discovery Rate (FDR) correction19 to correct for multiple testing errors. Correlations were deemed significant if p-FDR-corrected < 0.05 and Spearman Correlation coefficient (rs) > 0.5.Results
Within the studied sample, 15 subjects where categorized as high-Aβ-plaque density, and 65 as low-Aβ-plaque density. Age was significantly higher in the high versus low Aβ-plaque density group, and in the Super-Agers compared to the rest of the studied population. There was no significant difference in memory performance observable, as indicated by VLMT score (Figure 1).
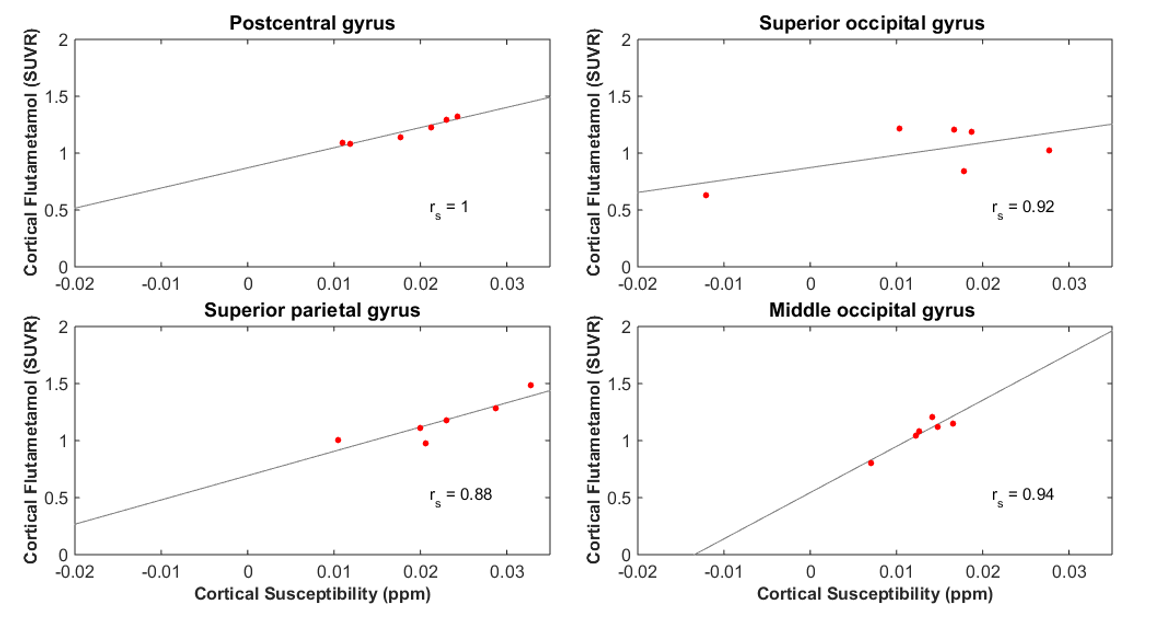
In sub-populations based on Super-Ager status or low-Aβ burden no significant local correlations between Aβ and susceptibility were found. In subjects with clinical MCI diagnosis 4 cortical regions showed strong correlations (Figure 2).
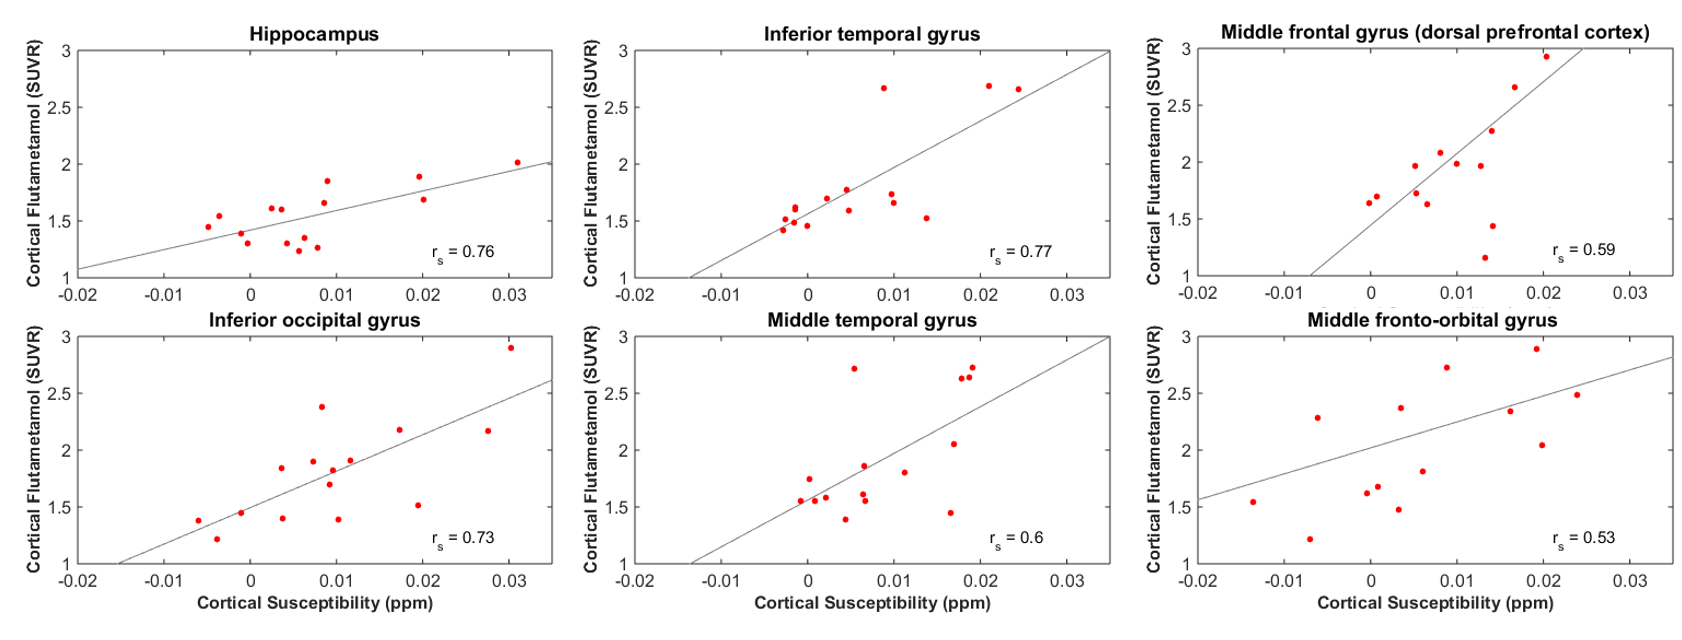
In the subjects with a high Aβ burden, the hippocampus and 5 regions in the frontal, temporal and occipital cortices (Figure 3) showed significant correlations.
Discussion
The reported preliminary data suggests a significant correlation between susceptibility and Aβ in subjects with high brain Aβ load and subjects with clinical MCI diagnosis. While increased Aβ and neurodegeneration have been reported to synergistically act on cognitive decline in clinically normal individuals20, further studies are needed to investigate whether susceptibility is a valid measure for these neurodegenerative alterations. While our data indicates significant correlation in hippocampal and neocortical regions for the MCI sub-population, recruitment is still going on to corroborate findings and allow for confirmative comparison with previous work11.Acknowledgements
No acknowledgement found.References
1. Acosta-Cabronero, J. et al. In vivo quantitative susceptibility mapping (QSM) in Alzheimer’s disease. PLoS One 8, e81093 (2013).
2. Wisnieff, C. et al. Quantitative susceptibility mapping (QSM) of white matter multiple sclerosis lesions: Interpreting positive susceptibility and the presence of iron. Magn. Reson. Med. 74, 564–570 (2015).
3. Zhang, Y. et al. Longitudinal change in magnetic susceptibility of new enhanced multiple sclerosis (MS) lesions measured on serial quantitative susceptibility mapping (QSM). J. Magn. Reson. Imaging 44, 426–432 (2016).
4. Lim, I. A. L. et al. Quantitative Magnetic Susceptibility Mapping in Prodromal Huntington ’ s Disease Subjects. 21, 51909 (2013).
5. Langkammer, C. et al. Quantitative Susceptibility Mapping in Parkinson’s Disease. PLoS One 11, e0162460 (2016).
6. Mintun, M. a. et al. [11C]PIB in a nondemented population: Potential antecedent marker of Alzheimer disease. Neurology 67, 446–452 (2006).
7. Zecca, L., Youdim, M. B. H., Riederer, P., Connor, J. R. & Crichton, R. R. Iron, brain ageing and neurodegenerative disorders. Nat. Rev. Neurosci. 5, 863–873 (2004).
8. Wood, H. Alzheimer disease: Iron--the missing link between ApoE and Alzheimer disease? Nat. Rev. Neurol. 11, 369 (2015).
9. Meadowcroft, M. D., Connor, J. R., Smith, M. B. & Yang, Q. X. MRI and histological analysis of beta-amyloid plaques in both human Alzheimer’s disease and APP/PS1 transgenic mice. J. Magn. Reson. Imaging 29, 997–1007 (2009).
10. van Rooden, S. et al. 7T T2(∗)-weighted magnetic resonance imaging reveals cortical phase differences between early- and late-onset Alzheimer’s disease. Neurobiol. Aging 36, 1–7 (2014).
11. van Bergen, J. M. G. et al. Colocalization of cerebral iron with Amyloid beta in Mild Cognitive Impairment. Sci. Rep. 6, 35514 (2016).
12. Tang, X. et al. Bayesian Parameter Estimation and Segmentation in the Multi-Atlas Random Orbit Model. PLoS One 8, e65591 (2013).
13. Lim, I. A. L. et al. Human brain atlas for automated region of interest selection in quantitative susceptibility mapping: Application to determine iron content in deep gray matter structures. Neuroimage 82, 449–469 (2013).
14. Schweser, F., Deistung, A., Lehr, B. W. & Reichenbach, J. R. Quantitative imaging of intrinsic magnetic tissue properties using MRI signal phase: An approach to in vivo brain iron metabolism? Neuroimage 54, 2789–2807 (2011).
15. Li, W. et al. A method for estimating and removing streaking artifacts in quantitative susceptibility mapping. Neuroimage 108, 111–122 (2015).
16. Wu, B., Li, W., Avram, A. V., Gho, S. M. & Liu, C. Fast and tissue-optimized mapping of magnetic susceptibility and T2* with multi-echo and multi-shot spirals. Neuroimage 59, 297–305 (2012).
17. Vandenberghe, R. et al. 18F-flutemetamol amyloid imaging in Alzheimer disease and mild cognitive impairment a phase 2 trial. Ann. Neurol. 68, 319–329 (2010).
18. Gietl, A. F. et al. Regional cerebral blood flow estimated by early PiB uptake is reduced in mild cognitive impairment and associated with age in an amyloid-dependent manner. Neurobiol. Aging 36, 1619–1628 (2015).
19. Benjamini, Y. & Hochberg, Y. Controlling the False Discovery Rate: A Practical and Powerful Approach to Multiple Testing. Journal of the Royal Statistical Society. Series B (Methodological) 57, 289–300 (1995).
20. Mormino, E. C. et al. Synergistic effect of β-amyloid and neurodegeneration on cognitive decline in clinically normal individuals. JAMA Neurol. 71, 1379–85 (2014).
Figures