1207
Assessing the cellular distribution of iron in deep gray matter based on R2* and Quantitative Susceptibility Mapping (QSM) - Application to healthy controls and patients with Multiple Sclerosis (MS)1Buffalo Neuroimaging Analysis Center, Department of Neurology, Jacobs School of Medicine and Biomedical Sciences, University at Buffalo, The State University of New York, Buffalo, NY, United States, 2MRI Clinical and Translational Research Center, Jacobs School of Medicine and Biomedical Sciences, University at Buffalo, The State University of New York, Buffalo, NY, United States, 3MR Research Laboratory, IRCCS, Don Gnocchi Foundation ONLUS, Milan, Italy, 4BairdMS Center, Department of Neurology, Jacobs School of Medicine and Biomedical Sciences, The State University of New York at Buffalo, Buffalo, NY, United States
Synopsis
This work introduces a clinically applicable technique to assess the cellular distribution of iron based on R2* and Quantitative Susceptibility Mapping (QSM). The method was applied to 68 MS patients and 29 controls, showing significant differences in the cellular iron distribution with age and disability.
Purpose
R2* and Quantitative Susceptibility Mapping (QSM)1-4 are the most sensitive techniques currently available for assessing brain iron in vivo5,6. Clinical studies employing these methods have provided mounting evidence for a disturbance of the brain iron homeostasis in several neurological diseases7, including Multiple Sclerosis (MS)8. However, often neglected when interpreting group differences of R2* and magnetic susceptibility, neither of these measures depends only on the iron concentration; both measures are also sensitive to contributions from other sources and depend on the chemical form of iron, R2* also on its spatial distribution on a (sub-)cellular scale.
The present work introduces a clinically applicable technique to disentangle the information about the cellular distribution of iron, providing a novel tool to study brain iron homeostasis in vivo.
Theory
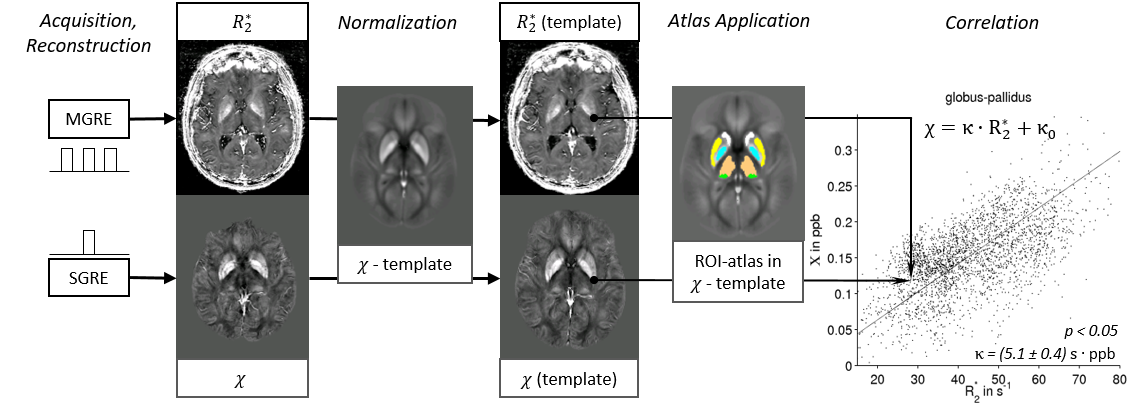
Both susceptibility, $$$\chi$$$, and R2* depend linearly on the concentration, $$$c_\mathrm{Fe}$$$, of paramagnetic tissue iron9,10: $$\chi=\alpha_\chi \cdot c_\mathrm{Fe} + \beta_\chi \quad\mathrm{and}\quad \mathrm{R}_2^*=\alpha_\mathrm{R} \cdot c_\mathrm{Fe} + \beta_\mathrm{R}.$$
The offsets, $$$\beta_\chi$$$ and $$$\beta_\mathrm{R}$$$, represent contributions from non-iron sources, such as myelin, complicating direct voxel-wise interpretation of either measure11. Furthermore, the mass susceptibility, $$$\alpha_\chi$$$, and relaxivity, $$$\alpha_\mathrm{R}$$$, are determined by the iron oxidation and spin state via the effective magnetic moment ($$$\propto \mu_\mathrm{Fe}^2$$$)9,10, and $$$\alpha_\mathrm{R}$$$ also depends on the susceptibility and effective size of iron-containing cells (besides diffusion, temperature, and B0)12. Due to similar functional dependencies, $$\kappa=\frac{\alpha_\chi}{\alpha_\mathrm R}$$ is independent of $$$\mu_\mathrm{Fe}$$$ and $$$c_\mathrm{Fe}$$$, depending on only the voxel-average ratio of the cell radius to the number of iron atoms per cell.
Methods
Subjects: This IRB-approved study enrolled a group of 68 MS patients (52.71±10.3 years mean±std; m:f 18:50; 44 RRMS, 6 RSPMS, 18 SPMS; EDSS median 2, IQR 0-6.5; average disease duration 18.9±10.1 years) and 29 age- and sex-matched healthy controls (HC; 52.1±11.1 years; m:f 9:20).
Data acquisition: Participants were imaged at 3T (GE Signa Excite HD 12.0) using a 3D single-echo gradient-echo (GRE) sequence (matrix 512x192x64, 256x192x128mm3, TE/TR=22ms/40ms, BW=13.9kHz, tip=12°) and a 3D multi-echo GRE sequence (matrix of 384x172x126, 240x180x126 mm3, TE1/ΔTE/TR=1.2ms/22ms/34.8ms, 11 echoes, BW=41.67 kHz, tip=15°). We reconstructed susceptibility maps from the single-echo GRE k-space using scalar-phase-matching13,14, gradient unwarping15, best-path unwrapping16, V-SHARP11,17,18, and HEIDI19. Logarithmic calculus with anisotropic diffusion filtering20 quantified R2* from the multi-echo images.
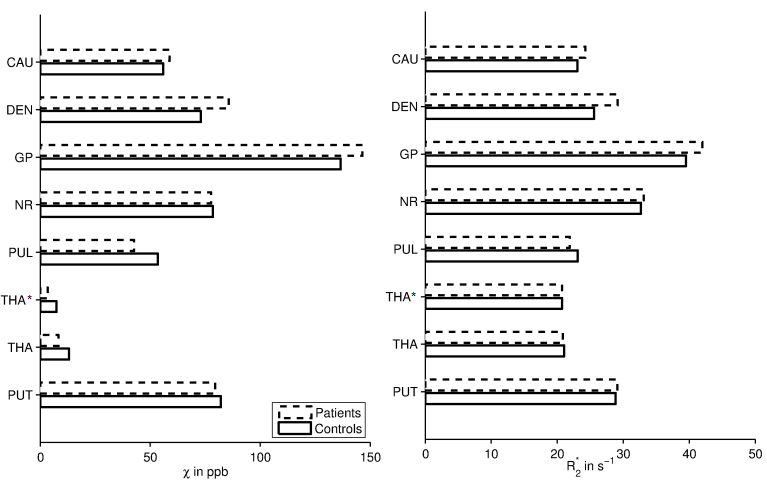
Analysis: ANTs normalized all maps to an in-house generated susceptibility brain template21, where an Atlas was applied with the following regions of interest (ROIs) in the deep gray matter (DGM): caudate (CAU), putamen (PUT), globus pallidus (GP), red nucleus (NR), dentate (DEN), pulvinar (PUL), thalamus-without-pulvinar (THA*), and whole-thalamus (THA). In each ROI, we calculated the means and standard deviations of $$$\chi$$$ and R2*. If voxel values of both measures correlated linearly within an ROI, we assumed intra-ROI variations of $$$\chi$$$ and R2* were due to different $$$c_\mathrm{Fe}$$$, allowing the determination of $$$\kappa$$$ for that ROI by linear total least-squares fitting. Figure 1 illustrates the procedure. Group comparisons relied on paired t-tests and two-sided Wilcoxon rank-sum tests, respectively, with p<0.05. Weighted (multi-)linear regression analysis characterized associations with age and disability in MS.
Results
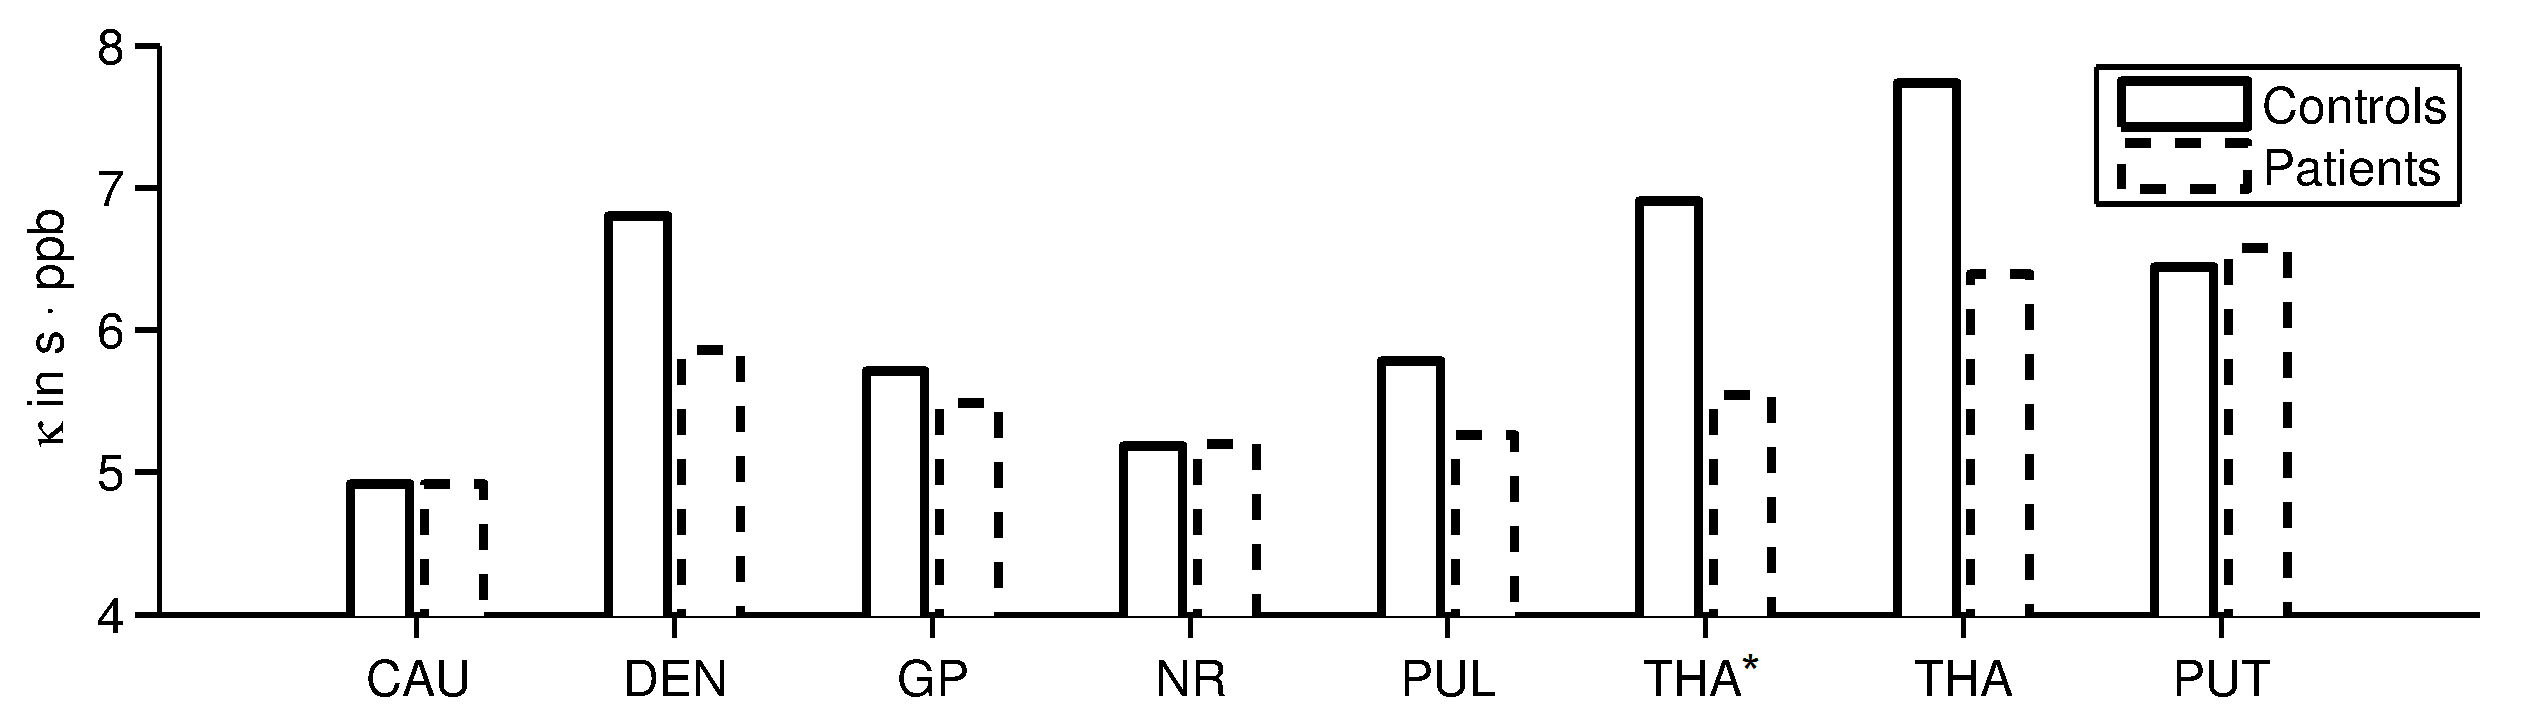
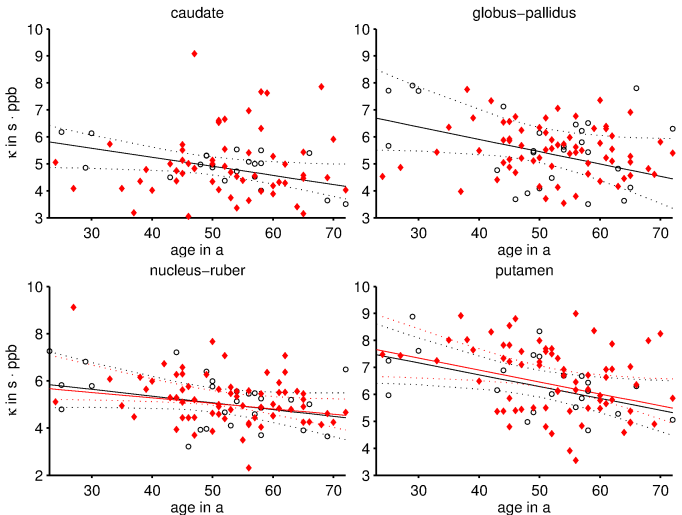
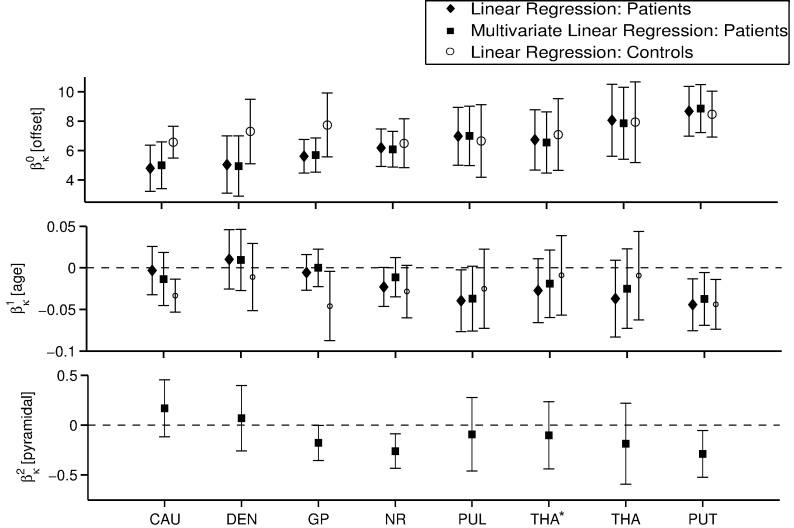
ROI-averages were in line with literature (Figure 2): Patients showed significantly greater $$$\chi$$$ and R2* in GP and DEN and lower $$$\chi$$$ in PUL and THA(*). In every ROI, >95% of subjects showed a linear correlation between $$$\chi$$$ and R2* (Figure 1). Obtained $$$\kappa$$$-values (Figure 3) were similar to previous, anecdotal reports22,23. The $$$\kappa$$$-values of most ROIs were lower in patients, but differences reached significance only in DEN and THA(*); the values correlated negatively with age in PUT, NR, CAU, and GP of HCs (Figure 4). Multivariate regression of $$$\kappa$$$ with age and the pyramidal EDSS-subscore (pEDSS) revealed a negative age-dependence in PUT and negative association with EDSS in GP, NR, and PUT (Figure 5).Discussion
The presented technique provides unique information about the cellular distribution of iron based on the (generally accepted) assumptions that intra-nuclear variations of $$$\chi$$$ and R2* are driven by changes of $$$c_\mathrm{Fe}$$$. Reducing $$$\kappa$$$ with age suggests that DGM-iron accumulation with aging24 is associated with increased loading of iron-containing cells (e.g. more ferritin/oligodendrocyte). Associations between pEDSS and $$$\kappa$$$ in NR and PUT suggest a disease-related re-distribution of iron (no proliferation) into fewer, but higher loaded cells. In the case of GP, disease-related mechanisms result in iron accumulation in existing cells.Conclusion
The presented technique provides information about brain iron homeostasis beyond iron concentration and independent of both iron’s chemical form and non-iron contributions. Since both $$$\chi$$$ and R2* may in principle be obtained from the same multi-echo GRE sequence, the technique has a high translational potential.Acknowledgements
We are grateful to Dr. Yi Wang and his team at the Cornell MRI Research Lab for providing the pulse sequence code for the multi-echo sequence.
Research reported in this publication was funded by a RISE (Research Internships in Science and Engineering) worldwide stipend of the German Academic Exchange Service (DAAD) awarded to Y.T. and by the National Center for Advancing Translational Sciences of the National Institutes of Health under Award Number UL1TR001412. The content is solely the responsibility of the authors and does not necessarily represent the official views of the NIH.
References
[1] C. Liu, W. Li, K. A. Tong, K. W. Yeom, and S. Kuzminski, “Susceptibility-weighted imaging and quantitative susceptibility mapping in the brain,” J Magn Reson Imaging, 42(1):23–41, 2015.
[2] E. M. Haacke, S. Liu, S. Buch, W. Zheng, D. Wu, and Y. Ye, “Quantitative susceptibility mapping: current status and future directions,” Magn Reson Imaging, 33(1):1–25, 2015.
[3] J. R. Reichenbach, F. Schweser, B. Serres, and A. Deistung, “Quantitative Susceptibility Mapping: Concepts and Applications,” Clin Neuroradiol, 25(S2):225–230, 2015.
[4] Y. Wang and T. Liu, “Quantitative susceptibility mapping (QSM): Decoding MRI data for a tissue magnetic biomarker,” Magn Reson Med, 73(1):82–101, 2015.
[5] C. Langkammer, F. Schweser, N. Krebs, A. Deistung, W. Goessler, E. Scheurer, K. Sommer, G. Reishofer, K. Yen, F. Fazekas, S. Ropele, and J. R. Reichenbach, “Quantitative susceptibility mapping (QSM) as a means to measure brain iron? A post mortem validation study.” NeuroImage, 62(3):1593–1599, 2012.
[6] C. Langkammer, N. Krebs, W. Goessler, E. Scheurer, F. Ebner, K. Yen, F. Fazekas, and S. Ropele, “Quantitative MR Imaging of Brain Iron: A Postmortem Validation Study.” Radiology, 257(2):455–462, 2010.
[7] D. B. Kell, “Towards a unifying, systems biology understanding of large-scale cellular death and destruction caused by poorly liganded iron: Parkinson’s, Huntington’s, Alzheimer’s, prions, bactericides, chemical toxicology and others as examples.” Arch Toxicol, 84:825–889, 2010.
[8] C. Stüber, D. Pitt, and Y. Wang, “Iron in Multiple Sclerosis and Its Noninvasive Imaging with Quantitative Susceptibility Mapping,” Int J Mol Sci, 17(1):100, 2016.
[9] J. F. Schenck, “Health and physiological effects of human exposure to whole-body four-tesla magnetic fields during MRI.” Ann N Y Acad Sci, 649:285–301, 1992.
[10] C. H. Ziener, W. R. Bauer, and P. M. Jakob, “Transverse relaxation of cells labeled with magnetic nanoparticles.” Magn Reson Med, 54(3):702–6, 2005.
[11] F. Schweser, A. Deistung, B. W. Lehr, and J. R. Reichenbach, “Quantitative imaging of intrinsic magnetic tissue properties using MRI signal phase: An approach to in vivo brain iron metabolism?” NeuroImage, 54(4):2789–2807, 2011.
[12] F. Schweser, J. Sedlacik, A. Deistung, and J. R. Reichenbach, “Non-invasive Investigation of the Compartmentalization of Iron in the Human Brain,” in ISMRM 2013, p460.
[13] J. A. de Zwart, P. J. Ledden, P. Kellman, P. van Gelderen, and J. H. Duyn, “Design of a SENSE-optimized high-sensitivity MRI receive coil for brain imaging.” Magn Reson Med, 47(6), 1218–27, 2002.
[14] K. E. Hammond, J. M. Lupo, D. Xu, M. Metcalf, D. A. C. Kelley, D. Pelletier, S. M. Chang, P. Mukherjee, D. B. Vigneron, and S. J. Nelson, “Development of a robust method for generating 7.0 T multichannel phase images of the brain with application to normal volunteers and patients with neurological diseases.” NeuroImage, 39(4):1682–1692, 2008.
[15] P. Polak, R. Zivadinov, and F. Schweser, “Gradient Unwarping for Phase Imaging Reconstruction,” ISMRM 2015, p1279.
[16] H. S. Abdul-Rahman, M. A. Gdeisat, D. R. Burton, M. J. Lalor, F. Lilley, and C. J. Moore, “Fast and robust three-dimensional best path phase unwrapping algorithm.” Appl Opt, 46(26):6623–35, 2007.
[17] P. S. Özbay, A. Deistung, X. Feng, D. Nanz, J. R. Reichenbach, and F. Schweser, “A comprehensive numerical analysis of background phase correction with V-SHARP,” NMR Biomed (epub)
[18] B. Wu, W. Li, A. Guidon, and C. Liu, “Whole brain susceptibility mapping using compressed sensing.” Magn Reson Med, 24:1129–36, 2011.
[19] F. Schweser, K. Sommer, A. Deistung, and J. R. Reichenbach, “Quantitative susceptibility mapping for investigating subtle susceptibility variations in the human brain.” NeuroImage, 62(3):2083–2100, 2012.
[20] P. Perona and J. Malik, “Scale-space and edge detection using anisotropic diffusion,” IEEE Trans Pattern Anal Mach Intell, 12(7):629–639, 1990.
[21] J. Hanspach, M. Dwyer, N. P. Bergsland, X. Feng, J. Hagemeier, P. Polak, N. Bertolino, R. Zivadinov, and F. Schweser, “Toward a voxel-based analysis (VBA) of quantitative magnetic susceptibility maps (QSM): Strategies for creating brain susceptibility templates.” ISMRM 2016, p1905.
[22] X. Li and P. C. M. van Zijl, “Mean magnetic susceptibility regularized susceptibility tensor imaging (MMSR-STI) for estimating orientations of white matter fibers in human brain,” Magn Reson Med, 72(3), 610–619, 2014.
[23] H. Sun, M. Kate, L. C. Gioia, D. J. Emery, K. Butcher, and A. H. Wilman, “Quantitative susceptibility mapping using a superposed dipole inversion method: Application to intracranial hemorrhage,” Magn Reson Med, 791:781–791, 2015.
[24] B. Hallgren and P. Sourander, “The effect of age on the non-haemin iron in the human brain,” J Neurochem, 3:41–51, 1958.
Figures