1196
Subtype Differentiation of Small (< 4 cm) Solid Renal Mass Using Histogram Analysis of Reduced Field-of-View Diffusion Weighted MRI at 3-T1Department of Radiology, Tongji Hospital, Tongji Medical College, Huazhong University of Science and Technology, Wuhan, People's Republic of China
Synopsis
To evaluate the utility of volumetric histogram analysis originated from reduced field-of-view (r-FOV) diffusion-weighted (DW) imaging for small (< 4cm) solid renal mass subtypes at 3-T MR. Differences of ADC histogram parameters among different subtypes of renal tumor were compared. Benign tumors had significantly lower mean ADC, median ADC, 10th, 25th, 75th, 90th percentiles ADC, SD and entropy values compared to malignant tumors. ADC histogram analysis of the entire lesion was complementary to the mean ADC measure and may have a certain value to help differentiate the majority of subtypes of small solid renal tumor.
Introduction
Small (< 4cm) solid renal masses are increasingly detected by accident with the increased utilization of cross-sectional imaging techniques. Because of lacking specific performance, small solid renal masses remain a diagnostic dilemma1. Patients often definitively identified the tumor histopathology through percutaneous biopsy. But it is an invasive procedure, and its accuracy may vary depending on many factors. Therefore, an accurate noninvasive method could reduce the rate of unnecessary surgery and ensure proper management options for patients simultaneously.Purpose
The purpose of this article was to evaluate the utility of volumetric histogram analysis originated from reduced field-of-view (r-FOV) diffusion-weighted (DW) imaging for small (< 4cm) solid renal mass subtypes at 3-T.Methods
228 patients with renal tumors were employed in this retrospectively study. Volumetric ADC map was constructed using all slices of the r-FOV DWI to obtain histogram parameters, including the mean ADC, median ADC, 10th, 25th, 75th, 90th percentiles ADC, standard deviation (SD), skewness, kurtosis and entropy. Differences of parameters among subtypes of renal tumors were compared using one-way analysis of variance. An independent-samples t test was used to compare the parameters between benign and malignant renal tumors. Multiple receiver operating characteristic (ROC) curves analysis was used to determine and compare the diagnostic value of each significant parameter.Results
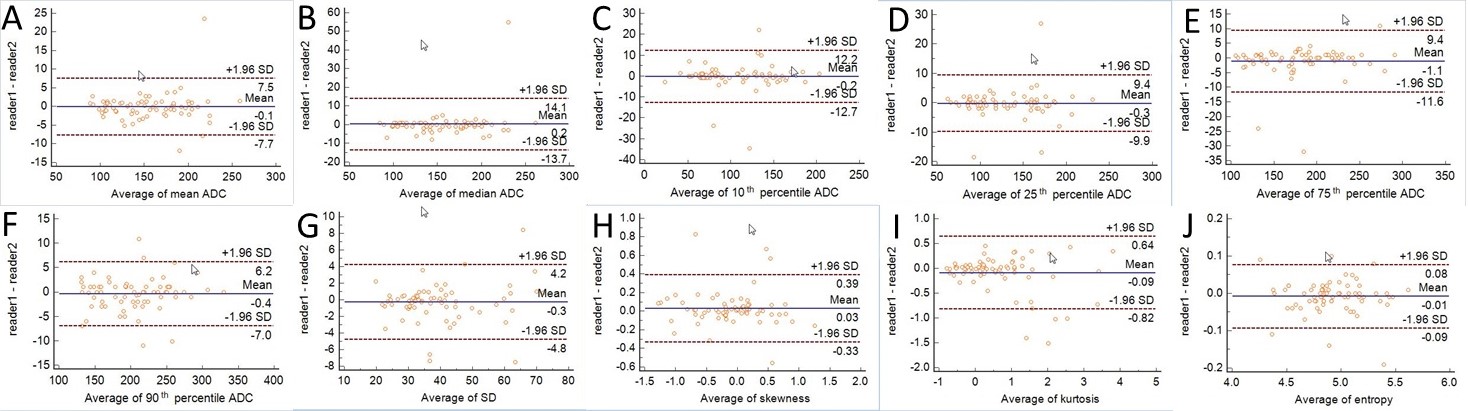
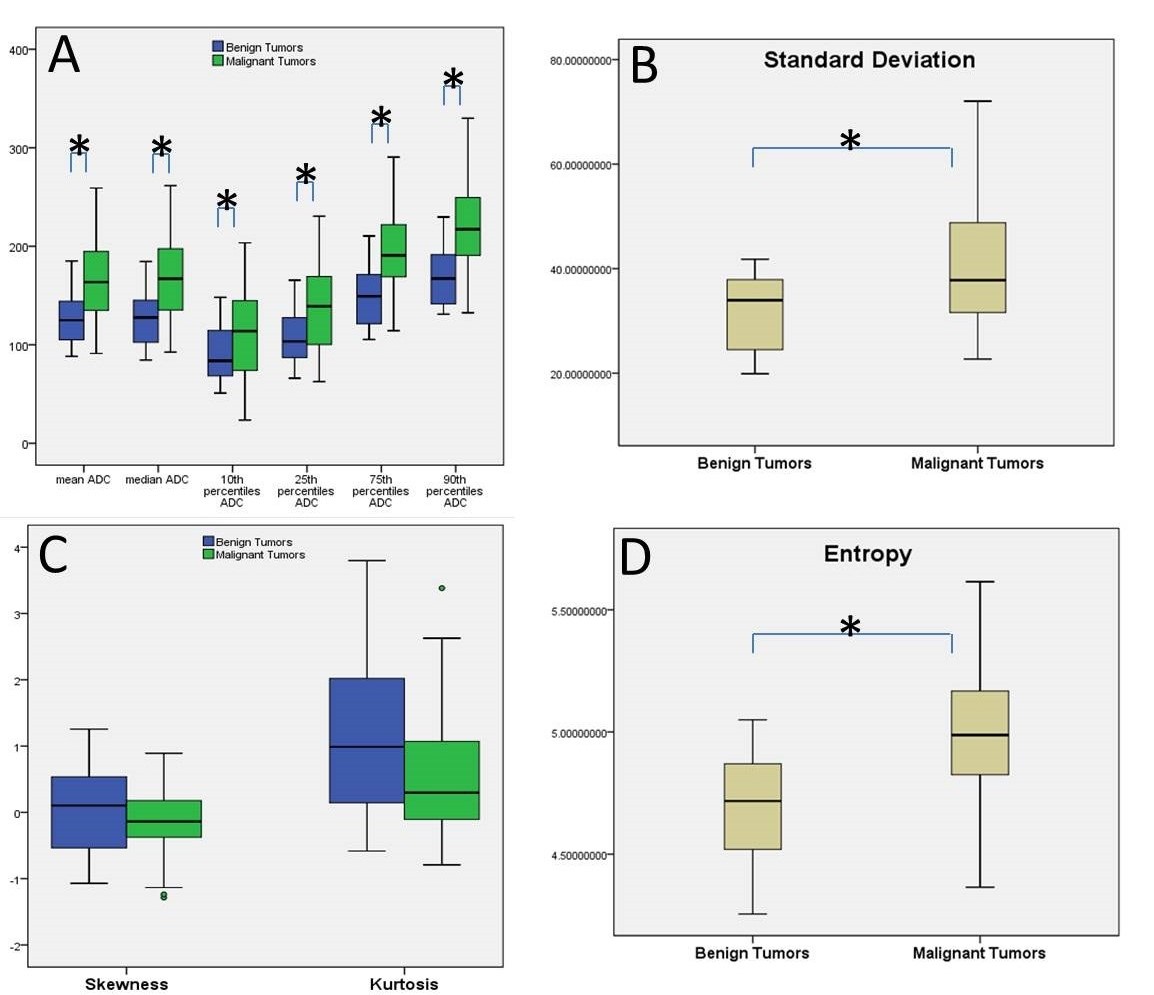
A total of 70 renal tumors including 38 clear cell (ccRCC), 8 papillary (pRCC), 6 chromophobe (chRCC), 13 minimal fat angiomyolipoma (MFAML) and 5 oncocytoma (Onc) were enrolled in our analysis. The interobserver agreement between two radiologists was excellent and the Bland–Altman plots showed low interobserver variability (Fig.1). Compared with benign tumors, the mean ADC, median ADC, 10th, 25th, 75th, 90th percentiles ADC, SD and entropy of malignant tumors were significantly higher (all P < 0.01) (Fig.2, 4, 5). The 90th percentile ADC achieved the highest AUC (0.814; 95% CI: 0.713, 0.916) in differentiating malignant renal tumors from benign ones (Fig.3). The mean ADC, median ADC, 10th, 25th, 75th, 90th percentiles ADC of ccRCC was significantly higher than pRCC, chRCC, MFAML and Onc. The 10th and 25th percentiles ADC of ccRCC was significantly higher than pRCC, chRCC and MFAML. The SD of ADC values of Onc was significantly lower than ccRCC and pRCC. The entropy of ADC values of MFAML was significantly lower than ccRCC and pRCC, and entropy of Onc was significantly lower than ccRCC, pRCC, and chRCC (all P < 0.01).Discussion
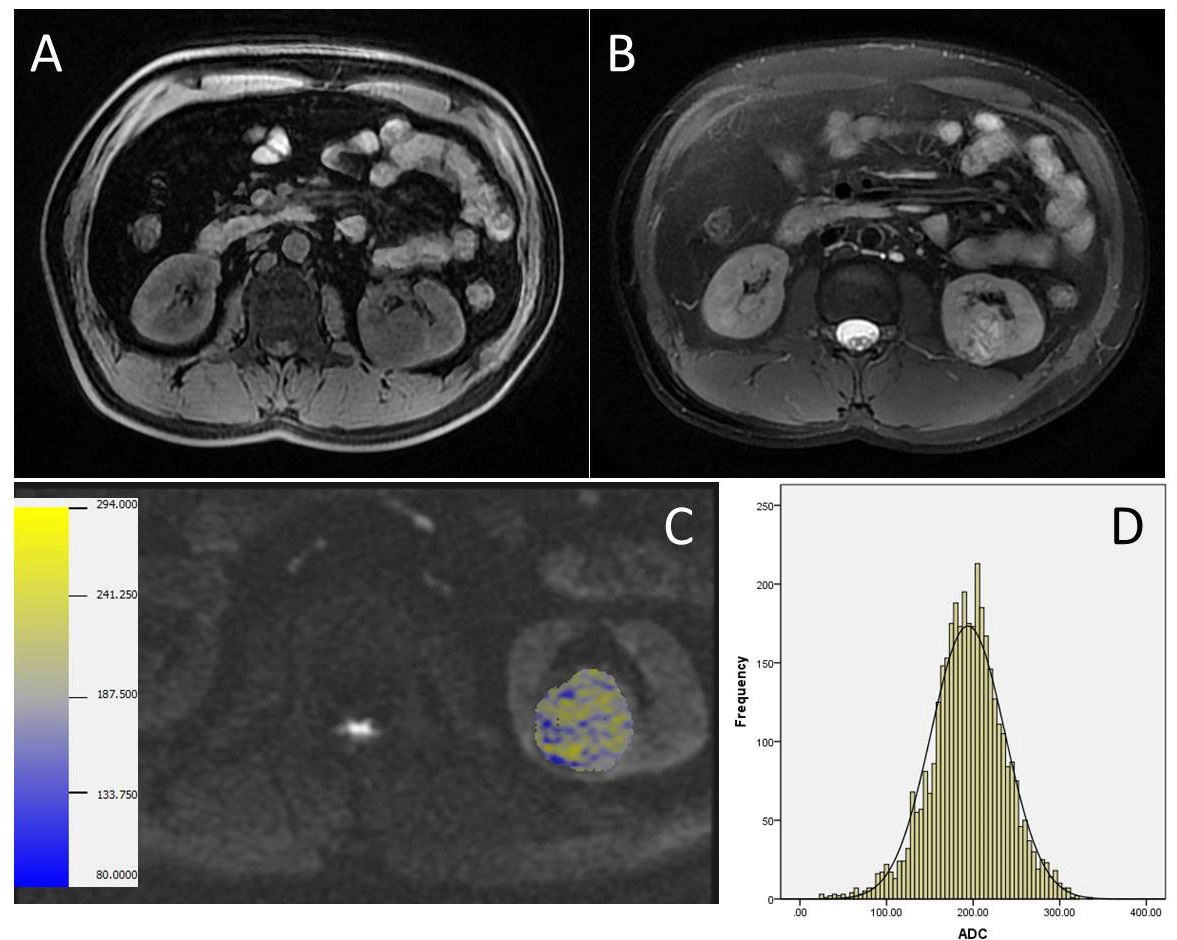
Whole-lesion volumetric ADC histogram analysis was employed to evaluate the distribution of ADC values of the entire lesion and avoids the subjectivity of ROIs placement to ensure calculation accuracy and repeatability. This method has described the comprehensive characteristics of ADC values of entire tumors and can potentially eliminate sampling bias during data processing2. Besides, we presented the r-FOV DWI technique, instead of the routine f-FOV DWI for renal imaging, which could obtain higher resolution and better quality DWI image with fewer susceptibility artifacts and distortions of small lesions3. In our study, the mean ADC, median ADC, 10th, 25th, 75th, 90th percentiles ADC of benign renal tumors were significantly lower than those of malignant ones, which may indicate that water molecular diffusion was more restricted in benign renal tumors. In additions, the entropy and SD of malignant tumors was significantly higher than those of benign ones, which may identify that malignant tumors have a higher degree of heterogeneity. During ROC curves analysis, the 90th percentile ADC value generated the highest AUC value for differentiating malignant from benign renal tumors, while the mean ADC value generated higher AUC for differentiating these two entities. It suggested that the high percentile of ADC value may be more representative and have better sensitivity and specificity. Most of previous studies not being able to find significant differences in mean ADC values or IVIM parameters between chRCC and Onc or pRCC and MFAML4. In this study, the entropy of ADC value of Onc was significantly lower than chRCC and the entropy of MFAML was dramatically lower than pRCC. It was a possibility that because of the more varying cellularity and more heterogeneous tissue condition may lead to higher entropy of ADC values.Conclusion
Our study demonstrated the combination of r-FOV DWI and volumetric histogram analysis of ADC values may have a certain value to help differentiate the majority of subtypes of small solid renal tumor, including benign and malignant lesions.Acknowledgements
No acknowledgement found.References
1. Cornelis F, Tricaud E, Lasserre AS, et al. Routinely performed multiparametric magnetic resonance imaging helps to differentiate common subtypes of renal tumours. Eur Radiol 2014; 24:1068–1080.
2. Zhang YD, Wu CJ, Wang Q, et al. Comparison of Utility of Histogram Apparent Diffusion Coefficient and R2* for Differentiation of Low-Grade From High-Grade Clear Cell Renal Cell Carcinoma. AJR Am J Roentgenol 2015; 205(2):W193-201.
3. Korn N, Kurhanewicz J, Banerjee S, et al. Reduced-FOV excitation decreases susceptibility artifact in diffusion-weighted MRI with endorectal coil for prostate cancer detection. Magn Reson Imaging 2015; 33(1):56-62.
4. Gaing B, Sigmund EE, Huang WC, et al. Subtype differentiation of renal tumors using voxel-based histogram analysis of intravoxel in coherent motion parameters. Invest Radiol 2015; 50(3):144–152.
Figures