1195
In-vivo Reproducibility of Quantitative Diffusion MRI in the Prostate using Reduced Field-of-View and Multi-shot Acquisitions1Medical Physics, University of Wisconsin, Madison, Madison, WI, United States, 2Radiology, University of Wisconsin, Madison, Madison, WI, United States, 3MR Applications & Workflow, GE Healthcare, Boston, MA, United States
Synopsis
Novel diffusion weighted MRI pulse sequences based on reduced FOV (rFOV) and multi-shot echo-planar imaging (msEPI), respectively, have been proposed to reduce distortions present in standard single-shot EPI. In this study, the quantitative reproducibility of prostate diffusion measurements with rFOV and msEPI is investigated with healthy volunteers. Diffusion parameters were estimated from different sequences (ssEPI, rFOV, msEPI), b-value groups, and diffusion models (mono-exponential, stretched exponential and kurtosis). Measurements from rFOV and msEPI are in good agreement with the standard ssEPI, demonstrating reproducibility across pulse sequences.
Target Audience
MR physicists and clinicians interested in quantitative diffusion imaging.Introduction
Quantitative diffusion MRI provides a promising method for the noninvasive assessment of prostate cancer1, a common malignancy in males. However, the presence of complex anatomy with susceptibility-related $$${B_{0}}$$$ field inhomogeneity can result in distortions in standard single-shot echo planar imaging (ssEPI)-based prostate diffusion MRI. In recent years, novel pulse sequences based on reduced field-of-view (rFOV)2,3 and multi-shot EPI (msEPI)4 acquisitions have been proposed to reduce these image distortions. Both rFOV and msEPI have been shown to provide improved image quality compared to conventional ssEPI. Furthermore, rFOV and msEPI have been shown to provide accurate apparent diffusion coefficient (ADC) measurements relative to ssEPI in quantitative diffusion phantoms5,6. However, in vivo validation of the reproducibility of quantitative diffusion measurements obtained from these novel diffusion MRI sequences is still needed. In this work, we assessed the reproducibility of quantitative diffusion measurements in the prostate of healthy volunteers using three diffusion MRI sequences (ssEPI, rFOV and msEPI) with two different sets of b-values (low vs. high b-values), and processed using three different quantitative diffusion models (exponential, stretched exponential7, and kurtosis8 models).Methods
Acquisitions: After IRB approval and informed written consent, six healthy volunteers were scanned with the lower coils of a 32-channel torso coil array on a 3T MR scanner (MR 750, GE Healthcare, Waukesha, WI). For each of the three diffusion MRI sequences (ssEPI, rFOV and msEPI), 16 axials slices were acquired to cover the entire prostate and reconstructed at a 256$$${\times}$$$256 matrix. Each of the three sequences was acquired in two series with different b-value groups. For ssEPI and rFOV, diffusion images were obtained with low b-values=[10(4 averages), 50(4), 100(4), 200(4), 400(16), 600(16), 800(16)]s/mm$$${^{2}}$$$, and high b-values=[10 (4), 50(4), 100(4), 400(16), 800(16), 1200(16), 1500(16)]s/mm$$${^{2}}$$$, respectively. For msEPI sequence, low b-values=[10(2), 50(2), 100(2), 200(2), 400(8), 600(8), 800(8)]s/mm$$${^{2}}$$$, and high b-values=[10 (2), 50(2), 100(2), 400(8), 800(8), 1200(16), 1500(16)]s/mm$$${^{2}}$$$ were used because of time constraints. Specific parameters used in all sequences are shown in Table 1.
Diffusion estimation: Diffusion parameters were estimated on the averaged signal from regions-of-interest (ROIs) of approximately 0.6cm$$${^{2}}$$$ in the central gland (CG) and 0.8cm$$${^{2}}$$$ in the peripheral zone (PZ) of the prostate for each acquisition. This signal was fitted by non-linear least-square fitting with the following three diffusion models: 1. Mono-exponential model $$S(b)=S_{0}e^{-bADC_m};$$ 2. Stretched exponential model7 $$S(b)=S_{0}e^{-(bD_s)^{\alpha_s}}; $$ 3. Kurtosis model8 $$S(b)=S_{0}e^{-bD_k+\frac{1}{6}b^{2}{D_k}^{2}k}; $$ where $$$S(b)$$$ is the signal intensity for a specific b value, $$$S_0$$$ is the signal intensity at b=0 $$${s/mm^2}$$$. ADC, $$$D_s$$$ and $$$D_k$$$ are the diffusion coefficients for three models respectively. $$$\alpha_s$$$ is the anomalous exponent and $$$k$$$ is kurtosis.
To assess the reproducibility of the diffusion measurements for each of the three signal models, Bland-Altman analysis was performed across different pulse sequences and different b-value groups.
Results
Fig.1 shows representative ssEPI, rFOV and msEPI images, including DW images (b=400s/mm$$$^2$$$), ADC maps obtained from the low b-value acquisition and ADC maps obtained from the high b-value acquisition. Diffusion parameters measured in the CG and PZ using different diffusion models and different pulse sequences are listed in Table 2.
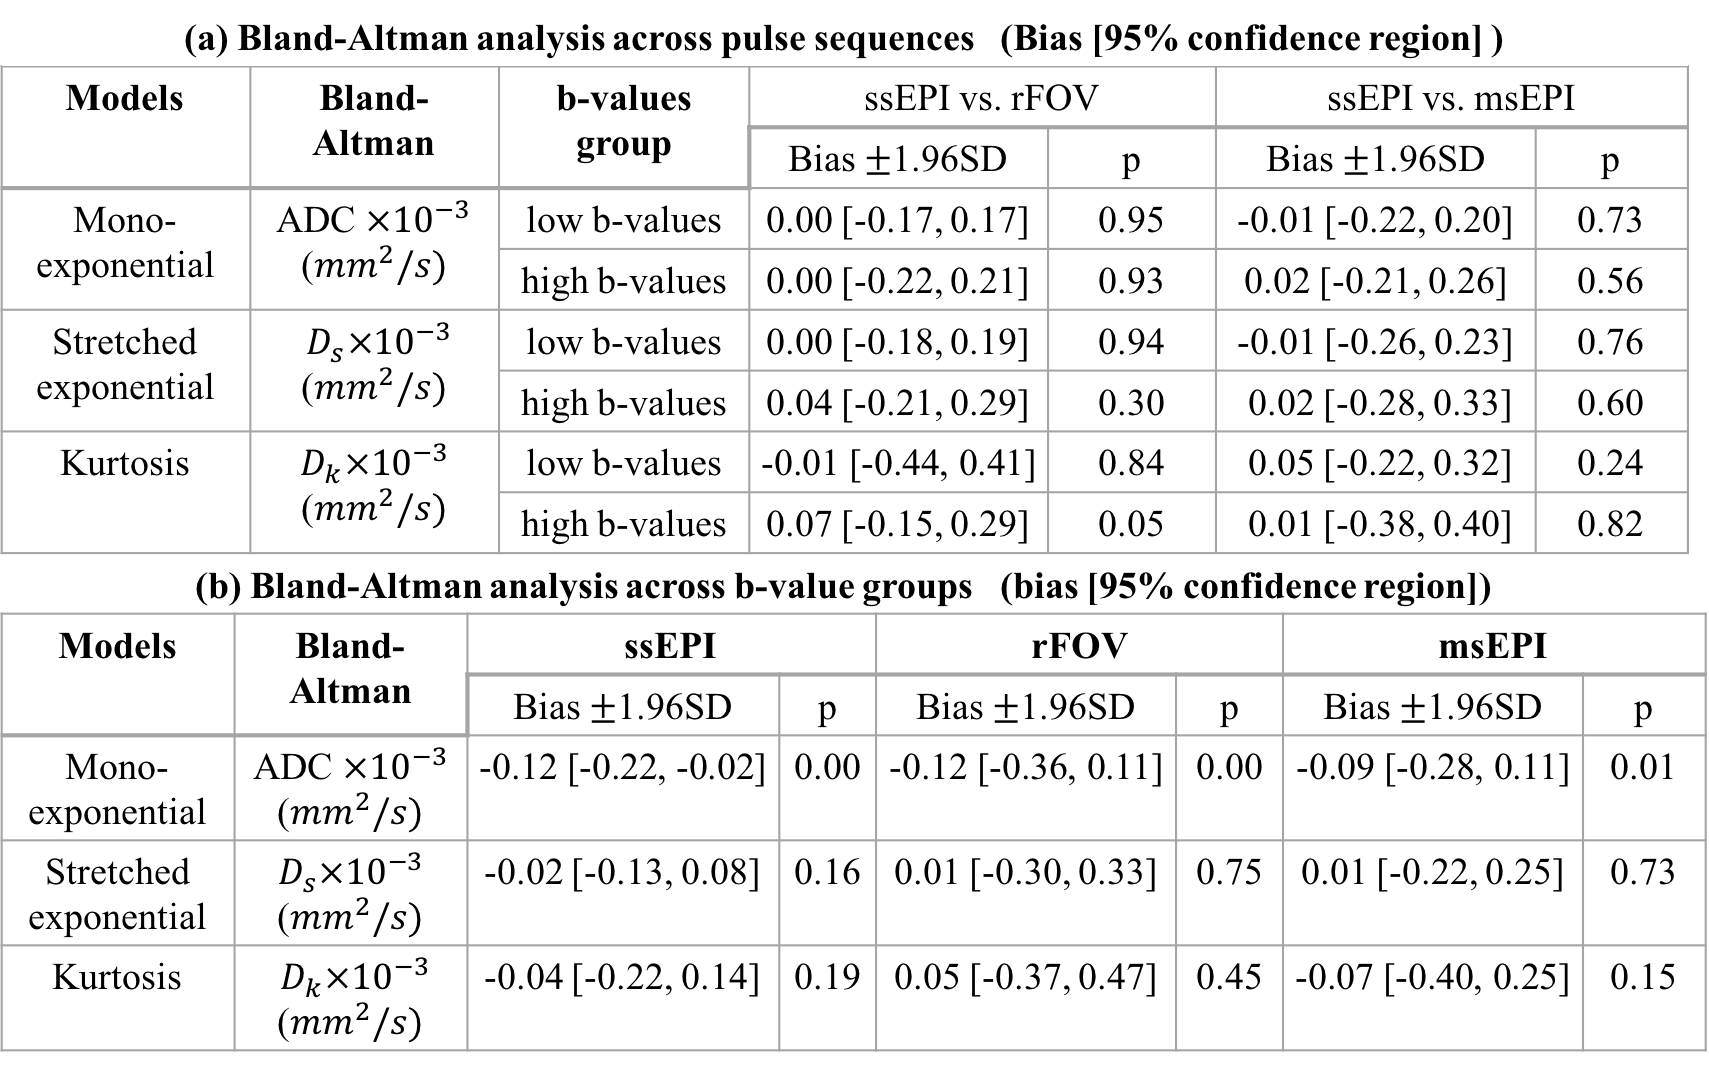
Fig.2 shows Bland-Altman plots of ADC values across different pulse sequences (a) and across b-value groups (b) (remaining Bland-Altman plots not shown for brevity). Table 3 lists the bias with 95$$$\%$$$ confidence interval and p values in Bland-Altman analysis across pulse sequences (a) and across b-value groups (b).
Discussion
Quantitative diffusion parameters measured in this study showed good reproducibility across diffusion MRI sequences (rFOV, msEPI, and ssEPI). When comparing diffusion measurements across b-value groups, a moderate bias was observed in ADC (exponential model) but not in $$$D_s$$$ (stretched exponential) and $$$D_k$$$ (kurtosis model). ADC bias across b-value groups may be due to restricted diffusion, but may also be due to noise bias effects. These results are in good agreement with previous phantom studies of rFOV and msEPI5,6, and may indicate the promise of novel diffusion MRI sequences for reproducible quantitative diffusion MRI with reduced image distortions. The main limitation of this study was the lack of clinical pathology. Upon validation in patients, rFOV and msEPI may provide high image quality with reduced distortions and reproducible quantitative diffusion measurements in the prostate.Conclusion
Quantitative diffusion measurements in healthy volunteers demonstrate good reproducibility across diffusion MRI pulse sequences. Measurements from two novel sequences, rFOV and msEPI, are in good agreement with a standard ssEPI sequence.Acknowledgements
The authors wish to acknowledge GE Healthcare for their research support.References
[1] Koh, D. M., & Collins, D. J. (2007). Diffusion-weighted MRI in the body: applications and challenges in oncology. American Journal of Roentgenology, 188(6), 1622-1635.
[2] Saritas, E. U., Cunningham, C. H., Lee, J. H., Han, E. T., & Nishimura, D. G. (2008). DWI of the spinal cord with reduced FOV single-shot EPI. Magnetic resonance in medicine, 60(2), 468-473.
[3] Korn, N., Kurhanewicz, J., Banerjee, S., Starobinets, O., Saritas, E., & Noworolski, S. (2015). Reduced-FOV excitation decreases susceptibility artifact in diffusion-weighted MRI with endorectal coil for prostate cancer detection. Magnetic resonance imaging, 33(1), 56-62.
[4] Chen, N. K., Guidon, A., Chang, H. C., & Song, A. W. (2013). A robust multi-shot scan strategy for high-resolution diffusion weighted MRI enabled by multiplexed sensitivity-encoding (MUSE). Neuroimage, 72, 41-47.
[5] Rabanillo I, Holmes JH, Guidon A, Aja-Fernandez S, Alberola-Lopez C, Reeder SB, Hernando D. (2016). ADC measurement accuracy in quantitative diffusion phantoms using reduced field-of-view and Multi-shot acquisitions. ISMRM Workshop on Breaking the Barriers of Diffusion MRI;
[6] Banerjee I, Aramburu-Nunez D, Paudyal R, Chenevert T, Boss M, Shukla-Dave A. (2016). Does reduced FOV diffusion weighted imaging inherently yield lower ADC? ISMRM 2016;
[7] Bennett, K. M., Schmainda, K. M., Rowe, D. B., Lu, H., & Hyde, J. S. (2003). Characterization of continuously distributed cortical water diffusion rates with a stretched-exponential model. Magnetic resonance in medicine, 50(4), 727-734.
[8] Jensen, J. H., Helpern, J. A., Ramani, A., Lu, H., & Kaczynski, K. (2005). Diffusional kurtosis imaging: The quantification of non-gaussian water diffusion by means of magnetic resonance imaging. Magnetic Resonance in Medicine, 53(6), 1432-1440.
Figures