1193
IVIM virtual MR elastography of the liver1NeuroSpin, I²BM/CEA-Saclay, Gif-sur-Yvette, France, 2Radiology Department, Yamanashi University, Kofu, Japan
Synopsis
We have investigated the potential of diffusion MRI to provide quantitative estimates of tissue stiffness and compared results with those obtained by standard MR elastography (MRE). We revealed that water diffusion, calculated from 2 key b values, can be directly and quantitatively converted into shear stiffness without using mechanical vibrations. Propagating shear waves can also be simulated leading to a new elasticity-driven IVIM attenuation contrast. Such virtual elastograms give a variety of contrasts by simulating various ranges of vibration frequencies and amplitudes or MRI gradient strengths not limited by MRE hardware capacities.
Introduction
We introduce virtual IVIM MR elastography to estimate elastic properties of tissues from water diffusion. Standard MR Elastography (MRE) relies on phase encoding (through motion-probing gradient pulses) of external vibrations induced propagating shear waves, the wavelengths of which are linked to shear stiffness which is often higher in lesions1,2. MRE has shown great potential, especially for the assessment of liver fibrosis3-5, but has some limitations: cost (dedicated hardware and software), mechanical setup sensitivity, access to organs locating deep in the body, reverse transformation of the measured signal phase shifts into wavelengths which is not straightforward (phase unwrapping and corrections for phase discontinuities and drifts). On the other hand, diffusion MRI (dMRI) is sensitive to tissue microstructure6. Hypothesizing that there might be a relationship between tissue water diffusivity and elastic properties7, we have investigated the potential of dMRI to provide quantitative estimates of tissue shear stiffness and virtual MRE contrast, and compared the results with those obtained by standard MRE.Materials and Method
26 liver patients (23 fibrosis, 3 tumors) were examined using a 3T MRI scanner (Discovery 750; GE Medical Systems) with a 32-channel phased-array coil. 8 patients were excluded because of severe motion artifacts or poor signal-to-noise ratio. Vibration (60Hz) to the liver was induced from a cylindrical driver linked to a vibrator and attached to the right chest wall8. Patients were asked to hold their breath after expiration. MRE acquisition parameters were: TR/TE=50ms/20ms, 23° flip angle, 1 Nex, 256x80 matrix, 5mm thickness, 40x40cm² FOV, motion-sensitizing gradient along Z axis. Stiffness maps were calculated using an inversion algorithm implemented on the scanner2 and liver elasticity, μ was estimated from regions-of-interest (ROIs) on the stiffness maps. For dMRI the acquisition parameters were: SE-EPI, TR/TE=~4000ms/56.6ms, respiratory gating, 2 Nex, 4mm thickness, 100x100 matrix, 40x40cm² FOV, diffusion encoding along [X,Y,Z] using 2 ”key b values” (200, 1500s/mm²) optimized for non-Gaussian diffusion9. ROIs were placed in the liver by an independent reader, blind to the MRE results, and a “shifted ADC” (sADC) was calculated from the signals, S200 and S1500 acquired at b=200 and 15009:
sADC=ln(S200/S1500)/1300 [1]
In a first calibration step an empirical relationship between sADC and mMRE was searched from a statistical correlation analysis using a subpopulation of 5 fibrosis patients. Then, the dMRI derived shear stiffness was estimated, in a reverse way, for all patients as:
μdiff=f-1[ln(S200/S1500)] [2]
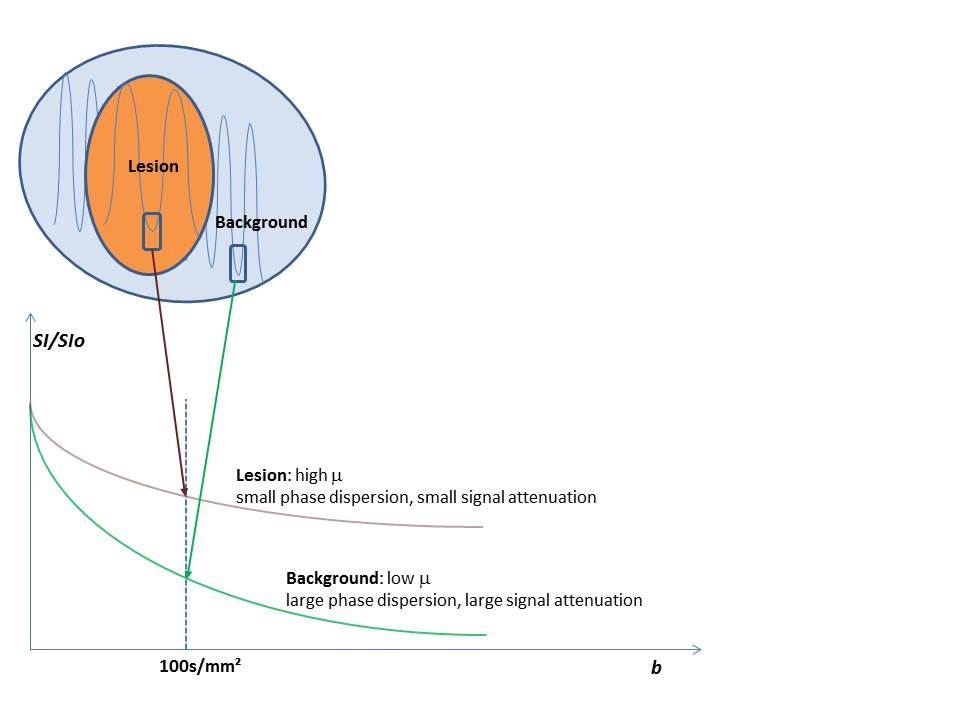
In a second step 3D virtual shear stiffness maps mdiff(x,y,z) were calculated using Eq.[2] on a voxel-by-voxel basis (in-house Matlab software). Those maps were used to emulate contrast which would result from propagating shear waves through the tissue, based on an IVIM effect10 in the presence of motion-encoding gradients (Fig.1): Tissues with low stiffness/short wavelengths have strong intravoxel phase dispersion, i.e. a large IVIM signal attenuation, and vice-versa. Such vibration induced IVIM effects can be seen with standard MRE11, but were here emulated from μdiff to produce virtual elastograms with different contrasts. IVIM signal attenuation, SI(b)/SIo at location r which would be obtained from any combination of vibration frequency/amplitude, f/ε, and b value was calculated as:
$$SI(b)/SIo=\int_{r}^{r+p}dr exp[i(ε/π)(48bNf)^{1/2} sin(2πr/λ+θ)] [3]$$
where θ is the phase offset of the virtual shear wave with the oscillating gradients train (period N), λv its spatial wavelength and p the voxel size. The spatial wavelength is linked to the virtual shear modulus as λv=1/f (μdiff/ρ)1/2 with ρ~1g/cm3.
Results
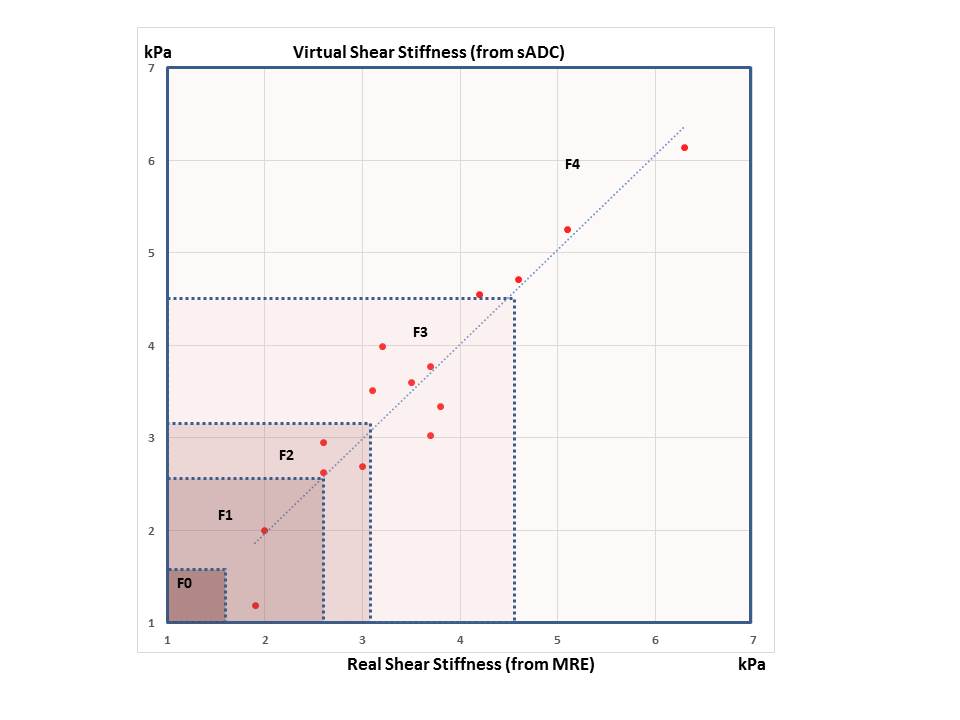
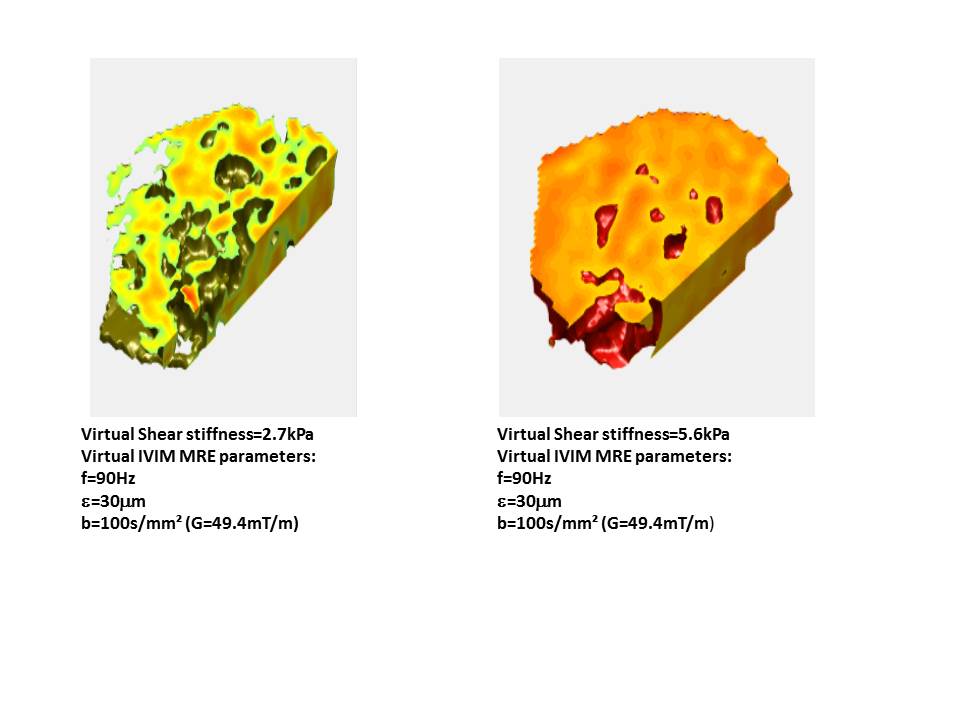
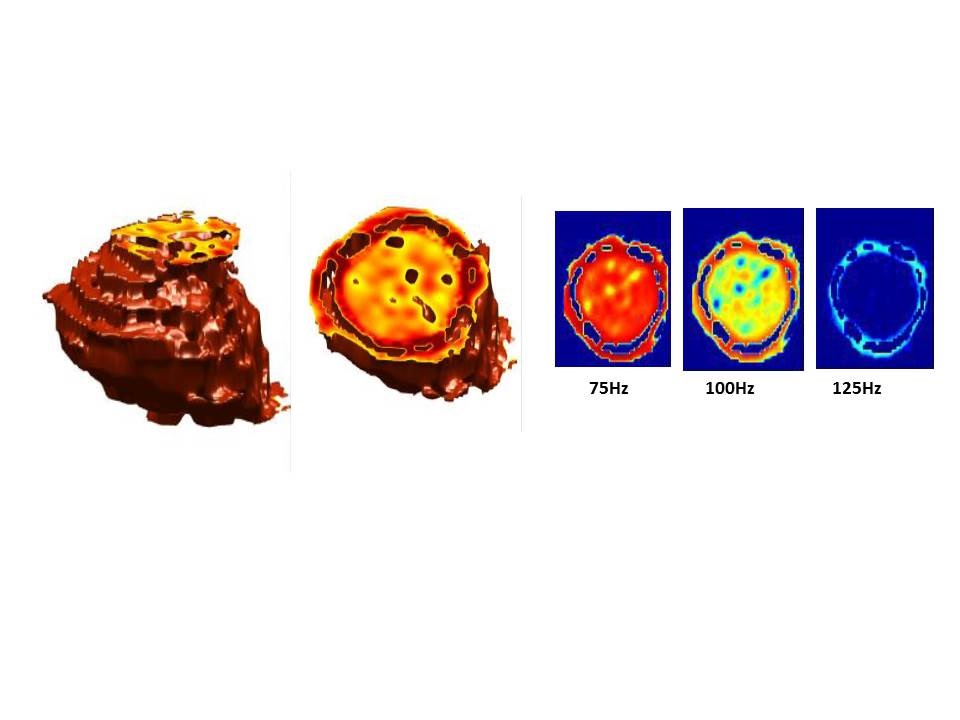
Surprisingly, the strongest relationship between sADC and mMRE was found to be linear, which resulted for [2] to: μdiff (kPa)=14-9.8 ln(S200/S1500). The overall correlation between μdiff and mMRE in the liver fibrosis patient population was high (R²=0.89, p=1.02 10-7) (Fig.2). Such shear stiffness values can be used to establish liver fibrosis stages non-invasively3,4. 3D virtual elastograms revealed liver structure (heterogeneity) (Fig.3) and details within lesions otherwise not straightforwardly visible in the sADC maps (Fig.4). In other words, the IVIM virtual MRE effect acts as a filter, enhancing of hiding lesions features, of interest for diagnosis.Discussion and Conclusion
Water diffusion can be directly and quantitatively converted into elasticity (e.g. shear stiffness) without using mechanical vibrations. Virtual elastograms share the multislice, high resolution features of dMRI, requiring only 2 b values to be acquired and processed. Propagating shear wave can be simulated leading to elasticity-driven IVIM contrast with ranges of virtual vibration frequencies and amplitudes or MRI gradient strengths not limited by MRE hardware capacities. Further studies will validate and evaluate the potential of this approach for other organs, especially deep sited organs.Acknowledgements
No acknowledgement found.References
1.Muthupillai R., et al. Science 269, 1854-1857, 1995
2.Manduca A., et al. Medical Image Analysis 5, 237-254, 2001
3.Ichikawa S, et al. Magn Reson Med Sci. 11(4):291-7, 2012
4.Ichikwa S, et al. Magn Reson Med Sci. 14(3):211-21, 2015
5.Singh S., et al. Clinical Gastroenterology and Hepatology 13, 440-451, 2015
6.Le Bihan D, et al.. Plos Biology 13(7):e1002203, 2015
7.Alkalay R.N., et al. JMRI 41(3), 654-64, 2015
8.Rouvière O, et al. Radiology 240, 440-448, 2006
9.Iima I., et al. Radiology 278, 13-32, 2016
10.Le Bihan D., et al. Radiology 168, 497-505,1988
11.Glaser K.J., et al,. MRM 50:1256-1265, 2003
Figures