1192
Efficient IVIM of the Liver using Convex Optimized Diffusion Encoding Waveforms With Variable Flow Encoding Strengths1Department of Radiological Sciences, University of California, Los Angeles, CA, United States, 2Biomedical Physics IDP, University of California, Los Angeles, CA, United States
Synopsis
Accounting for the flow encoding strength α in addition to the b-value in the Intra-Voxel Incoherent Motion (IVIM) technique enables robust perfusion estimation. However, this approach still requires long scan times and α is dependent on both the diffusion encoding waveform and the b-value. In this study, waveforms were generated using the convex diffusion encoding (CODE) framework and led to a range of α for a given b-value. By sampling of flow- and diffusion-encoding space, capillary blood velocity (Vb), perfusion fraction (f) and true diffusion (D) was estimated with higher precision without any cost in time compared to conventional IVIM.
Purpose
Diffusion weighting imaging (DWI) probes the self-diffusion of water molecules at the cellular level and reports on the microstructural environment in soft tissues. DWI is increasingly used in the assessment of liver lesions, including liver metastases1. With DWI alone, however, it is difficult to differentiate malignant and benign lesions, particularly in hyper-vascular or hypo-vascular lesions because DWI does not typically differentiate signal contributions from diffusion and perfusion2.
The intra-voxel incoherent motion (IVIM) technique3 separates contributions from perfusion and diffusion in the DWI signal and provides contrast-free perfusion information. IVIM is typically accomplished by acquiring DWI signals with both low b-values (weighted by diffusion and perfusion) and high b-values (solely diffusion weighted) to separate the two effects but this results in long scan times.
IVIM suffers from poor accuracy4 in estimating perfusion, but recent work in the brain5 and liver6 has shown that the signal separation is improved by accounting for the flow encoding strength (α=γM1, first gradient moment) of the diffusion encoding waveform, which influences perfusion sensitivity. In all previously reported IVIM techniques α is dependent on both the diffusion encoding scheme and the b-value (i.e. increasing the b-value increases α). Consequently, α cannot be controlled as an independent sequence parameter, which inherently limits the flexibility of this approach.
The diffusion encoding framework recently proposed by Aliotta7 et al. can generate gradient waveforms with a range of α for a given b-value. This permits flexible sampling of the flow- and diffusion-encoding space. The objectives of this study are: 1) to generate accurate perfusion fraction (f), capillary blood velocity (Vb), and diffusion (D) maps by acquiring DWI with a range of b-values (b) and flow encoding strengths (α); and 2) to determine the optimal parameter combinations for IVIM reconstruction.
Materials and Methods
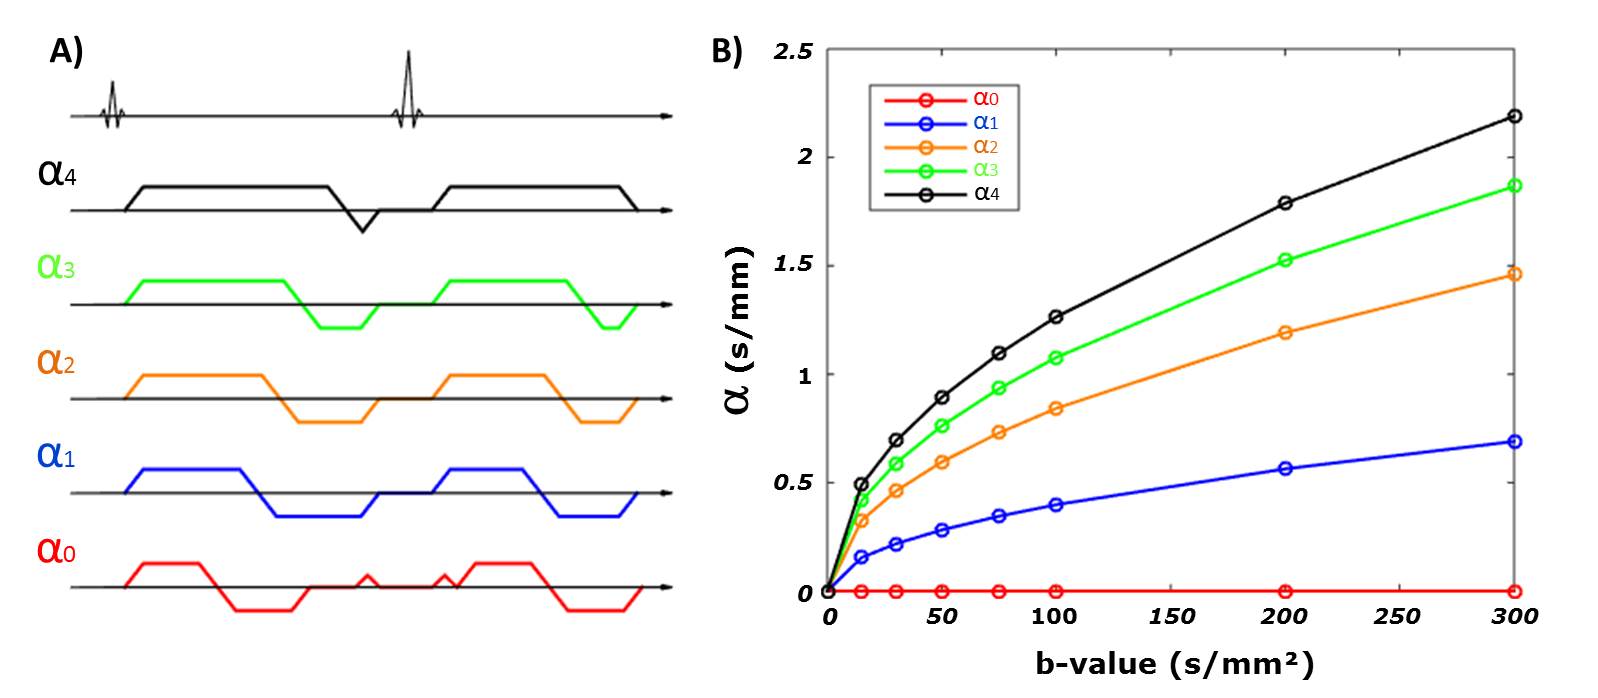
Healthy volunteers (N=7) were imaged on a 3T scanner (Prisma, Siemens) using five different diffusion encoding schemes generated using a convex optimization framework7 each with a distinct b-value and α. For each waveform, eight b-values (0, 15, 30, 50, 75, 100, 200, 300 s/mm²) were acquired with six directions and two repetitions. Each waveform’s pathway in the b-value/α space is shown in Fig1. A single axial DW-EPI slice was acquired with 2.7x2.7x5mm resolution, TE/TR=54ms/4000ms, end-respiratory triggering (430 images, ~30-minutes). Normalized DWI (Sb/S0) were fitted pixel-wise to the IVIM model described by Algren et al.5:
$$ F_{ivim}(α,b)=(1-f).exp(-b.D) + f.exp(-b.D_b).exp(-α².V_b/2) $$
Blood diffusivity was held constant6 at Db=1.75mm²/s. f, Vb, and D were estimated from this model using a nonlinear regression. Mean liver values were measured for each volunteer using a 10x10 pixel ROI avoiding large vessels. Fully sampled reconstructions were compared to five retrospectively sub-sampled reconstructions that represent classical IVIM points (EIVIM), flow and non-flow compensation IVIM5,6 (EFC_IVIM), half of the a (EA2), low (ELB) b-values, and high (EHB) b-values.
Result
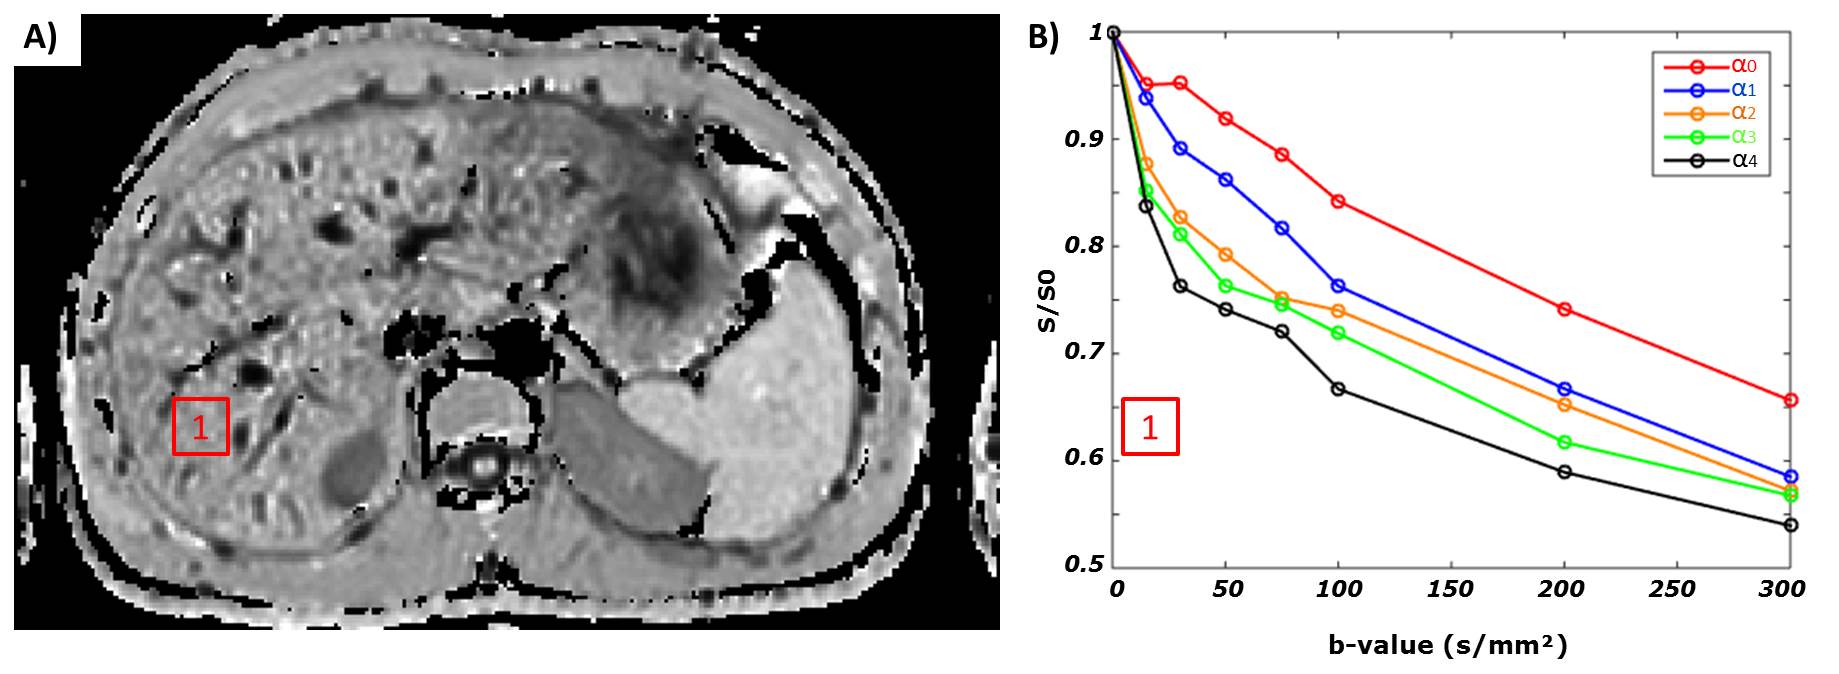
Fig2 shows an example of Sb/S0 signal ratios as a function of b-value for the five IVIM encoding schemes. As predicted by the IVIM model of Algren et al., these curve show that the perfusion effect is dependent on α.
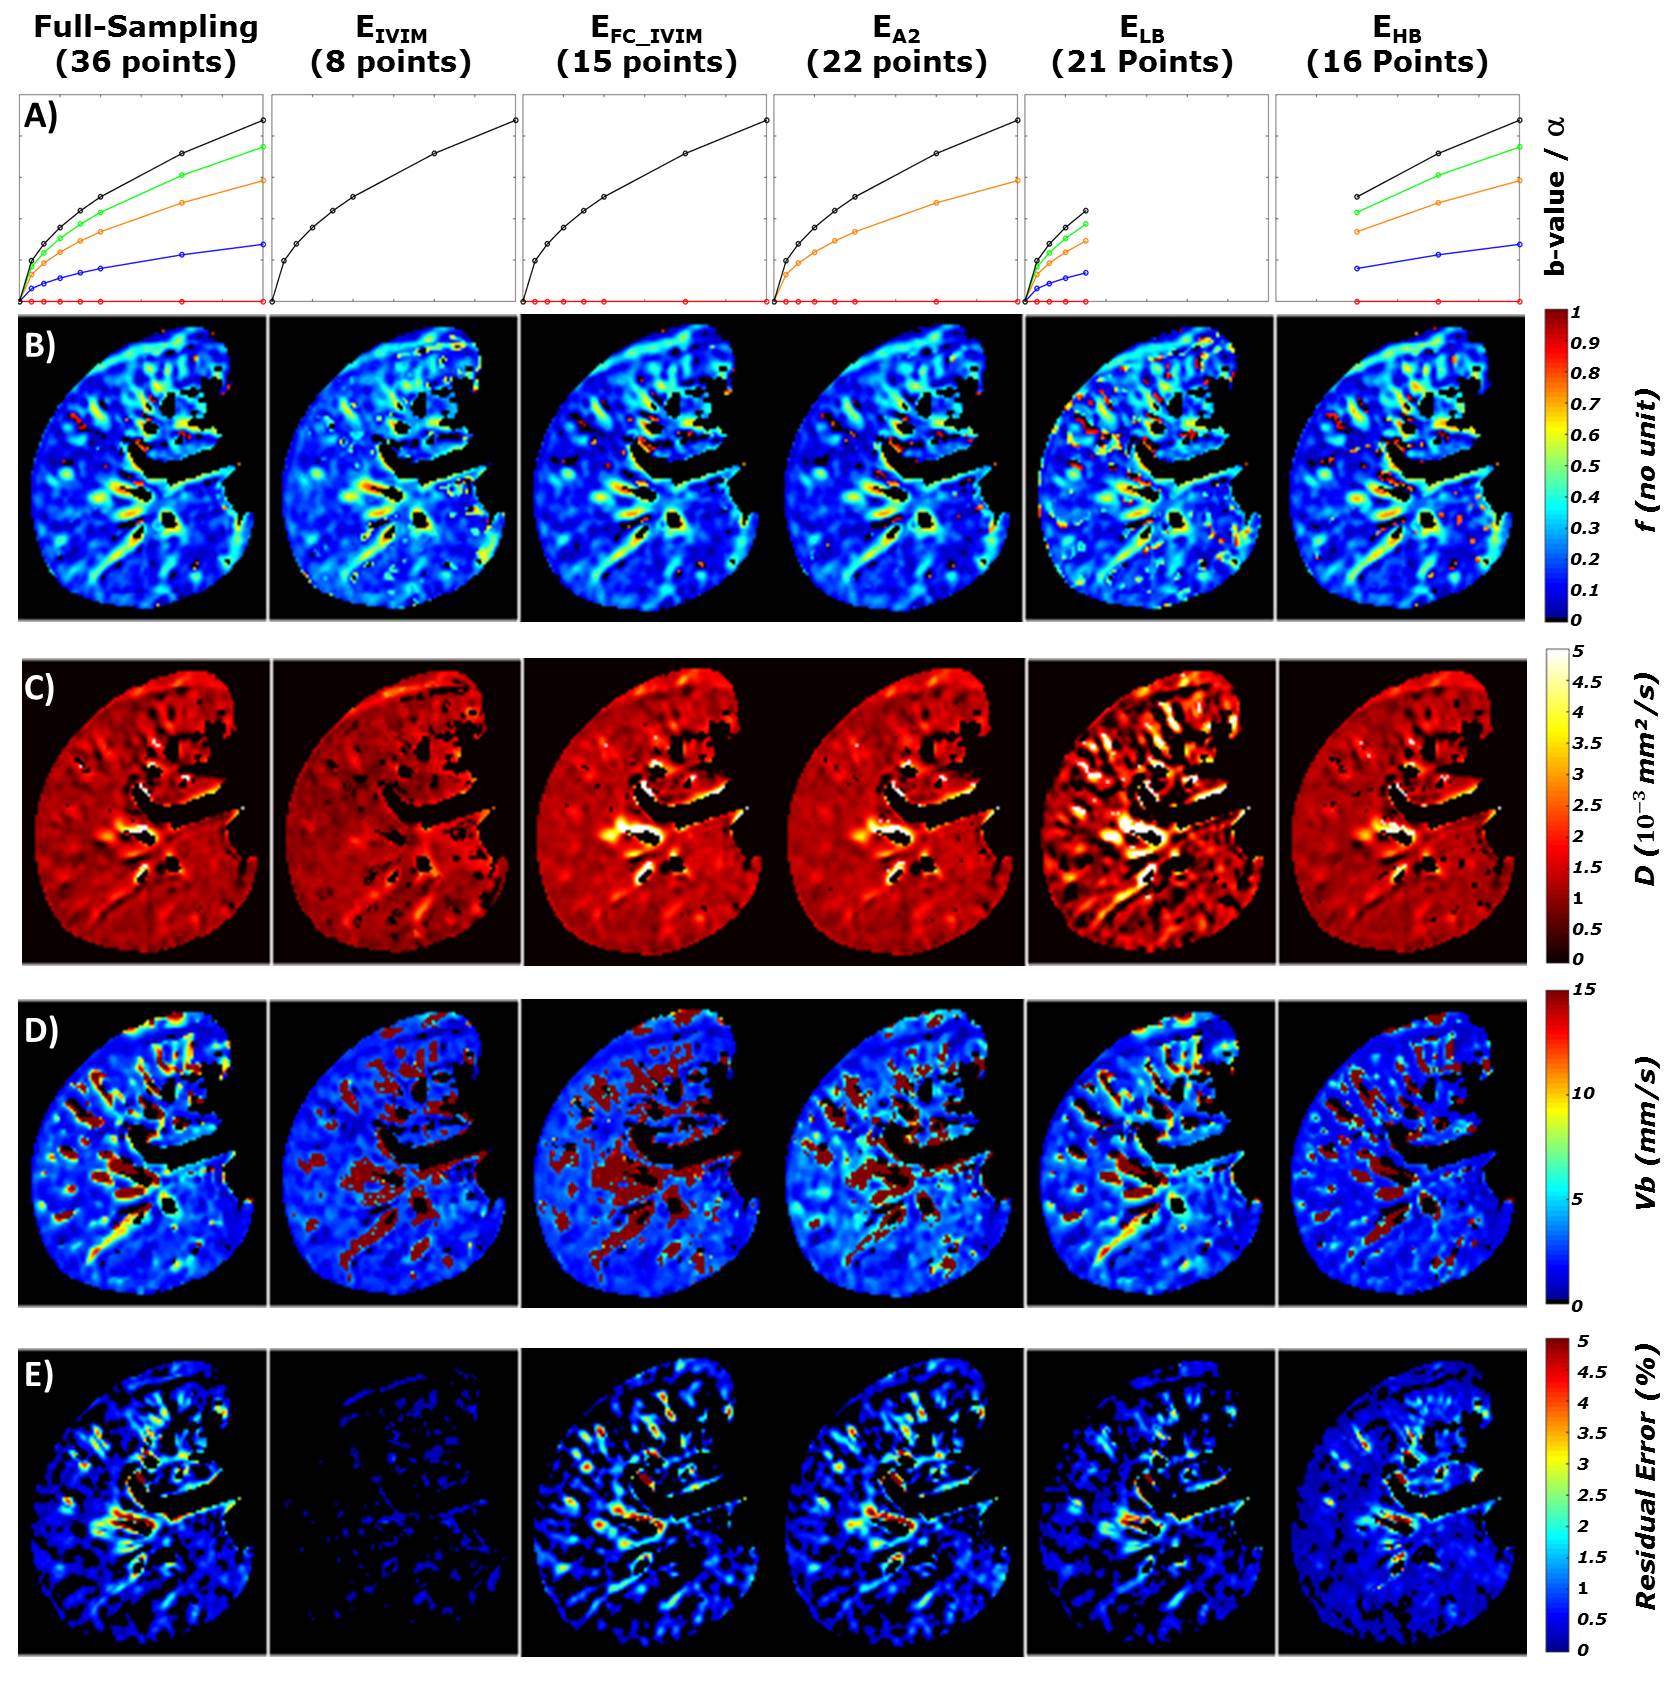
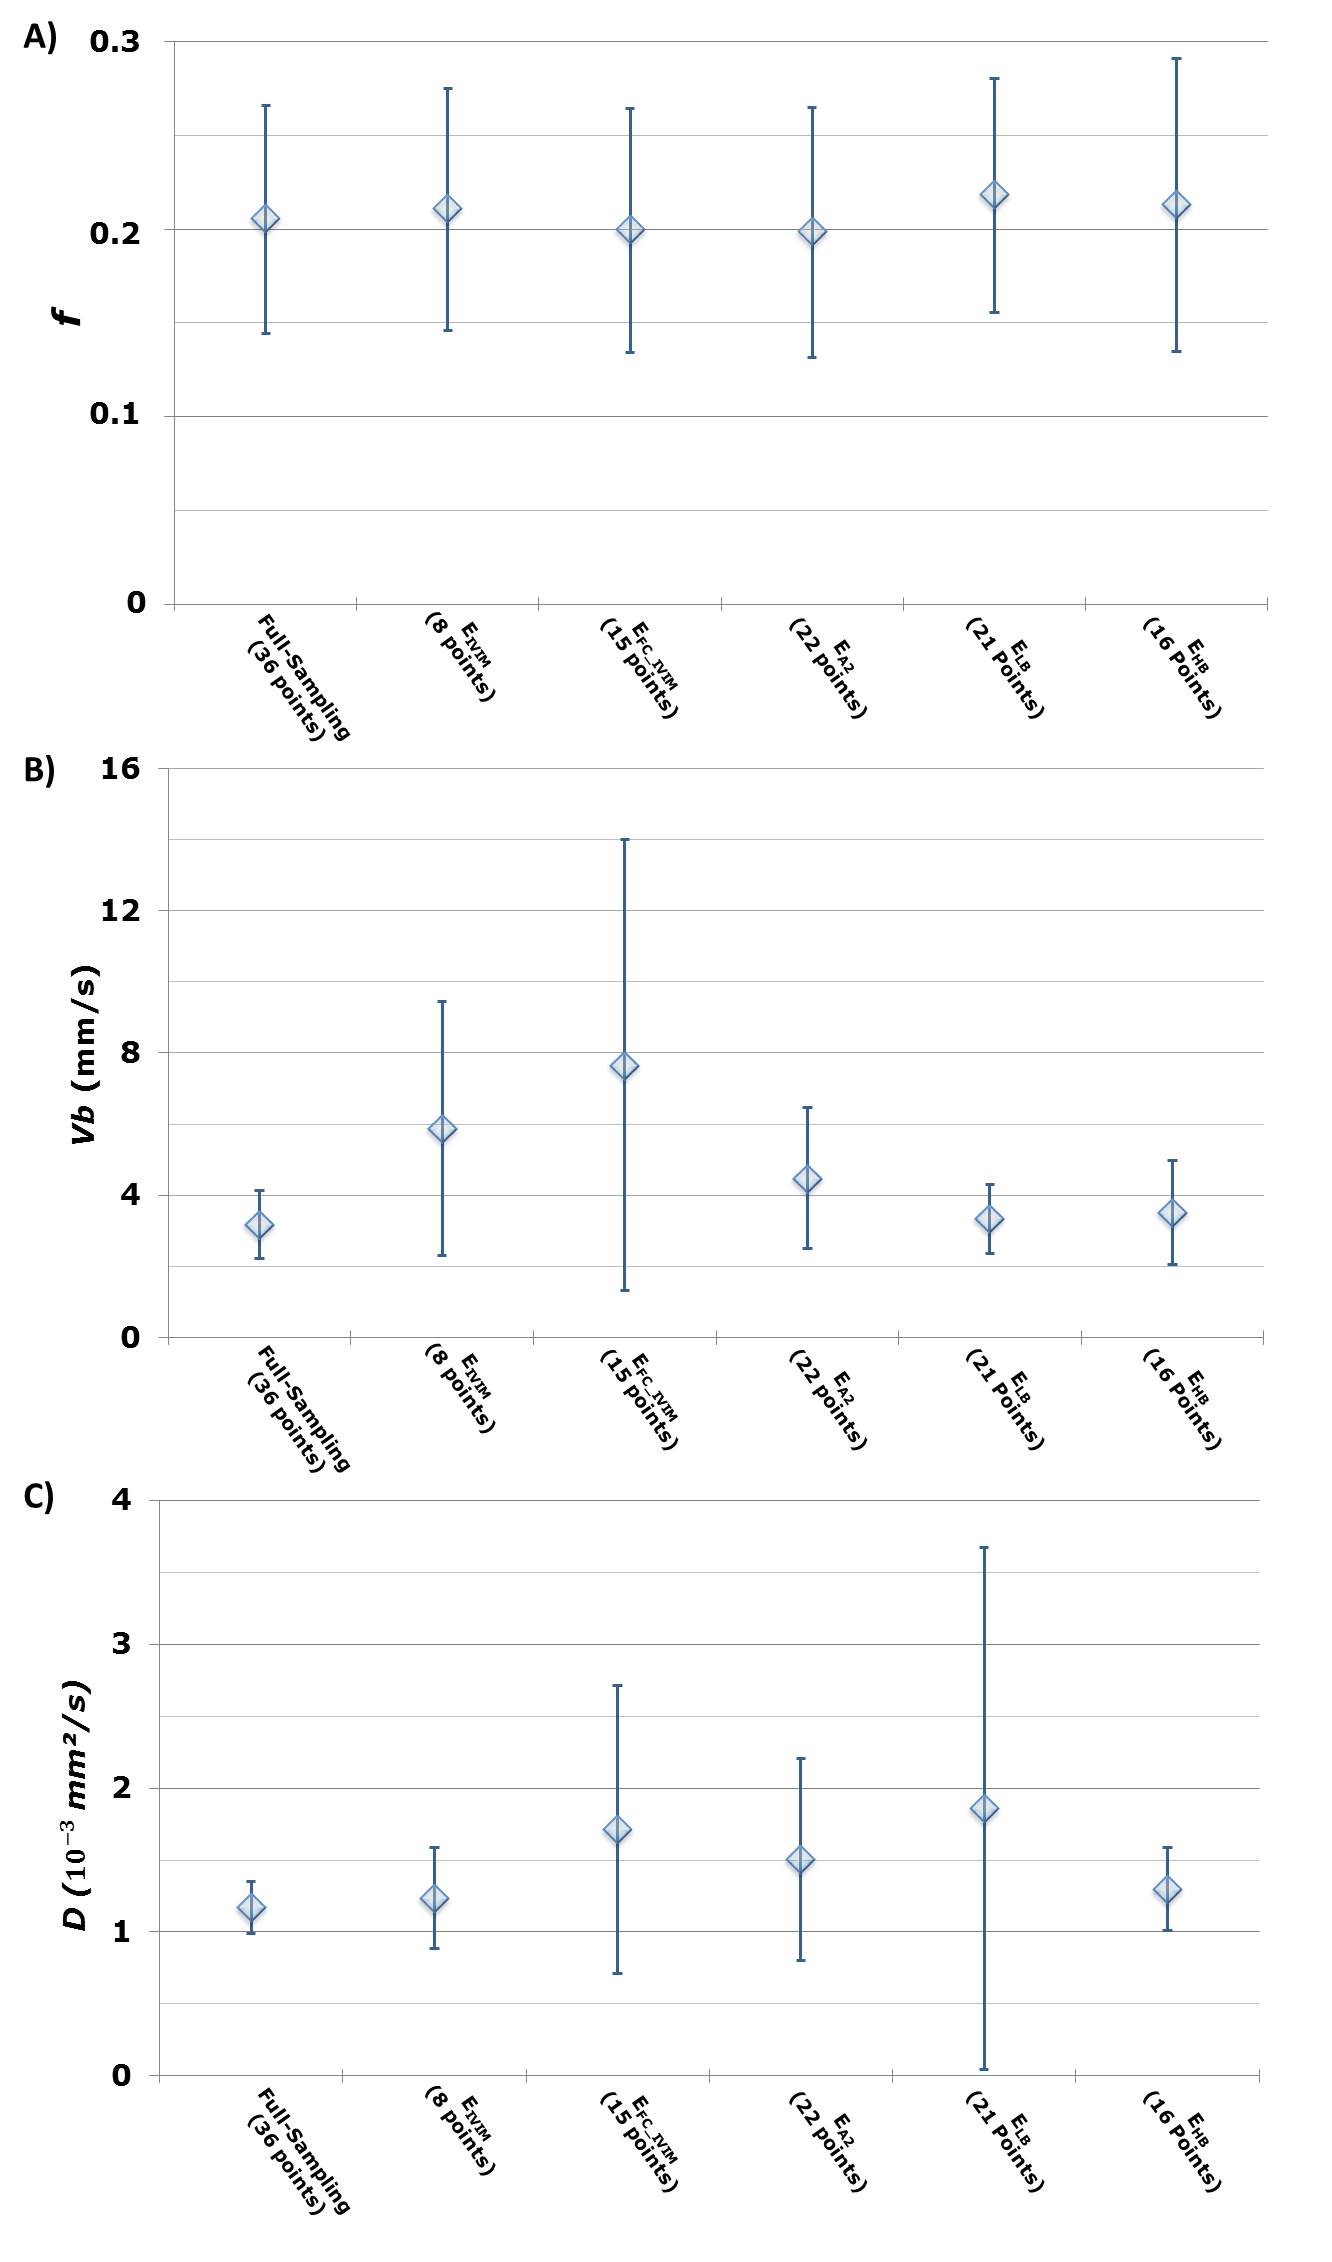
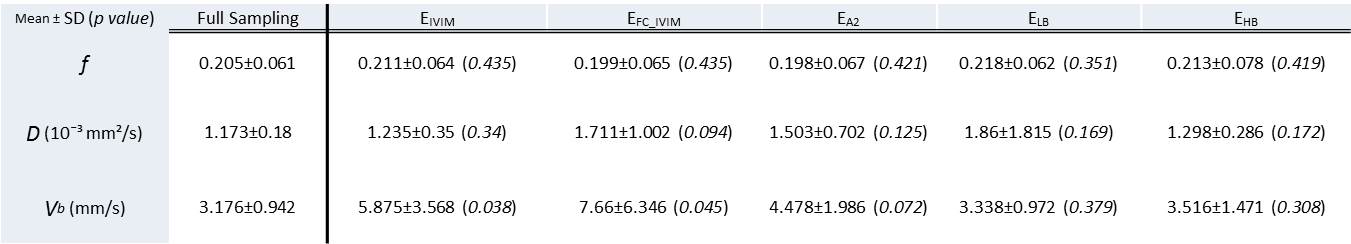
Representative parametric maps for one volunteer are shown in Fig3. The fully sampled reconstruction including all b-values and all flow encoding strengths provides parametric maps with the narrowest distributions (Fig4). Mean±SD of each parameter across volunteers were f =0.20±0.06, D=1.17±0.18x10^-3 mm²/s and Vb=3.18±0.94 mm/s for the fully sampled reconstruction.
As shown in Fig5, no statistical differences were found between sub-sampled and fully-sampled reconstructions for f and D (one-sided t-test) despite a higher distribution across volunteers with EFC_IVIM, EA2 and ELB on D. However, using EIVIM and EFC_IVIM show significant differences (p=0.038, p=0.044) for Vb compared to the fully-sampled reconstruction.
Discussion
In this study, the IVIM parameters were estimated by sampling both the flow encoding strength and b-value dimensions, whereas previous reports only sampled the b-value dimension. EIVIM and EFC_IVIM showed lower precision in the estimation of the perfusion parameter Vb. This is consistent with the lower accuracy of the classical IVIM method for measuring perfusion4. EHB appears to have no significant differences and the lowest variance across volunteers for D compared to the sub-sampling EA2 and ELB. In this specific scenario only 16 points in the b-value/α space are sampled, which correspond to an acquisition as long as the EFC_IVIM (190 images~12 min), while offering better precision.Conclusion
The convex optimization framework7 enables designing efficient combinations of diffusion and flow encoding gradients spanning b-value/α space that increase precision for estimating IVIM parameters, especially Vb and D, in healthy volunteers and could in turn reduce the scan time.Acknowledgements
Funding support from the Department of Radiological Sciences.References
(1) Kele, PG., Jagt, EJVD. (2010) Diffusion weighted imaging in the liver. World J Gastroenterol., 16(13): 1567-1576
(2) Lewis, S., Dyvorne, H., Cui, Y., & Taouli, B. (2014). Diffusion-Weighted Imaging of the liver: techniques and applications. Magnetic Resonance Imaging Clinics of North America, 22(3), 373–395. http://doi.org/10.1016/j.mric.2014.04.009
(3) Le Bihan, D., Breton, E., Lallemand, D., Aubin, ML., Vignaud, J., Laval-Jeantet, M. (1988) Separation of Diffusion and Perfusion in Intravoxel Incoherent Motion MR Imaging, Radiology., 168:497-505
(4) Pekar, J., Moonen, CT., van Zijl, PC. (1992) On the precision of diffusion/perfusion imaging by gradient sensitization. Magn Reson Med. Jan;23(1):122-9.
(5) Ahlgren, A., Knutsson, L., Wirestam, R., Nilsson, M., Ståhlberg, F., Topgaard, D., and Lasic, S. (2016) Quantification of microcirculatory parameters by joint analysis of flow-compensated and non-flow-compensated intravoxel incoherent motion (IVIM) data. NMR Biomed., 29: 640–649. doi: 10.1002/nbm.3505.
(6) Wetscherek, A., Stieltjes, B. and Laun, F. B. (2015), Flow-compensated intravoxel incoherent motion diffusion imaging. Magn. Reson. Med., 74: 410–419. doi:10.1002/mrm.25410
(7) Aliotta, E., Wu, H. H. and Ennis, D. B. (2016), Convex optimized diffusion encoding (CODE) gradient waveforms for minimum echo time and bulk motion–compensated diffusion-weighted MRI. Magn. Reson. Med.. doi:10.1002/mrm.26166
Figures