1190
Pulmonary MRI Ventilation Defects in Asthma: Stochastic or Deterministic?1Robarts Research Institute, London, ON, Canada, 2Division of Respirology, The University of Western Ontario, London, ON, Canada
Synopsis
Pulmonary MRI provides strong evidence of ventilation abnormalities that are temporally and spatially persistent; this has generated a paradigm shift in our understanding of asthma as a spatially and temporally heterogeneous, non-stochastic disease. Based on these findings, here our objective was to develop image-processing methods to estimate and mathematically describe the spatial probability distribution of MRI-derived ventilation defects. To accomplish this, we generated functional lung MRI atlases based on asthmatics who were evaluated before and post-methacholine using hyperpolarized 3He static-ventilation MRI. This proof-of-concept evaluation showed that in asthmatics, ventilation abnormalities are not diffuse nor stochastic, but heterogeneous and deterministic.
Purpose
Pulmonary MRI provides strong evidence of lung ventilation abnormalities that are temporally and spatially persistent; this has generated a paradigm shift in our understanding of asthma as a spatially and temporally heterogeneous, non-stochastic disease. Ventilation heterogeneity was first identified in patients with asthma using multiple-breath-nitrogen-washout studies.1 At the same time, mathematical models of asthmatic airways have pointed to the potential role of stochastic abnormalities as important in the generation of ventilation heterogeneity.2 However, with the development of pulmonary functional MRI, the exact location of functional abnormalities within the asthmatic lung may be determined and evaluated. MRI-derived ventilation defects are now recognized as a hallmark characteristic of asthma,3 and these respond to treatment4 and persist over time.5 We hypothesized that ventilation abnormalities are deterministic and that their spatial distribution will vary depending on disease severity and in response to treatment. Therefore, our objective here was to describe the spatial probability distribution of MRI-derived ventilation defects as a first step towards generating functional atlases of the asthmatic lung.Methods
Subjects and Image Acquisition:
We evaluated baseline and post-methacholine hyperpolarized 3He static-ventilation MRI in 31 patients with a clinical diagnosis of asthma (n=12 mild-moderate, n=19 severe) who provided written informed consent to an ethics-board-approved protocol (NCT02351141). Subjects with baseline forced-expiratory-volume-in-1s (FEV1)≥65%pred (n=12 mild-moderate, n=4 severe) performed a methacholine challenge and underwent imaging directly afterwards. All subjects underwent 1H and 3He MRI using a whole-body 3.0T Discovery MR750 system (General Electric Healthcare, USA) with broadband imaging capabilities. For both 1H and 3He MRI, subjects were instructed to inhale a gas mixture from a 1.0L Tedlar bag from functional-residual-capacity (FRC) and image acquisition was performed during a 16s breath-hold. Anatomical 1H MRI was performed before 3He using the whole-body radiofrequency coil and 1H fast-spoiled, gradient-recalled echo (FGRE) sequence with a partial echo (16s total acquisition time, repetition time (TR)/echo time (TE)/flip angle=4.7ms/1.2ms/30°, field-of-view (FOV)=40x40cm, bandwidth=24.4kHz, matrix=128x80, 15-17 slices, 15mm slice thickness, zero gap). 3He static ventilation images were acquired directly after using a single-channel, rigid elliptical transmit/receive chest coil and fast-gradient echo method with a partial echo (14s total acquisition time, TR/TE/flip angle=4.3ms/1.4ms/7°, FOV=40x40cm, bandwidth=48.8kHz, matrix=128x80, 15-17 slices, 15mm slice thickness, zero gap).
Image Analysis:
3He static ventilation images were segmented to generate ventilation defect percent (VDP) as previously described.6 VDP was defined as ventilation defect volume (VDV) normalized to the volume of the thoracic cavity (TCV). Each and every segmented ventilation image (one for each subject) was co-registered together using deformable registration using the modality-independent neighbourhood descriptor (MIND) method.7 Deformable registration consisted of voxel-wise similarity measurements of the MIND of the two images, as well as diffusion regularization of the deformation field and optimization using the Gauss-Newton framework. Registration was performed with four levels (ie, a downsampling factor of 6, 4, 2 and 1) in a symmetric manner so that the algorithm was not dependent on the choice of the moving or fixed image. The 3He images in each group were registered to the same subject mask to enable direct comparisons. After image registration, the final atlases were evaluated for regional differences and potential airway connectivities to non-random ventilation defects.
Results
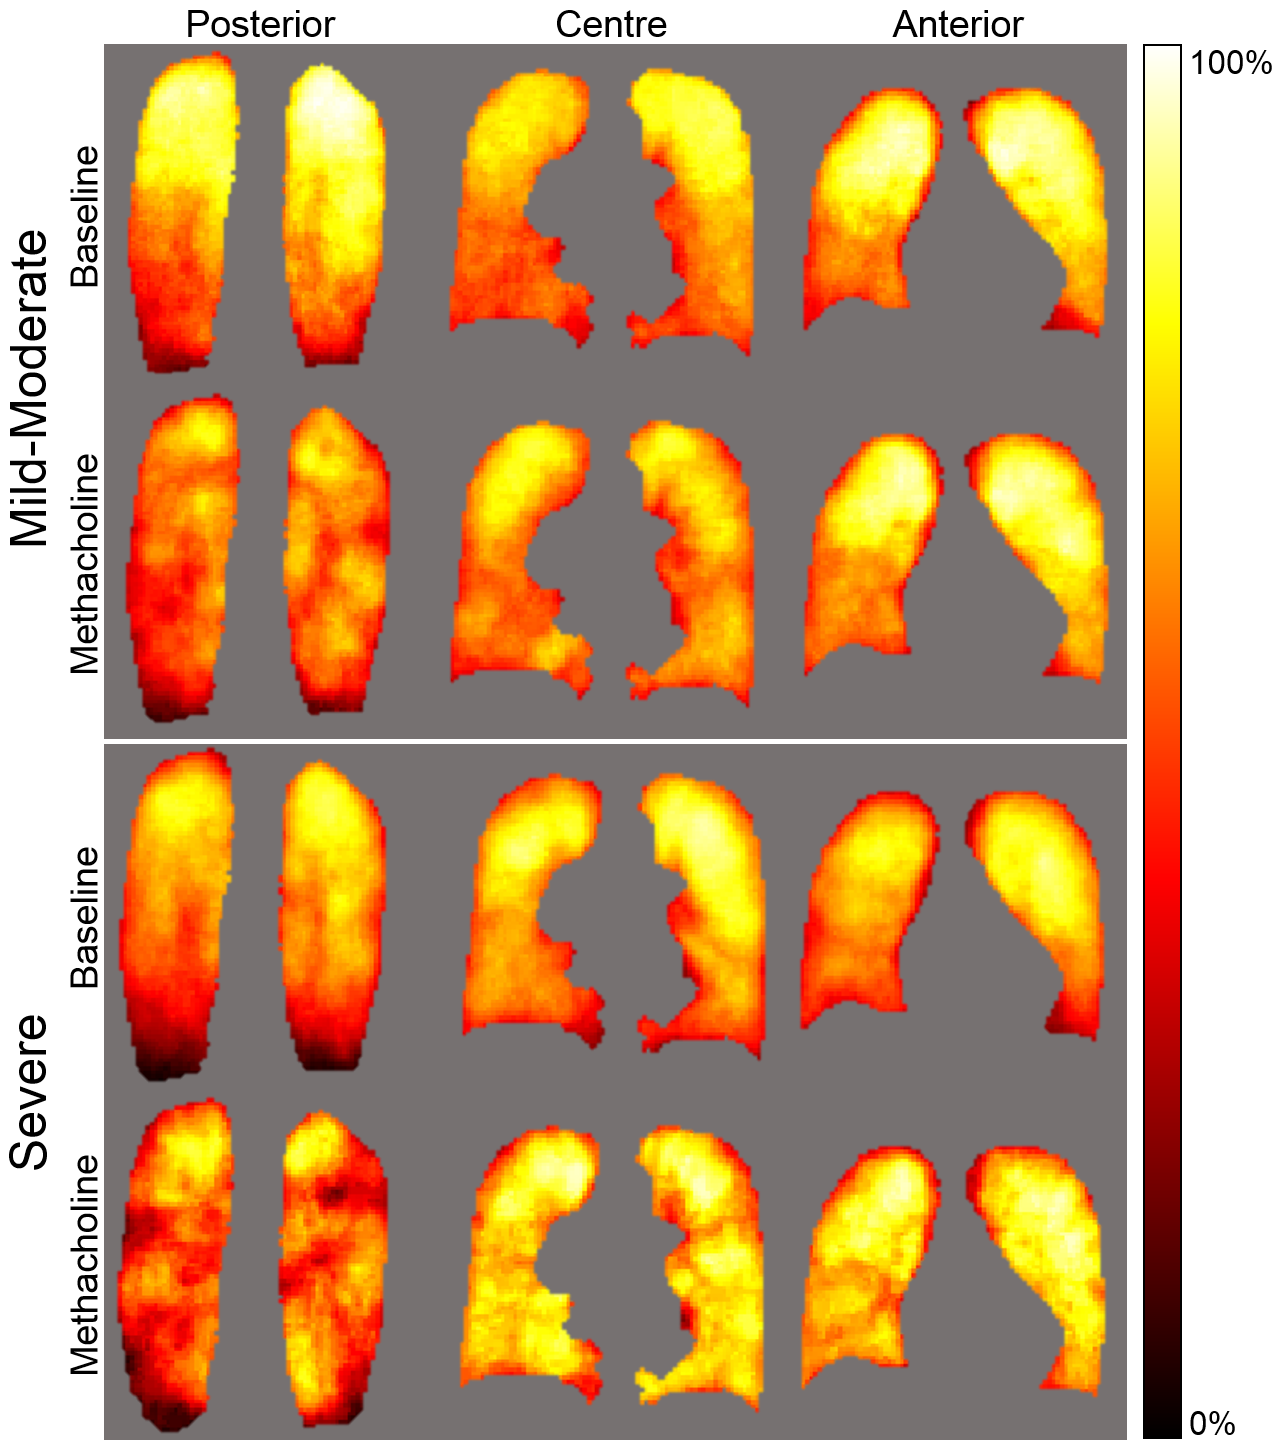
Figure 1 shows ventilation defect probability maps for mild-moderate and severe asthma at baseline and post-methacholine. The spatial distribution of ventilation was qualitatively more heterogeneous following methacholine in both mild-moderate and severe asthma. In both cases, there was a visually obvious superior-inferior gradient, such that superior regions were more likely to be ventilated. This gradient was lessened post-methacholine. There was a visually obvious posterior-anterior ventilation gradient post-methacholine, such that posterior regions were more likely influenced post-methacholine (larger number and greater size of ventilation defect). The pattern of ventilation was more heterogeneous in severe asthma as compared to mild-moderate asthma and this difference was enhanced post-methacholine.Discussion
In this proof-of-concept study, we generated and evaluated functional MRI-derived ventilation atlases showing qualitatively obvious differences in ventilation patterns between mild-moderate and severe asthma as well as the changes in these patterns induced by methacholine. This suggests a deterministic nature of the location of ventilation defects and the abnormally remodeled airways that are hyper-responsive and worsened or constricted post-methacholine. Future work will include the development and application of a probability model of the distribution of ventilation and creation of an airway-tree atlas to determine airways that are abnormally remodeled and may be responsible for ventilation defects.Conclusion
Pulmonary MRI functional atlases strongly support the notion that ventilation abnormalities are not diffuse, nor stochastic.Acknowledgements
We acknowledge Trevor Szekeres, RTMR and Dave Reese, RTMR for MRI of research volunteers.References
1 Bourdin, A. et al. Nitrogen washout slope in poorly controlled asthma. Allergy 61, 85-89, doi:10.1111/j.1398-9995.2006.00970.x (2006).
2 Frey, U. et al. Risk of severe asthma episodes predicted from fluctuation analysis of airway function. Nature 438, 667-670, doi:10.1038/nature04176 (2005).
3 Teague, W. G., Tustison, N. J. & Altes, T. A. Ventilation heterogeneity in asthma. The Journal of asthma : official journal of the Association for the Care of Asthma 51, 677-684, doi:10.3109/02770903.2014.914535 (2014).
4 Samee, S. et al. Imaging the lungs in asthmatic patients by using hyperpolarized helium-3 magnetic resonance: assessment of response to methacholine and exercise challenge. The Journal of allergy and clinical immunology 111, 1205-1211 (2003).
5 de Lange, E. E. et al. Changes in regional airflow obstruction over time in the lungs of patients with asthma: evaluation with 3He MR imaging. Radiology 250, 567-575, doi:10.1148/radiol.2502080188 (2009).
6 Kirby, M. et al. Hyperpolarized 3He magnetic resonance functional imaging semiautomated segmentation. Academic radiology 19, 141-152, doi:10.1016/j.acra.2011.10.007 (2012).
7 Heinrich, M. P. et al. MIND: modality independent neighbourhood descriptor for multi-modal deformable registration. Medical image analysis 16, 1423-1435, doi:10.1016/j.media.2012.05.008 (2012).
Figures