1189
Respiratory self-gating and estimation of gas/proton fractions in SF6 and proton lung imaging in free-breathing mice1Core Facility Small Animal MRI, Ulm University, Ulm, Germany, 2Internal Medicine II, University Hospital of Ulm, Ulm, Germany
Synopsis
Fluorinated gases are a promising alternative to hyperpolarized gases to study ventilation in clinical and preclinical applications. 3D Ultra Short Echo Time (UTE) acquisitions can be employed to visualize inhaled SF6 and lung parenchyma. DC self-gating was applied to discriminate between inspiration and expiration in free-breathing acquisitions. Proton and gas density were estimated in inspiration, expiration and in ungated data. The information derived from tissue-density changes matched the changes observed in the gas density, thus indicating the ventilation information can be derived from tissue density mapping.
Purpose
Methods
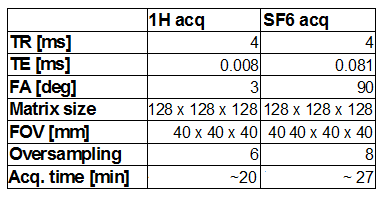
Seven adult NMR mice weighting between 30 and 38 g were investigated. To avoid any signal contribution from halothane/isofluorane, an intraperitoneal injection of ketamin (2 mg/30 g) and xylazine (0.4 mg/30 g) was applied for anesthesia. SF6 was delivered through a custom-built mask positioned outside the coil. A small glass vial containing pure SF6 at 105 Pa was placed inside the coil next to the animal as reference. All acquisitions were performed with an 11.7 T small animal system (BioSpec 117/16, Bruker, Ettlingen, Germany) using a 1H/19F Tx/Rx volume coil. Quasi Random (QR) projections ordering was applied to all 3D UTE acquisition to allow for respiratory self -gating (2). 1H QR 3D UTE was acquired under air ventilation. 19F data was acquired with a density adapted (3) QR 3D UTE under 70% SF6 and 30% O2 ventilation (parameters provided in Table 1). Respiratory gated reconstructions were performed for both scans based on the DC (k=0, bandpass filter 0.5 – 1.5 Hz) signal variations. The data was divided into 10 equally spaced bins (respiratory stages), with the extreme positions identified as peak inspiration and peak expiration. Lungs were semi-automatically segmented from the 1H images. Localized lung proton density was derived by normalizing the lung signal with the mean muscle signal intensity, and the gas density by normalization with signal intensity in the gas vial, considering the 70/30% inhaled SF6/O2 mixture. The mean 1H density (fraction of tissue filled space), the gas concentration (fraction of gas-filled space), and the respected sum were calculated for non-gated and peak inspiration/expiration datasets.Results
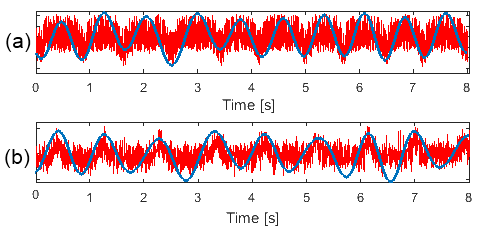
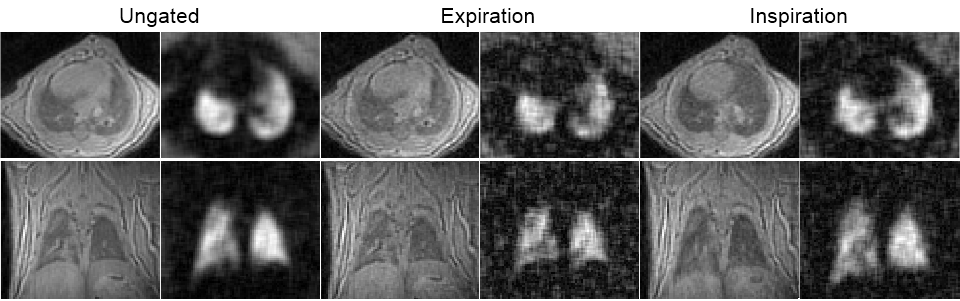
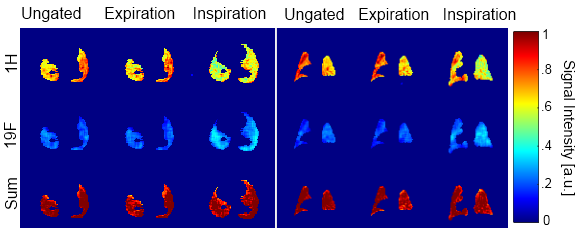
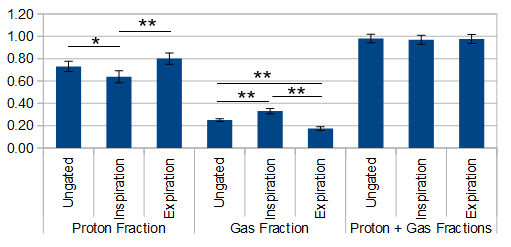
Self-gating was feasible for 1H UTE and 19F UTE acquisitions. In both cases, the DC signal clearly showed respiratory induced oscillation with 1 Hz frequency (fig.1). Please note that the 1H proton increases during expiration (increased tissue volume in the FOV), while the 19F signal increases in inspiration (increased gas volume). An example of ungated and peak inspiration/expiration reconstructions for 1H and 19F acquisitions is presented in fig. 2. The larger lung volume and respective caudal shift of the diaphragm are clearly visible in peak inspiration for both nuclei. Fig. 3 shows the tissue/gas densities derived from the 1H and SF6 as well as the respective sum for ungated and inspiration/expiration gated images with the respective mean and standard deviation data provided in fig. 4. Proton concentration in the lung is significantly lower at peak inspiration (p=0.0001) than in peak expiration, while for SF6 it is vice-versa, yielding higher signal during inspiration (p<0.0001, one way Anova with Bonferroni correction). The sum of proton and gas density results to 0.98 ± 0.03 for averaged data, 0.96 ± 0.03 for inspiration and 0.97± 0.03 for expiration.Discussion
In this work, we
applied a DC-SG protocol to reconstruct different respiratory stages
in mice freely breathing a mixture of SF6 and O2. From the data,
proton (tissue) and 19F (gas) densities were calculated over the lung
volume. With the assumption of negligible transversal relaxation
(short TE), similar T1 of muscle and lung (4), and uniform B1-/B1+
field, we verified that gas/tissue densities can be derived from the
proposed approach. Considering that the sum of both densities equals
one, this indicates that static fluorinated gas imaging may not be
required in small animal MRI for assessment of the ventilation, as
evaluation of the tissue density variation by 1H imaging might be
sufficient.Acknowledgements
No acknowledgement found.References
1 . Couch MJ, Ball IK, Li T, et al. Inert fluorinated gas MRI: a new pulmonary imaging modality. NMR in Biomed. 2014; 27(12): 1525–1534.
2. Tibiletti M, Paul J, Bianchi A, Wundrak S, Rottbauer W, Stiller D, Rasche V. Multistage Three-Dimensional UTE Lung Imaging by Image-Based Self-Gating. Magnetic Resonance in Medicine. 2016;73(3): 1324-1332.
3. Nagel AM, Laun FB, Weber M, et al. Sodium MRI Using a Density-Adapted 3D Radial Acquisition Technique. Magnetic Resonance in Medicine. 2009;62:1565–1573
4: Tibiletti M, Bianchi A, Stiller D, Rasche V. Pulmonary perfusion quantification with flow-sensitive inversion recovery (FAIR) UTE MRI in small animal imaging. NMR in Biomed. 2016; DOI:10.1002/nbm.3657
Figures