1187
Oxygen-enhanced pulmonary relaxometry using ultra-fast steady-state free precession imaging1Division of Radiological Physics, Department of Radiology, University of Basel Hospital, Basel, Switzerland, 2Department of Biomedical Engineering, University of Basel, Basel, Switzerland
Synopsis
This study demonstrates the feasibility of fast and simultaneous T1 and T2 mapping of the lung parenchyma in oxygen-enhanced MRI. The data acquisition was performed using an adapted 2D inversion recovery ultra-fast steady-state free precession imaging in healthy human subjects. Relaxation time maps were generated for normoxic and hyperoxic acquisitions. Statistical analysis was performed to compare the relaxation times in the lung parenchyma for both gas conditions.
Purpose
Pulmonary oxygen-enhanced (OE) MRI1, exploits the weak paramagnetic properties of oxygen in blood and results in shortened T1 and T2* relaxation times in the lung when breathing air under hyperoxic condition. Relaxation time mapping and the relative difference in relaxation times between the normoxic and hyperoxic conditions can yield an important diagnostic information on pulmonary diseases. However, the application of the contemporary OE-MRI methods is limited due to a low signal-to-noise ratio in the lung parenchyma2 or by long acquisition time requiring multiple breathholds.3 Recently a pulse sequence termed 'inversion recovery ultra-fast steady-state free precession' (IR-ufSSFP) was presented for simultaneous T1 and T2 mapping of the parenchymal tissue. The main advantages of IR-ufSSFP for pulmonary imaging are the mitigation of banding artifacts, reduction of acquisition time due to shortened TR, as well as an increase in parenchymal signal.4 In this work we test the feasibility of IR-ufSSFP for OE-MRI in the human lung.
Methods
IR-ufSSFP acquisition scheme
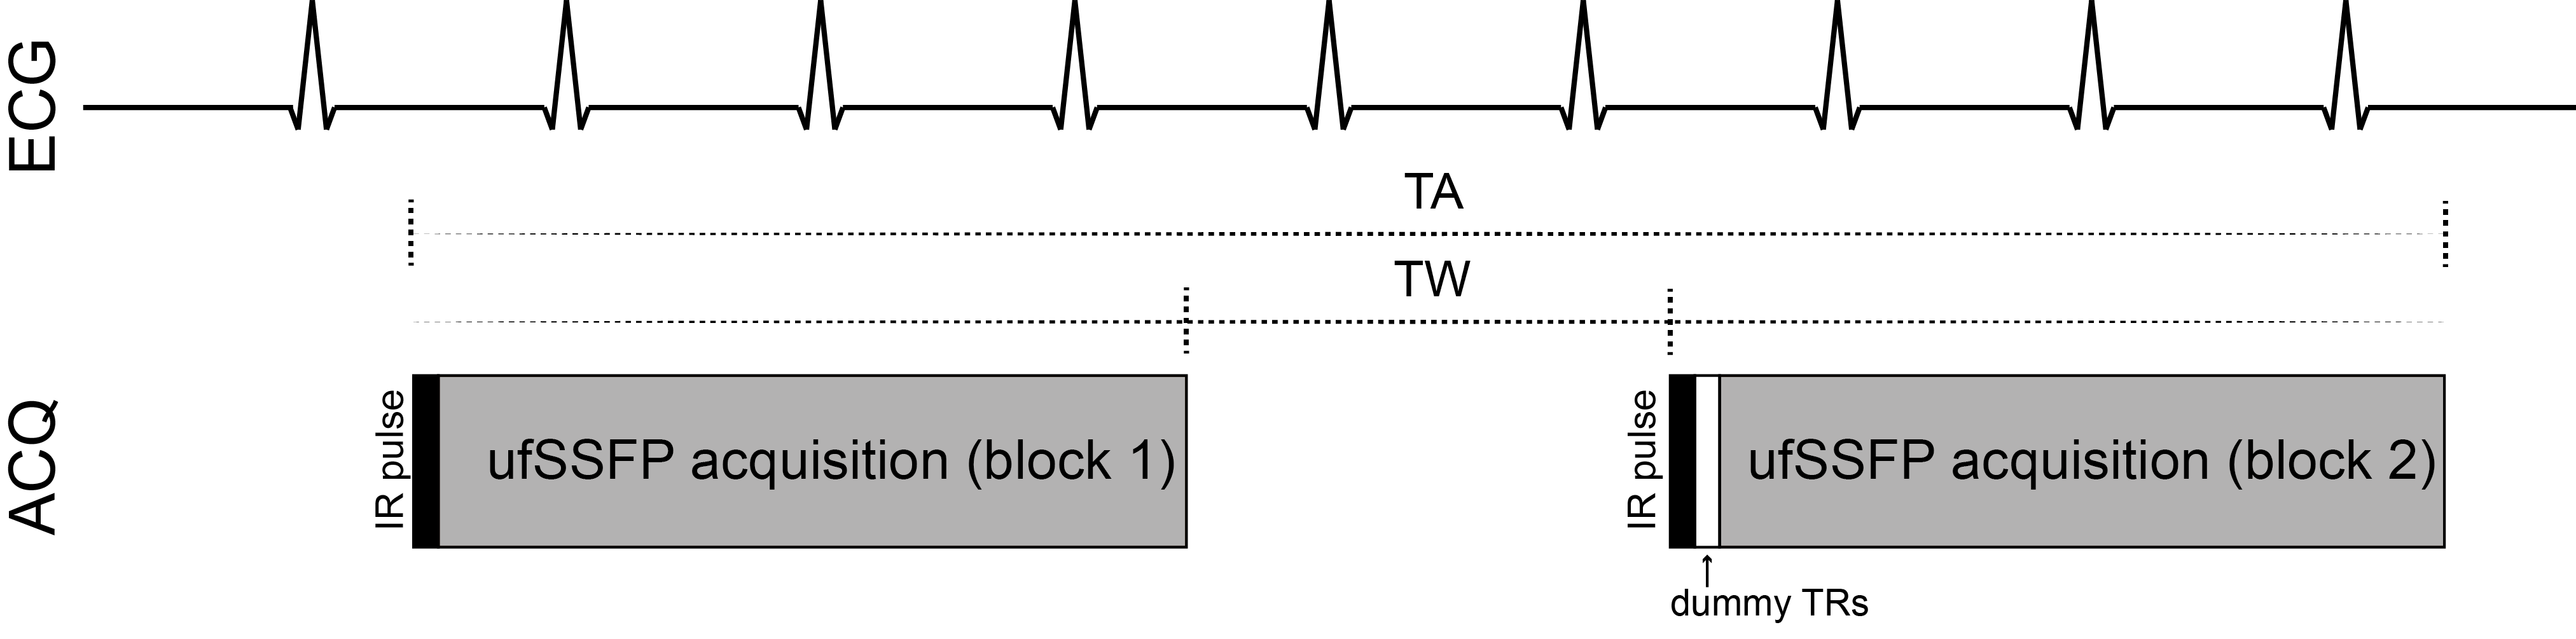
The acquisition scheme of IR-ufSSFP is based on two-dimensional (2D) time resolved transient state imaging preceded by a nonselective adiabatic inversion pulse (Figure 1). ECG-monitoring was activated and the scanning procedure was triggered at a configurable delay after the detected R peak. The scanning scheme produces two inter-leaved sets of images i.e. shifted with respect to the time points at which k-space center is sampled, for improved sampling of the transient ufSSFP signal. The two ufSSFP acquisition blocks are separated by a time interval of 3 s.
OE-MRI data acquisition
Experiments were performed on a 1.5T MR-scanner (MAGNETOM Avanto-Fit, Siemens Healthineers). Five healthy volunteers were scanned in supine position in expiratory breathhold. For each volunteer a set of three coronal and two sagittal images was acquired with IR-ufSSFP while breathing room air (normoxic condition) and after a 4 min O2 wash-in phase, while breathing pure oxygen (hyperoxic condition). Oxygen was delivered at a flow rate of 25L/min using a face mask with a reservoir bag.The parameters of the 2D IR-ufSSFP sequence were as follows: field-of-view=450×450 mm2, slice thickness=10 mm, in-plane resolution=2.8×2.8 mm2, TE/TR=0.71/1.63 ms, acquisition time per image=150 ms, 8 seconds per slice, bandwidth=1955 Hz/pixel, two acquisition blocks with 16 images each, flip angle=45°, parallel imaging GRAPPA factor 2, 10 dummy TRs after the second inversion recovery pulse.
Postprocessing and data evaluation
Images acquired in the diastolic phase were used for postprocessing. Maps of T1 and T2 and the relaxation time difference were generated using voxel-wise nonlinear fitting of the transient bSSFP signal evolution.5 For improved accuracy, a correction for 2D slice profile effects6 as well as the inversion efficiency7 was performed.
A non-rigid registration algorithm8 was used to compensate for small misalignments between the acquisitions acquired using medical air and oxygen. The lungs were segmented in every volunteer using a region growing algorithm excluding the large vessels. Segmentation masks and regions of interest were used for the statistical analysis of the generated maps. Mann-Whitney U test was used to compare the distributions of T1 and T2 values measured for both gas conditions. P values less than 0.05 were considered to indicate statistically significant differences.
Results
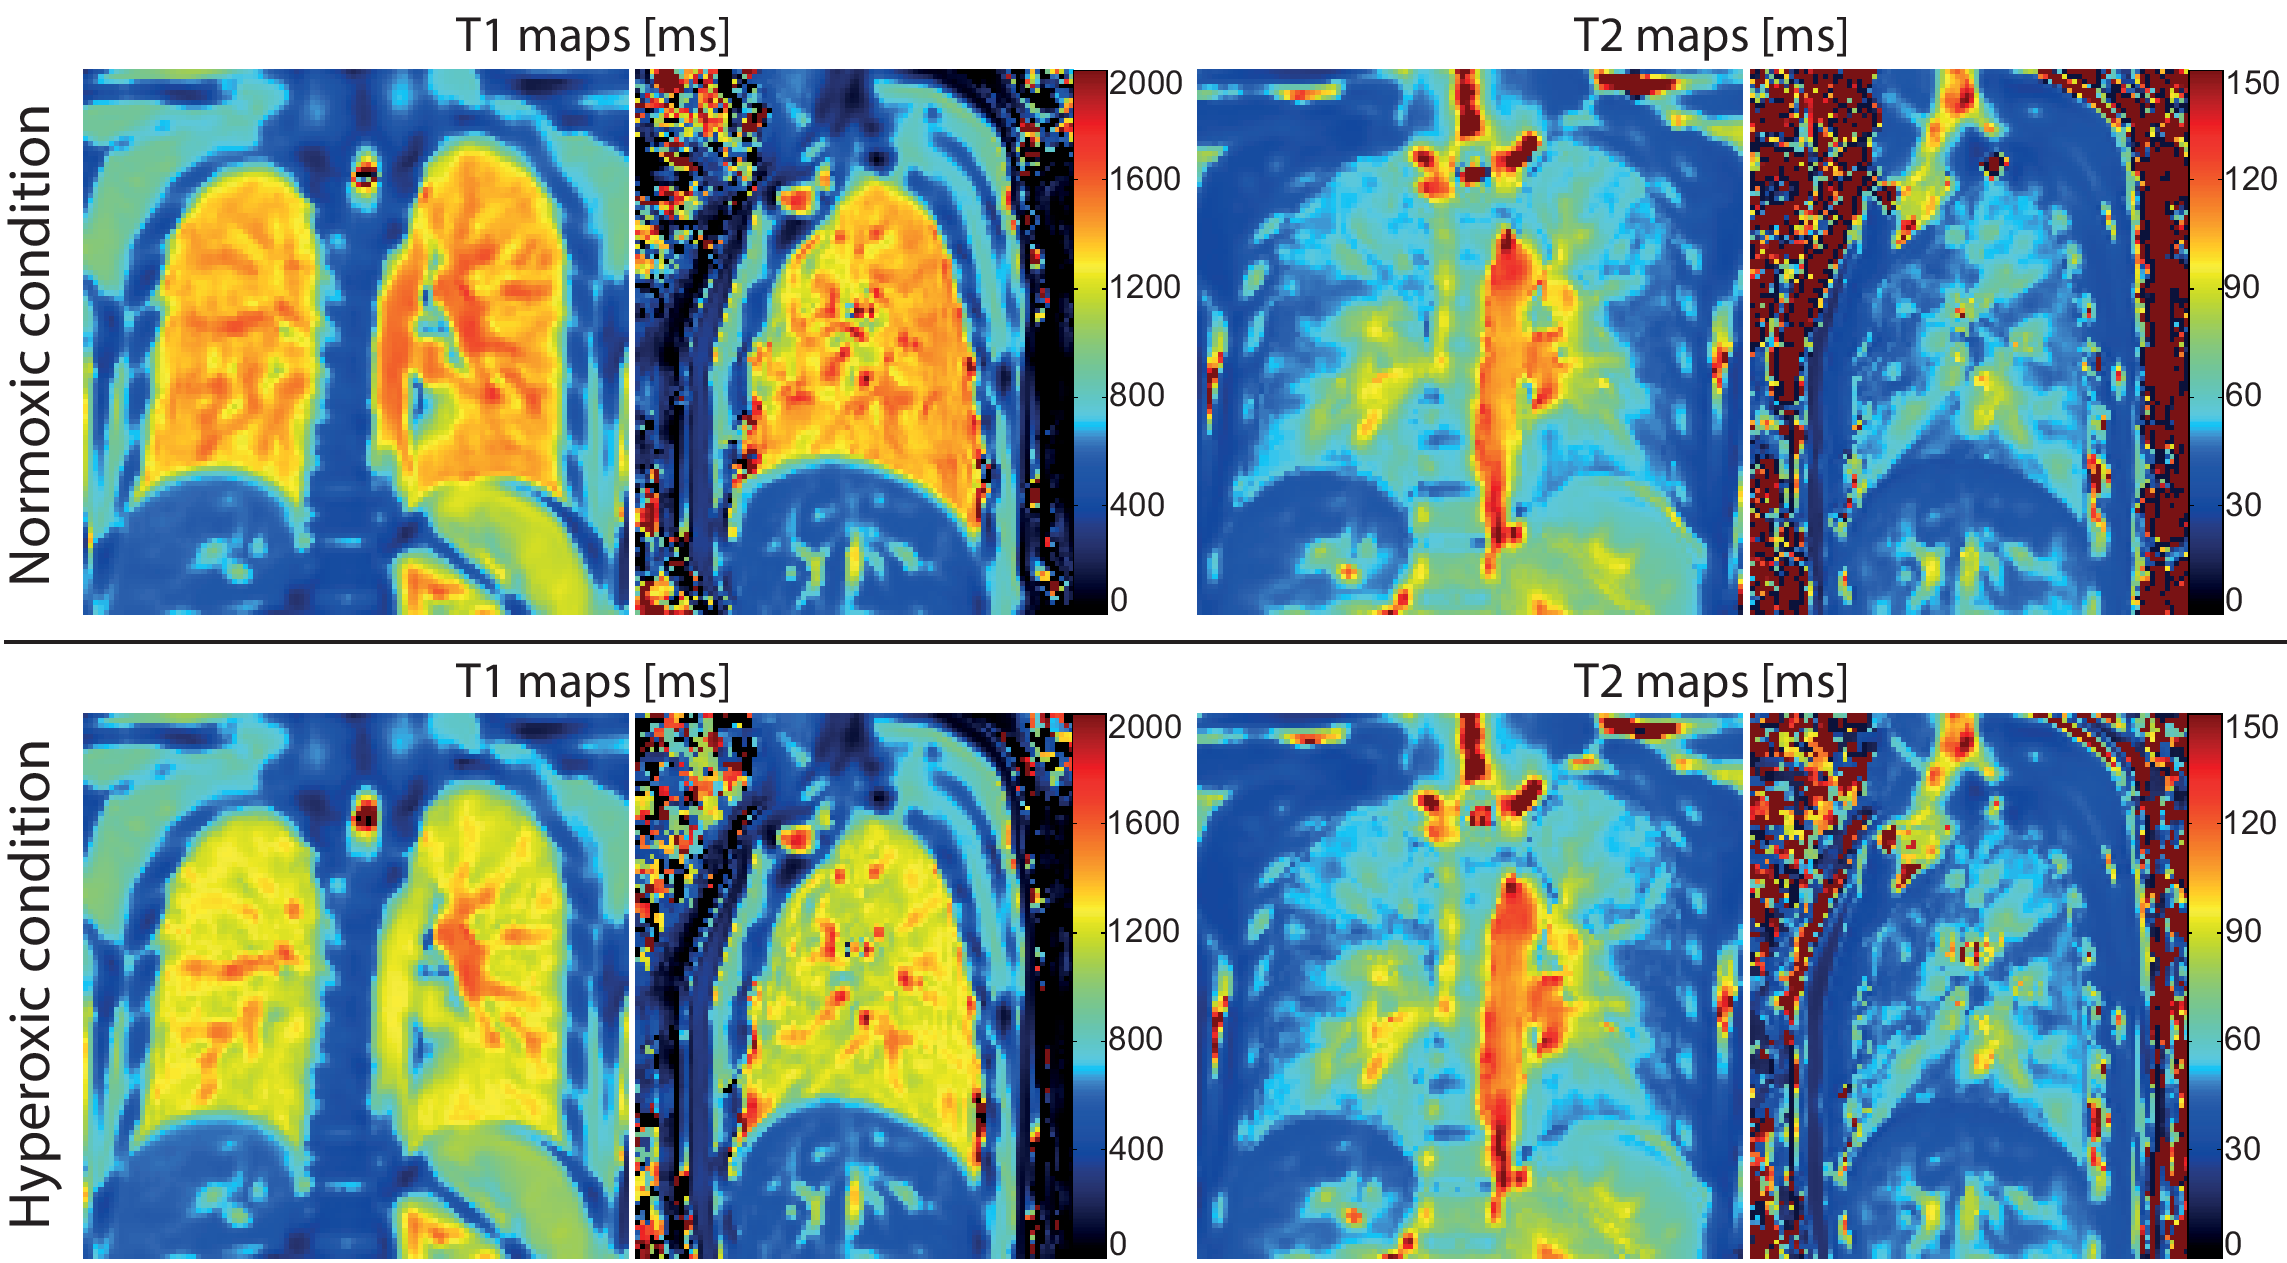
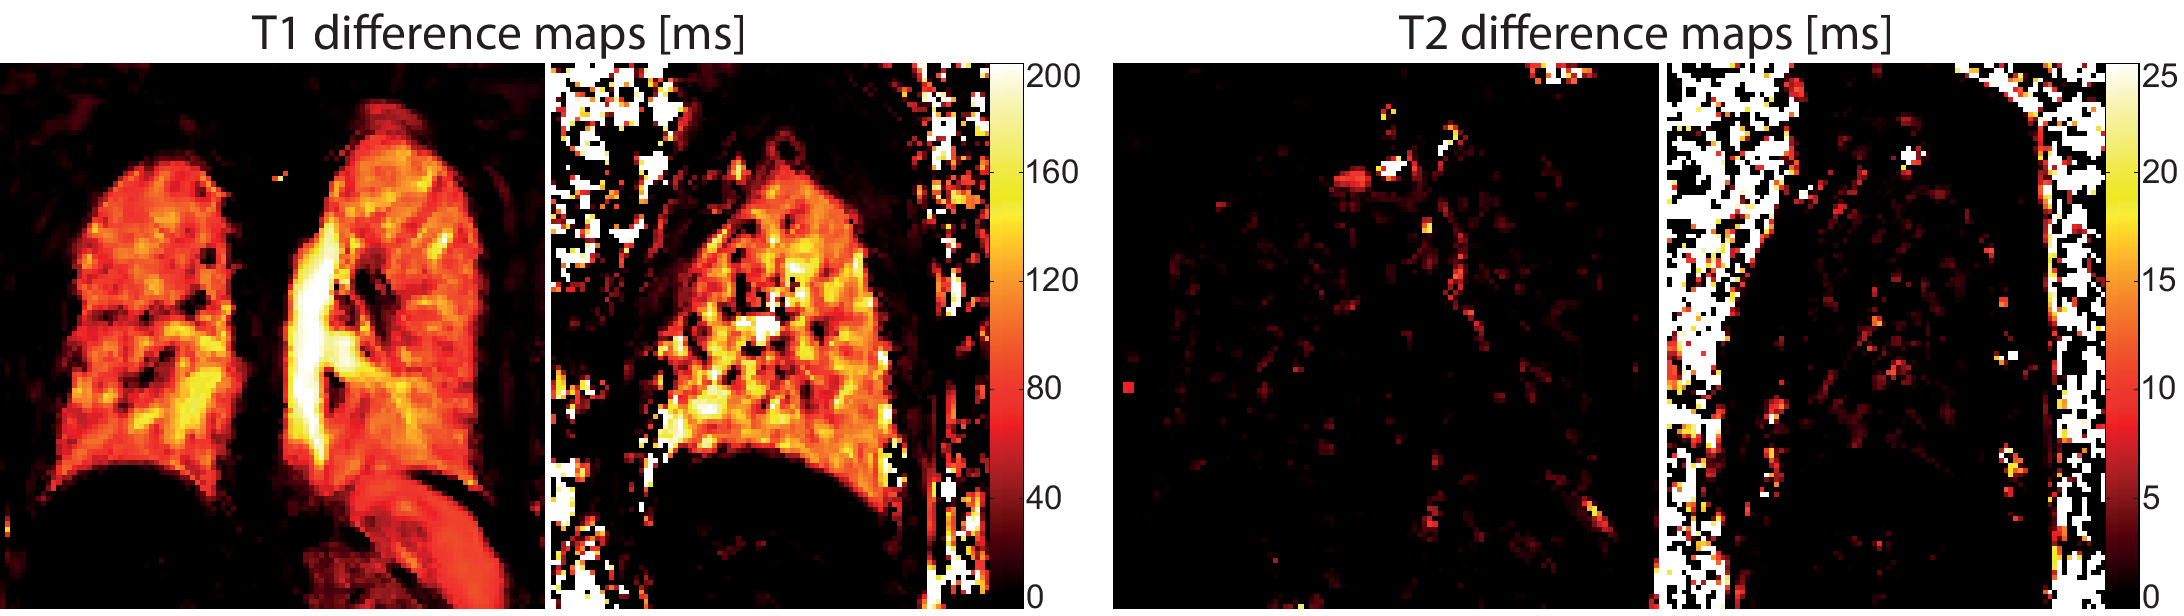
The mean relaxivities in the segmented lung parenchyma in the normoxic condition were T1=1390±67 ms, T2=58±16 ms, and in the hyperoxic condition T1=1269±63 ms, T2=57±17 ms. Exemplary relaxation time maps acquired while breathing room air and oxygen are shown in Figure 2. The average differences in the relaxation times measured for both gases were: ΔT1=122±23 ms (relative change of 8.8±1.7%) and ΔT2=1±1 ms (relative change of 1.1±3.9%). The change in T1 was statistically significant in every volunteer P<10-6, while the change in T2 was not significant (P=0.7). Figure 3 shows representative T1 and T2 relaxation time difference maps in a healthy volunteer.Discussion and Conclusion
In this work we have demonstrated the feasibility of quantitative oxygen-enhanced MRI using an IR-ufSSFP. The presented technique allows for a simultaneous measurement of T1 and T2 relaxation times in less than 8 seconds per slice while breathing medical air or oxygen. This represents a considerable scan time reduction as compared to 2D IR-HASTE technique. Furthermore, the optimized ufSSFP acquisition provides higher SNR per time unit in the lung tissue than the contemporary IR-Snapshot FLASH technique.The application of nonrigid image registration allowed for the calculation of relaxation time difference maps. Future studies will focus on the potential of oxygen-enhanced IR-ufSSFP imaging in patients with pulmonary diseases.
Acknowledgements
Swiss National Science Foundation; Grant number: SNFAQ1320030_149576.References
1. Edelman RR, Hatabu H, Tadamura E et al. Noninvasive assessment of regional ventilation in the human lung using oxygen-enhanced magnetic resonance imaging. Nat Med. 1996 Nov;2(11):1236-9.
2. Arnold JF, Fidler F, Wang T, Pracht ED, Schmidt M, Jakob PM. Imaging lung function using rapid dynamic acquisition of T1-maps during oxygen enhancement. MAGMA. 2004 Apr;16(5):246-53.
3. Naish JH, Parker GJ, Beatty PC et al. Improved quantitative dynamic regional oxygen-enhanced pulmonary imaging usingimage registration. Magn Reson Med. 2005 Aug;54(2):464-9.
4. Bauman G, Santini F, Pusterla O, Bieri O. Pulmonary relaxometry with inversionrecovery ultra-fast steady-state free precession at 1.5T. Magn Reson Med. 2016Oct 19. doi: 10.1002/mrm.26490. [Epub ahead of print]
5. Schmitt P, Griswold MA, Jakob PM et al. Inversion recovery TrueFISP: quantification of T(1), T(2), and spin density. Magn Reson Med 2004;51:661–667.
6. Santini F, Kawel-Boehm N, Greiser A et al. Simultaneous T1 and T2 quantification of the myocardium using cardiac balanced-SSFP inversion recovery with interleaved sampling acquisition (CABIRIA). Magn Reson Med 2015;74:365–371.
7. Kellman P, Herzka DA, Hansen MS. Adiabatic inversion pulses for myocardial T1 mapping. Magn Reson Med2014;71:1428–1434.
8. Chefd’hotel C, Hermosillo G, Faugeras O. Flows of diffeomorphisms for multimodal image registration. In: Proceedings of the IEEE International Symposium on Biomedical Imaging (ISBI’2002), Washington, DC, USA, July 2002. pp. 753–756.Figures