1186
Quantitative ventilation-perfusion imaging using co-registered hyperpolarized gas and contrast enhanced 1H perfusion MRI1POLARIS, Academic Unit of Radiology, University of Sheffield, Sheffield, United Kingdom, 2Academic Unit of Clinical Oncology, University of Sheffield, Sheffield, United Kingdom, 3Insigneo Institute for in silico Medicine, Sheffield, United Kingdom
Synopsis
Analysis of the matching of ventilation and perfusion using MRI is an important area of research in the pulmonary MRI community. This work presents a quantitative method of voxelwise analysis of ventilation from hyperpolarized gas MRI and perfusion from dynamic contrast enhanced 1H MRI. The method developed allows for direct comparison of ventilation and perfusion including global measurements of ventilated and perfused volume.
Background
Ventilation and perfusion (V-Q) imaging is an important tool to analyse various lung diseases. Most commonly V-Q imaging is done using single photon emission computed tomography (SPECT)1,2. SPECT uses ionising radiation and has lower spatial resolution than MRI. MRI is more readily available therefore a method using hyperpolarized (HP) gas 1H contrast enhanced (CE) imaging to quantify the matching of V and Q is a key area of research within the pulmonary MRI community. Using these methods it may be possible to identify areas of shunt and wasted ventilation, which do not contribute to gas exchange3. To analyse ventilation in a quantitative manner the fractional ventilation (FV) method developed by Tzeng et al4 was used along with the quantitative measure of pulmonary blood volume5 (PBV).Purpose
To develop software for quantitative assessment of ventilation (V) and perfusion (Q) matching in four healthy volunteers and two asthmatic patients with images acquired using HP gas and CE 1H MRI.Methods
4 healthy volunteers and 2 asthma patients were imaged with same-breath hyperpolarized Helium-3 (3He) MRI and proton (1H) MRI at 1.5T6,7 (GE HDx, Milwaukee, WI). Same-breath 3He and 1H images were acquired at functional residual capacity plus 1 liter (FRC+1).
3He / 1H anatomical imaging: Volunteers were imaged with a 3He transmit- receive vest coil (CMRS) after inhalation of a mix of hyperpolarized 3He (polarized to 25%, 200ml) and N2 (800ml). Breath-hold ventilation-weighted images were acquired using a 3D bSSFP sequence with full lung coverage and reconstructed voxel size 1.5x1.5x5mm. 1H anatomical images were acquired during the same breath-hold with the body coil6,7 using a 3D SPGR sequence with full lung coverage and the same resolution. In the case of the patients 2D sequences were used8.
1H T1 imaging: Images were acquired at three different flip angles using a 3D SPGR sequence with full lung coverage and reconstructed voxel size 1.8x1.8x4mm immediately before the CE 1H perfusion scan9 for both healthy volunteers and patients.
1H CE perfusion imaging: During scanning volunteers/patients were re-positioned in a 1H 8-element chest receiver coil. CE perfusion-weighted images were acquired using a 3D SPGR sequence with full lung coverage, voxel size 1.8x1.8x5mm and 36 time-frames of ~0.5s each following injection of 0.05ml/kg gadolinium contrast agent (Gadovist) at 2.5-4.5ml/s (scaled with weight) with 20ml saline flush.
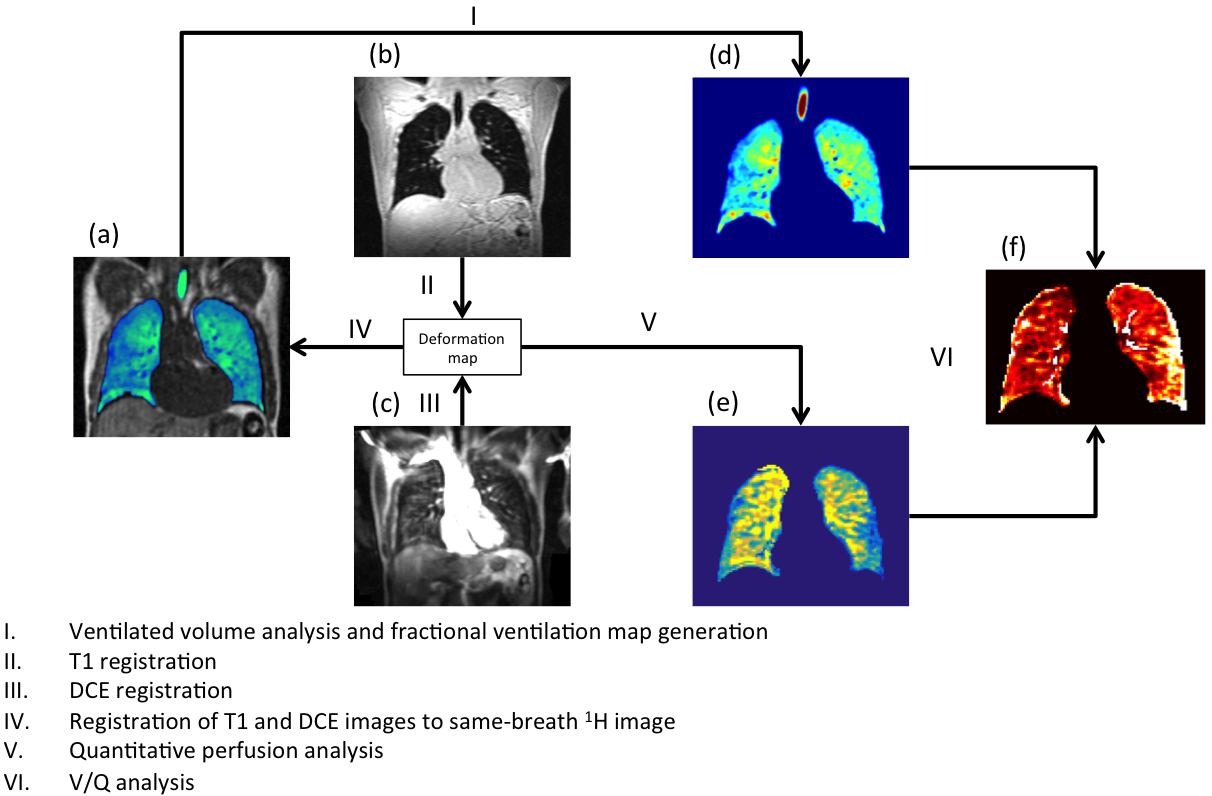
Data processing: Equilibrium relaxation (T10) and density (M0) images were calculated using the Levenberg-Marquardt fitting algorithm10. Fractional ventilation (FV) images were created from the 3He MRI as described by Tzeng et al7. CE 1H perfusion images were quantitatively analyzed using a gamma-variate fit model to calculate pulmonary blood volume10. Images were analyzed following the proposed registration and segmentation workflow in figure 1. Images were segmented as previously described using a Fuzzy-Logic algortithm11. Perfusion image masks were created by manual delineation of the lung and removal of vessels. Following this a threshold was applied to remove areas of low perfusion (within 2 standard deviations of noise from the peak signal enhancement image). Percent ventilated volume (%VV), percent perfused volume (%PV) and the Dice similarity coefficient (DSC) of the ventilation and perfusion image masks to assess areas of where either V or Q are non-zero (V/Q matched) were calculated. All images were registered to the same spatial domain as the same-breath 3He images using ANTs12.
Results and Discussion
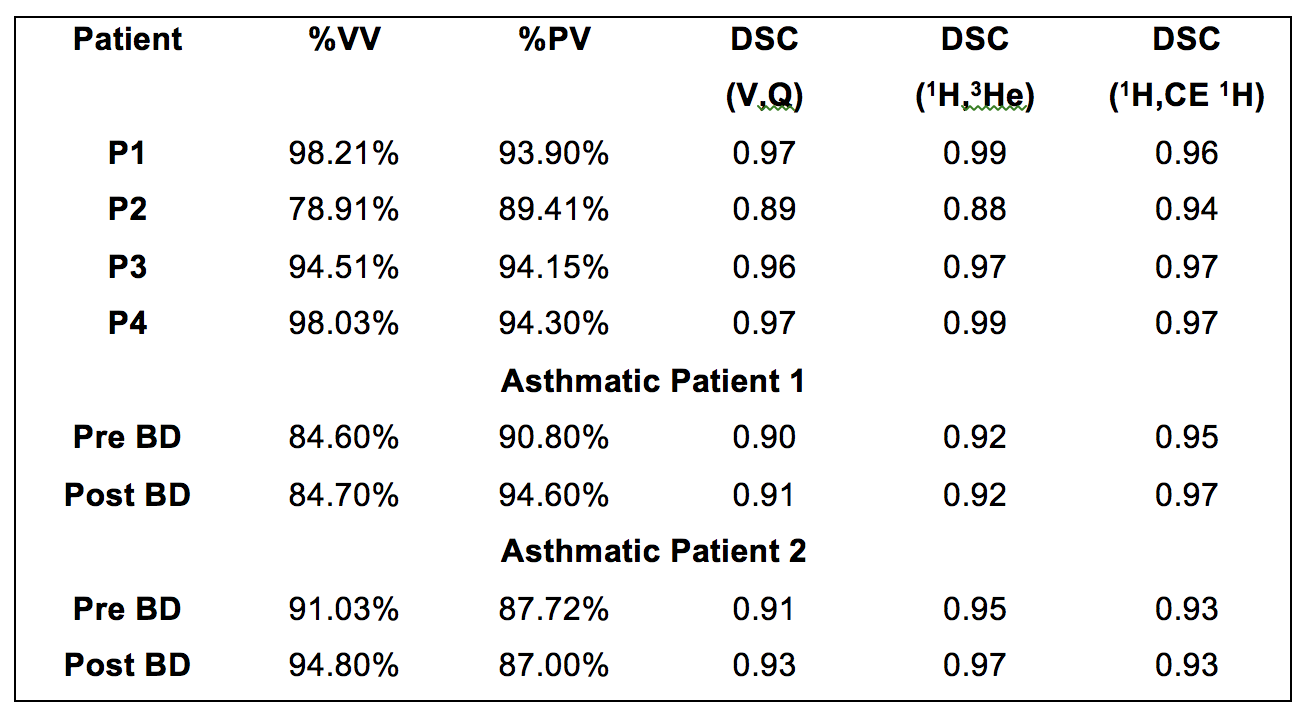
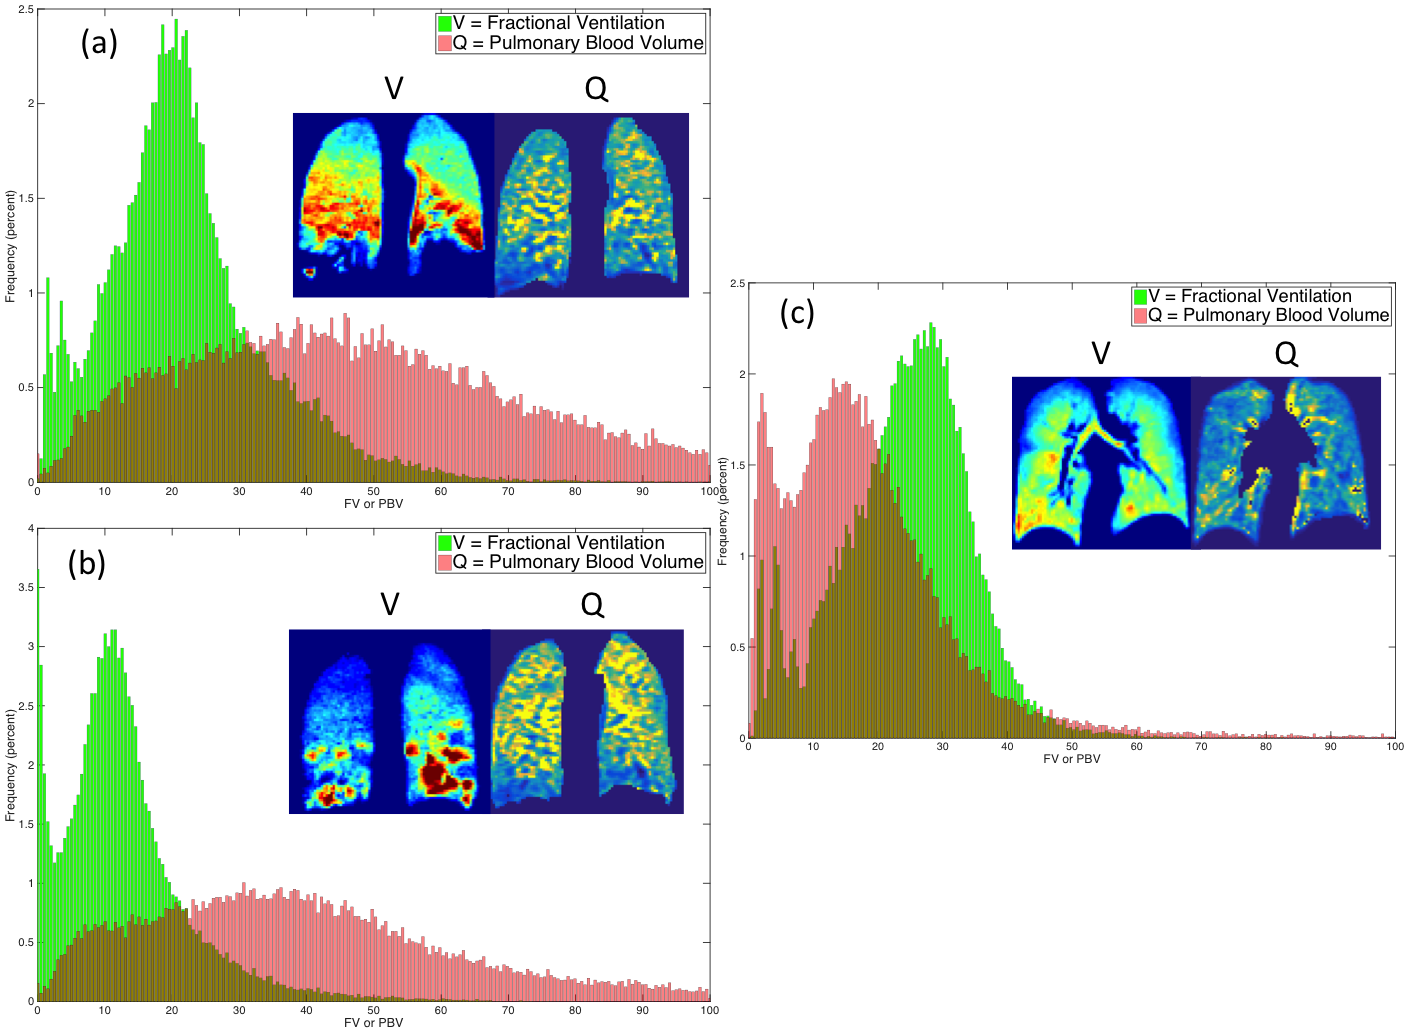
A summary with the results for all the analyzed cases is presented in Table 1. A method has been developed allowing voxel-by-voxel comparison of quantitative measures of ventilation and perfusion. Registration overcomes the issue of images being acquired with the patient in a different position and coil. This workflow also allows for the quantitative assessment of perfused and ventilated areas of the lung by calculation of the coefficient of variation (defined as the standard deviation divided by the mean signal). Additionally, histograms of PBV and FV may be compared to assess and probe the V-Q matching (Figure 2). Finally measures of shunt and wasted ventilation may be calculated using the image masks created in this work. An improvement was also seen in both asthmatic patients in the DSC of the ventilation and perfusion following bronchodilator administration.Conclusions
A method for quantification of ventilation and perfusion, and voxelwise comparison was developed and demonstrated in four healthy volunteers. This semi-automated image processing workflow produces spatially registered maps of fractional ventilation and pulmonary blood volume from which maps of the V/Q ratio may be calculated. This methodology may be used for longitudinal monitoring of patients at multiple timepoints or to assess the effect of intervention in a single session.Acknowledgements
Airprom-FP7, NIHR, MRC, Novartis and GlaxoSmithKline for fundingReferences
[1] Roach et al. J NUCL MED, 2013, 54(9):1588-96. doi:10.2967/jnumed.113.124602.; [2] Hofman et al. INT J MOL IMAGING. 2011; 2011: 682949. doi: 10.1155/2011/682949; [3] West. Respiratory physiology the essentials (8th edition), 2012; [4] Tzeng et al. J APPL PHYSIOL, 2009, 106(3), 813-822; [5] Ohno et al. AM J ROENTGENOL, 188(1), 48-56, 2007; [6] Horn et al NMR BIOMED, DOI:10.1002/nbm.3187; [7] Wild et al, RADIOLOGY, 267(1):251-5 (2013); [8] Hughes et al PROC INTL SOC MAG RESON MED 23(2015), Abstract number 1504; [9] Naish et al MAGN RESON MED, 2009, 61(6):1507-14. doi: 10.1002/mrm.21814.; [10] Li et al. J MAGN RESON IMAGING, 2000, 2(2), 347-357; [11] Hughes et al PROC INTL SOC MAG RESON MED 24(2016), Abstract number 1622; [12] Avants et al. Advanced normalization tools (ANTS), INSIGHT J, 2009;Figures