1183
Ventilation Defect Percent in Helium-3 MRI is Associated with Severe Outcomes in Asthma1Medical Physics, University of Wisconsin-Madison, Madison, WI, United States, 2Biostatistics & Medical Informatics, University of Wisconsin-Madison, Madison, WI, United States, 3School of Pharmacy, University of Wisconsin-Madison, Madison, WI, United States, 4Medicine, University of Wisconsin-Madison, Madison, WI, United States, 5Radiology, University of Wisconsin-Madison, Madison, WI, United States
Synopsis
We assessed the ventilation defect percent (VDP) on hyperpolarized helium-3 MRI as an indicator of severe clinical outcomes (emergency department [ED] visits and hospitalizations as surrogates for significant asthma exacerbations). We compared VDP with conventional biomarkers of lung function and inflammation and found VDP was more strongly associated with both ED and hospitalizations as outcomes. VDP was correlated with spirometry, air trapping measured on CT, and eosinophil levels in sputum and peripheral blood. These findings suggest that VDP is a candidate biomarker associated with clinical outcomes of asthma exacerbation and stability.
Purpose
Hyperpolarized (HP) gas MRI may be useful in identifying asthma patients susceptible to severe outcomes and requiring additional surveillance or intervention. We hypothesize that the ventilation defect percent (VDP) measured on HP helium-3 (3He) MRI may be sensitive to severe exacerbations in asthma. In this work we test the association between VDP and severe clinical outcomes (emergency department [ED] visits and hospitalizations as surrogates for significant asthma exacerbations) in a cohort of asthma subjects.Methods
102 subjects (64F, age 29.2 ± 11.9 yrs) were recruited as part of the Severe Asthma Research Program (SARP)1 and the Viral-Induced Asthma Exacerbation (VIAX) study2, and included healthy volunteers (N=11, 10.8%) and mild-to-moderate (N=75, 74.5%) and severe (N=16, 15.7%) asthmatics. HP 3He MRI, proton MRI, and spirometry were obtained in all subjects. Subsets of 88 (86.3%) and 76 (74.5%) subjects underwent plethysmography and CT, respectively. In the CT subset, MRI and CT acquisitions were performed within 48–72 hours of each other. Plethysmography was performed within 2 weeks of MRI. Severe outcomes due to trouble breathing were defined as one or more instances of emergency department (ED) visits or hospitalizations at any time prior to study enrollment. Levels of eosinophils, neutrophils, and macrophages/monocytes were determined from samples of sputum and peripheral blood.
Lung volume was determined from proton MRI using a semi-automated region growing algorithm. Lung lobes and ventilation defects were segmented manually using in-house software written in MATLAB3, and the resulting masks were used to calculate whole lung and lobar VDP. Relative area under -856 Hounsfield units (RA-856)4 was assessed by lobe on expiratory CT using VIDA Quantitative Analysis Software5.Correlations between VDP and biomarkers of lung function and inflammation were assessed using Spearman’s correlation. Associations between VDP and severe outcomes were assessed in asthmatic subjects using the Wilcoxon rank-sum test and receiver operating characteristic (ROC) curve analysis, as were associations between conventional biomarkers of lung function/inflammation and severe outcomes. A multifactor gradient boosting machine model7 was used to assess the relative contribution of factors in a multivariate model of severe outcomes. Statistical analyses were performed in R version 3.2.36. The threshold for statistical significance was p<0.05.
Results
Figure 1 shows typical results for the principal image biomarkers used in our study. Table 1 shows ROC AUC (area under the curve) values and Wilcoxon rank-sum test results assessing VDP and other biomarkers as indicators of severe outcomes among asthmatics, with corresponding ROC curves shown in Figure 2. VDP was associated with ED visits (AUC=0.69, p<0.01) and hospitalizations (AUC=0.78, p<0.001). Forced expiratory volume in one second (FEV1) divided by forced vital capacity (FVC) percent predicted (PP) was associated with ED visits (AUC=0.64, p=0.039). Peripheral blood eosinophil counts were associated with hospitalizations (AUC=0.66, p=0.035). In a machine learning model, VDP had over twice the relative influence in classifying severe outcomes than the next most influential factor (Figure 3).
In the full study population, VDP was positively correlated with peripheral blood eosinophil counts (Spearman’s r=0.39, p<0.0001) and sputum eosinophil differential (r=0.36, p<0.001). VDP was correlated with both FEV1 PP and FEV1/FVC PP in the full study population (Spearman’s r=-0.32, p<0.01; r=-0.54, p<0.001, respectively). Table 2 summarizes lobar comparisons between VDP and RA-856 using Spearman’s correlation. In the full study population, VDP was positively correlated with RA-856 in the whole lung (r=0.23, p=0.046) and in the right middle, right lower, and left lower lobes. In the mild-to-moderate subpopulation, VDP was positively correlated with RA-856 in the whole lung (r=0.35, p<0.01) and in all five lobes.
Discussion
VDP appears to be a superior indicator of severe outcomes than the other biomarkers of lung function and inflammation investigated in a moderately sized population of asthmatics including both mild to moderate and severe subjects. These results suggest that characterizing regional lung function via hyperpolarized gas imaging may be a useful tool for identifying subjects with unstable asthma. VDP was also correlated with RA-856 and with spirometry, corroborating earlier findings8,9,10. Importantly, while measures of blood and sputum eosinophils were imperfectly correlated with VDP, suggesting some degree of orthogonality between the measurements, they were nearly as predictive of severe outcomes. Thus a combined approach may be more selective of patients with severe outcomes.Conclusion
VDP was more strongly associated with severe clinical outcomes than conventional PFT’s, biomarkers of inflammation, or quantitative CT. VDP was most strongly correlated with measurements of eosinophils in blood and sputum, and was also correlated with FEV1/FVC PP, FEV1 PP, and RA-856. These findings suggest that VDP shows promise as a possible biomarker associated with severe outcomes in asthma.Acknowledgements
The authors would like to acknowledge the nurses and recruiters who supported this work, especially Jan Yakey, RN, and Gina Crisafi, BS; the Data Coordinating Center (DCC) of the Severe Asthma Research Program (SARP); the research technologists at UW-Madison, including Kelli Hellenbrand, RT, Jenelle Fuller, RT, and Sara John, RT who supported the MRI scanning in this work; the graduate students who operated the polarizer system during the period of these studies, especially Jim Holmes, PhD, and Rafael O'Halloran, PhD; and the patient volunteers who participated in the MRI substudy conducted at UW-Madison.
Supported by grant R01 HL080412, R01 HL069116, U10 HL109168, UL1TR000427, Wisconsin Alumni Research Foundation (WARF) Technology Training Research Assistantship.
References
1 Jarjour NN, Erzurum SC, Bleecker ER, Calhoun WJ, Castro M, Comhair SA, Chung KF, Curran-Everett D, Dweik RA, Fain SB, Fitzpatrick AM, Gaston BM, Israel E, Hastie A, Hoffman EA, Holguin F, Levy BD, Meyers DA, Moore WC, Peters SP, Sorkness RL, Teague WG, Wenzel SE, Busse WW, Program NSAR. Severe asthma: lessons learned from the National Heart, Lung, and Blood Institute Severe Asthma Research Program. Am J Respir Crit Care Med 2012: 185(4): 356-362.
2 Denlinger LC, Sorkness RL, Lee WM, Evans MD, Wolff MJ, Mathur SK, Crisafi GM, Gaworski KL, Pappas TE, Vrtis RF, Kelly EA, Gern JE, Jarjour NN. Lower airway rhinovirus burden and the seasonal risk of asthma exacerbation. Am J Respir Crit Care Med 2011: 184(9): 1007-1014.
3 The MathWorks, Natick, MA
4 Busacker A, Newell JD, Keefe T, Hoffman EA, Granroth JC, Castro M, Fain S, Wenzel S. A Multivariate Analysis of Risk Factors for the Air-Trapping Asthmatic Phenotype as Measured by Quantitative CT Analysis. Chest 2009: 135(1): 48-56.
5 Version PW 2.0, VIDA Diagnostics, Coralville, IA
6 R Core Team. R: A Language and Environment for Statistical Computing. 2015
7 Friedman JH. Greedy function approximation: a gradient boosting machine. Annals of statistics 2001: 1189-1232.
8 Fain SB, Gonzalez-Fernandez G, Peterson ET, Evans MD, Sorkness RL, Jarjour NN, Busse WW, Kuhlman JE. Evaluation of structure-function relationships in asthma using multidetector CT and hyperpolarized He-3 MRI. Acad Radiol 2008: 15(6): 753-762.
9 de Lange EE, Altes TA, Patrie JT, Gaare JD, Knake JJ, Mugler JP, Platts-Mills TA. Evaluation of asthma with hyperpolarized helium-3 MRI - Correlation with clinical severity and spirometry. Chest 2006: 130(4): 1055-1062.10 Altes TA, Mugler JP, 3rd, Ruppert K, Tustison NJ, Gersbach J, Szentpetery S, Meyer CH, de Lange EE, Teague WG. Clinical correlates of lung ventilation defects in asthmatic children. J Allergy Clin Immunol 2016: 137(3): 789-796 e787.
Figures
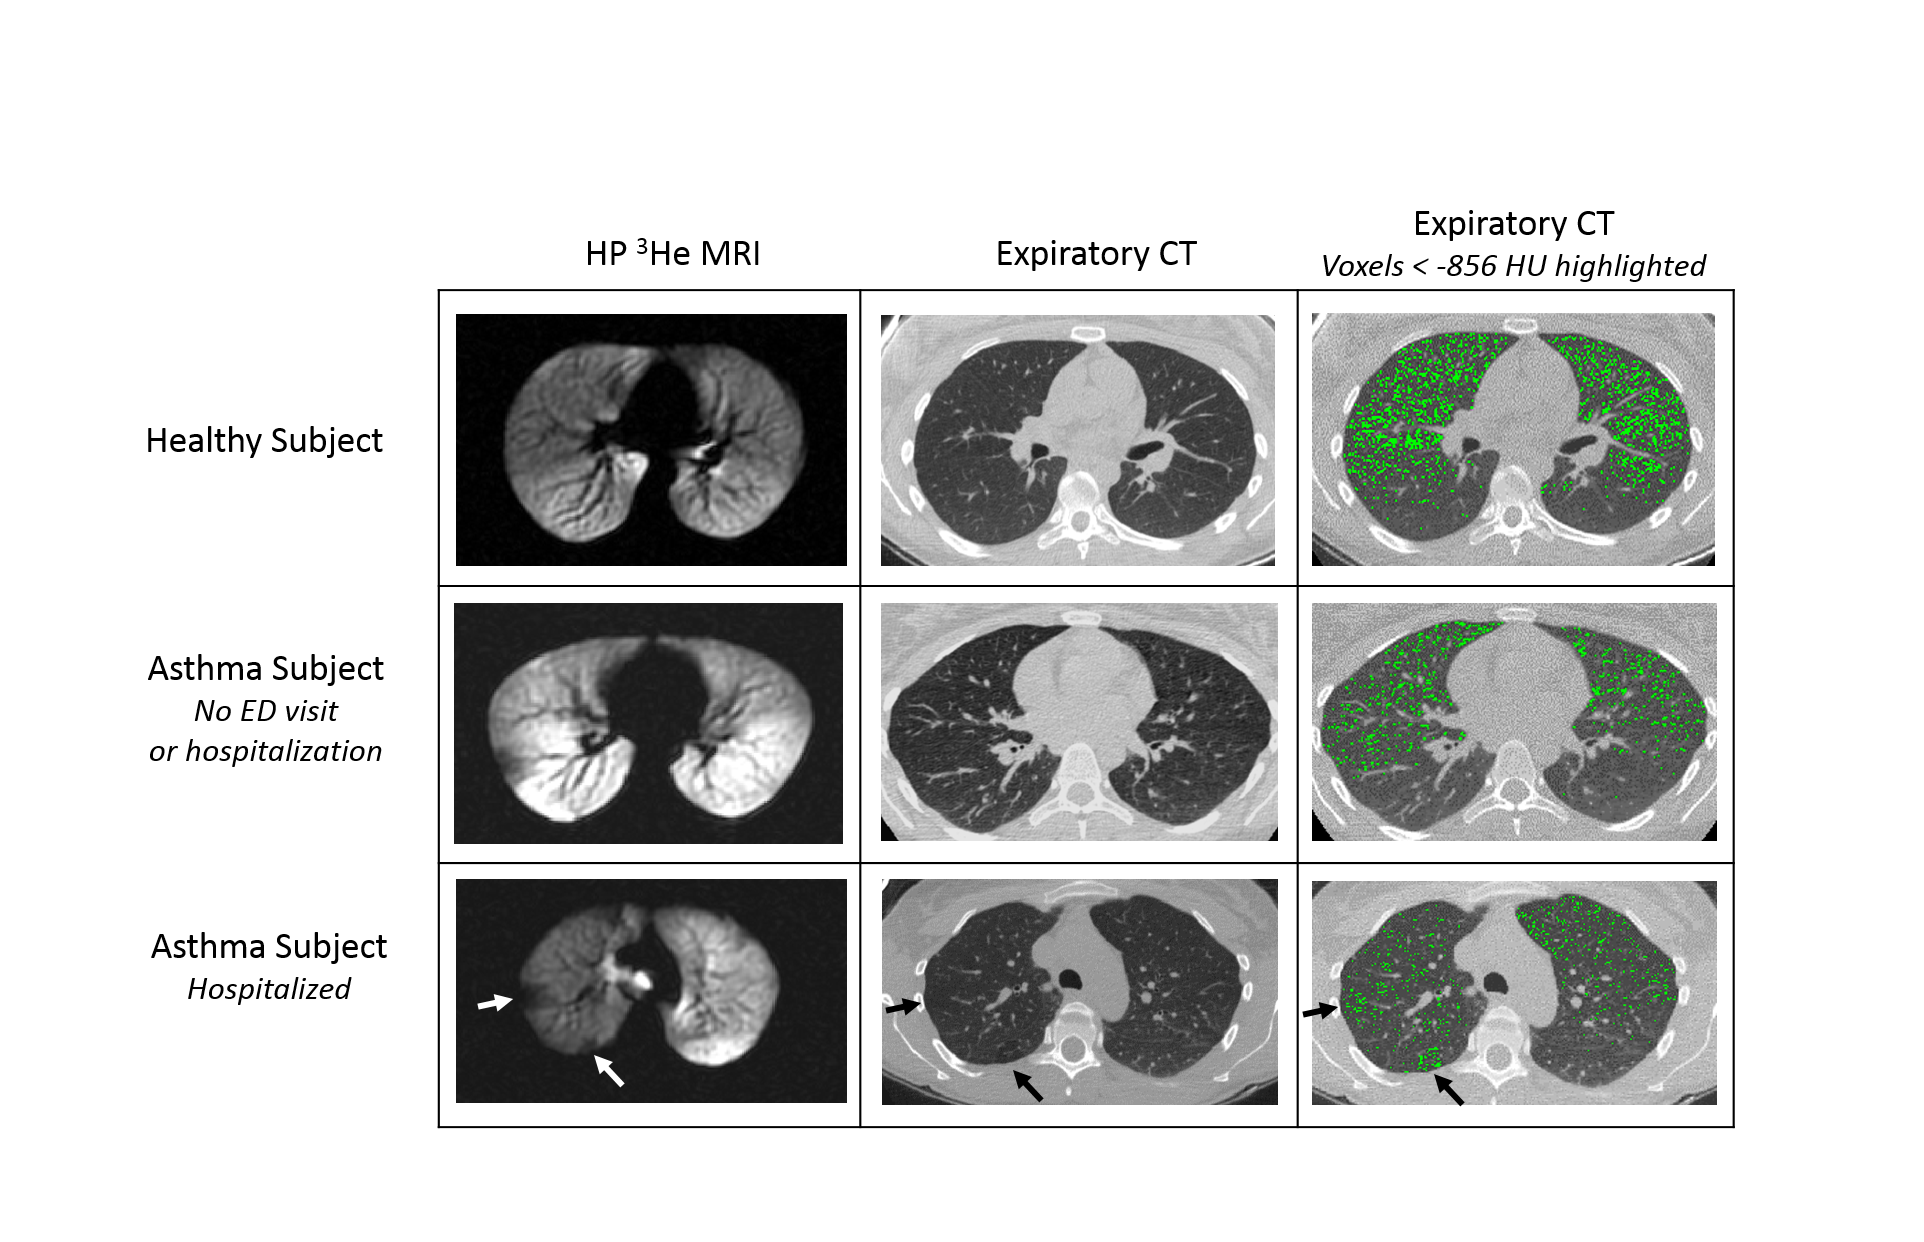
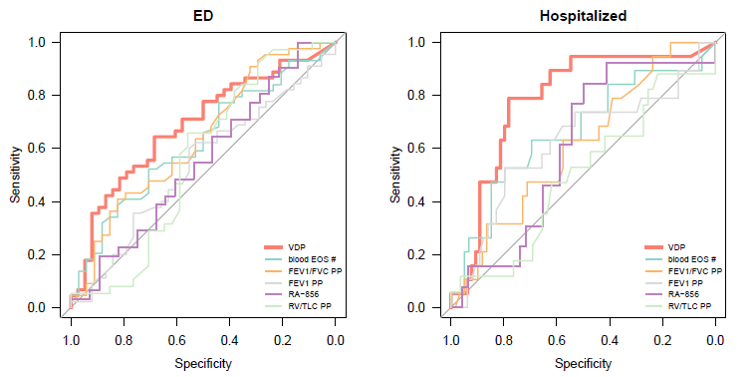
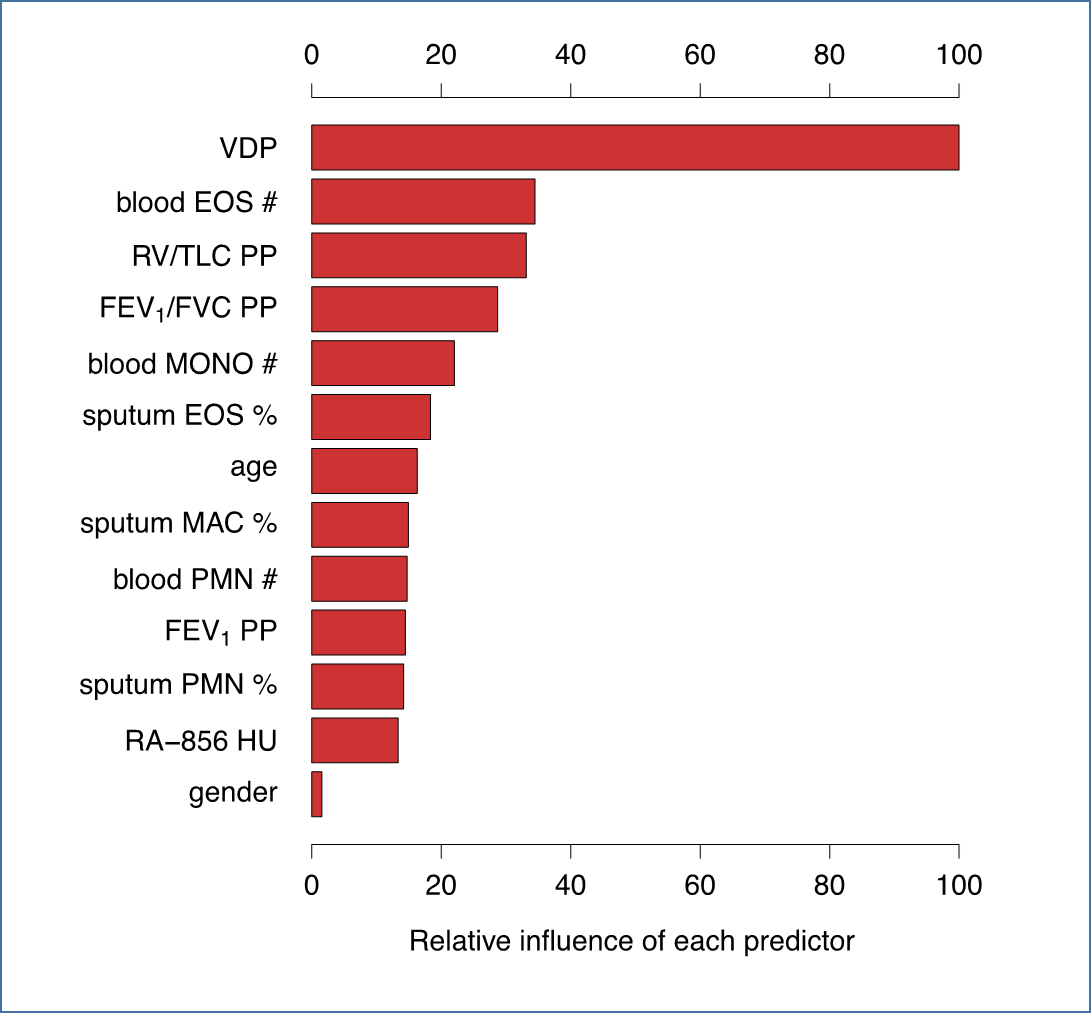

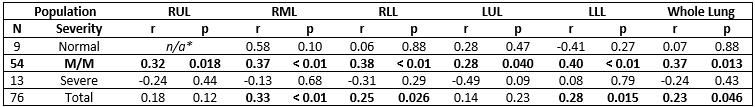
Table 2. Correlation between ventilation defect percent and relative area under -856 Hounsfield units, stratified by lung lobe. RUL – right upper lobe, RML – right middle lobe, RLL – right lower lobe, LUL – left upper lobe, LLL – left lower lobe, M/M – mild to moderate, r - Spearman rank correlation coefficient, p – Spearman p-value.
*too many equal values to allow for statistical test