1182
Dynamic Spectroscopy of Dissolved-Phase Xenon-129 in the Human Kidney1Radiology & Medical Imaging, University of Virginia, Charlottesville, VA, United States, 2Physics, University of Virginia, 3Radiology, University of Missouri, 4Xemed LLC
Synopsis
The increase in available dissolved-phase signal made possible by high-performing Xe-129 polarizers has led to renewed interest in dissolved-phase imaging of Xe-129 outside the lung. Here we examine the time course of the dissolved phase Xe-129 signal in the human kidney following gas inhalation, in order to optimize kidney image acquisition and explore the potential for studying kidney function using hyperpolarized Xe-129. In addition to spectral peaks commonly associated with Xe-129 dissolved in tissue/plasma, red blood cells, and fat, we have identified an additional peak at 201 ppm that lags the blood peaks by a few seconds.
Introduction
Although NMR of dissolved-phase Xe-129 has primarily been used to study gas exchange in the lung, the increase in available dissolved-phase signal made possible by high-performing Xe-129 polarizers has led to renewed interest in dissolved-phase imaging of other organs1. A previous study demonstrated imaging of dissolved-phase Xe-129 in human kidneys2. The purpose of the present work is to examine the time course of the dissolved phase Xe-129 signal in the human kidney following gas inhalation, in order to optimize kidney image acquisition and explore the potential for studying kidney function using hyperpolarized Xe-129.Methods
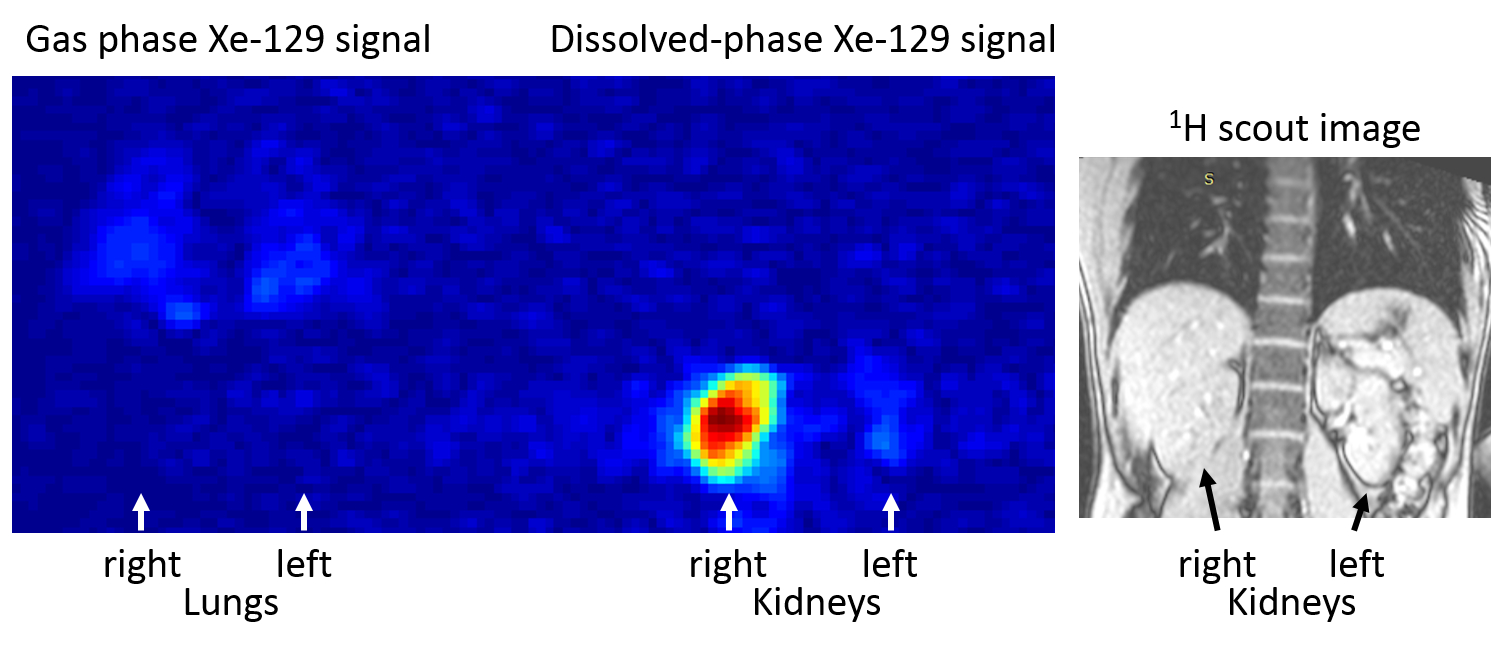
Four healthy volunteers were studied (2 male and 2 female, ages 23-39). Isotopically enriched Xe-129 was polarized to ~30% using a commercial prototype system (XeBox-10, Xemed LLC). MR measurements were performed using a 1.5 T whole-body scanner (Siemens Avanto) and a homebuilt 5-inch diameter single-loop RF coil tuned to the Xe-129 resonance. The RF coil was placed directly under the right kidney. Proper placement of the coil was confirmed by proton imaging of fish-oil capsules placed around the outside of the coil loop. Dynamic spectroscopy was performed using a simple pulse sequence, consisting of a hard 500 μs excitation RF pulse (either 5° or 10°, centered at the dissolved phase frequency) immediately followed by a 20 ms ADC readout, repeated every 100 ms. For each spectroscopy scan, the subject inhaled a 500 ml dose of hyperpolarized xenon-129 followed by a “chaser” breath of 1L nitrogen. The pulse sequence was started a few seconds before the subject began inhaling the xenon-129 and ran continuously for 80 seconds, spanning the inhalation, 15 second breath hold, and subsequent exhalation. Data were analyzed in MATLAB, and the dissolved phase spectra were fit to a sum of complex Lorentzians with arbitrary phase shifts. To help understand the signal pool visible to the RF coil for these spectroscopic measurements, a 2D gradient-echo coronal projection image was acquired in two of the subjects using nonselective excitation RF pulses, following inhalation of a 1L Xe-129 dose. The readout bandwidth was intentionally set so that the gas-phase signal would be chemically shifted along the readout direction by a distance approximately equal to the FOV3.
Results
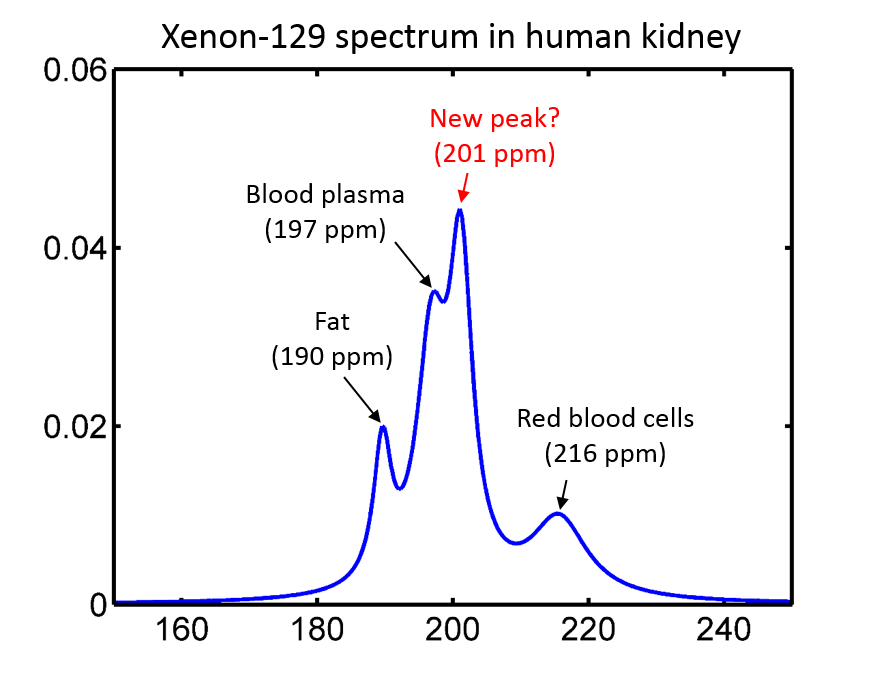
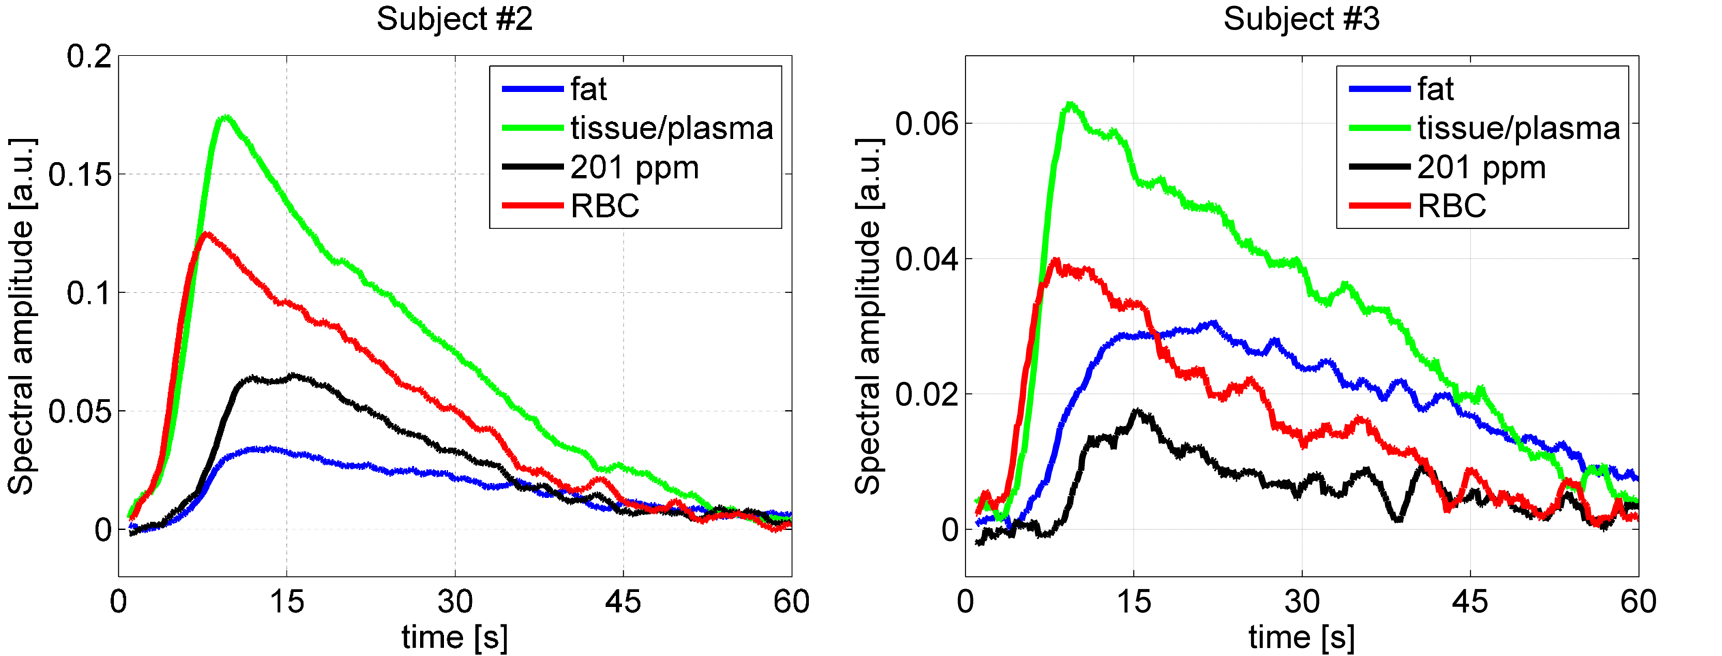
Figure 1 shows a representative dissolved-phase spectrum from one of the subjects, averaged over 50 excitations near the peak temporal intensity. In addition to previously recognized spectral peaks corresponding to xenon dissolved in fat (190 ppm), tissue/plasma (197 ppm) and red blood cells (216 ppm), there is a distinct peak at 201 ppm that is comparable in size to the neighboring tissue/plasma peak. The observed linewidths of these spectral peaks in the kidney were: 1.6 ppm (fat), 2.0 ppm (tissue/plasma), 4.9 ppm (red blood cells), and 1.9 ppm (201 ppm peak). Figure 2 shows a coronal projection-scan of dissolved-phase Xe-129 in the abdomen. The RF coil sees very little signal outside the right kidney. Figure 3 shows the time evolution of the amplitudes of the various spectral peaks during two different kidney scans. In both cases, the appearance of the fat and 201 ppm peaks lagged the appearance of the blood peaks by a few seconds. The pattern of time evolution was similar in all subjects, although the relative peak heights varied substantially from scan to scan, and the 201 ppm peak was more prominent at lower flip angles.Conclusions
Spectroscopy of dissolved-phase Xe-129 is a promising strategy for exploring the dynamics of kidney function. We observed a spectral peak at 201 ppm in the kidney that to our knowledge has not previously been reported in this context. Following Xe-129 inhalation, this peak appears a few seconds later than the peaks at 197 and 216 ppm normally associated with blood plasma and red blood cells. Because it occurs near 200 ppm, which is the location of a known peak for Xe-129 dissolved in saline, and it appears a few seconds later than the blood peaks, it is tempting to speculate that this peak corresponds to a biological process in the kidney. However, more investigation is necessary to justify such a hypothesis.Acknowledgements
Supported in part by NIH grant R01 HL105586.References
1. Rao M, Stewart NJ, Norquay G, et al.. High resolution spectroscopy and chemical shift imaging of hyperpolarized 129Xe dissolved in the human brain in vivo at 1.5 tesla. Magn Reson Med. 2016;75(6):2227-2234.
2. Mugler III JP, Miller GW, Meyer CH, et al. Imaging of dissolved-phase hyperpolarized xenon-129 in human kidneys. ISMRM 2015; 23:848.
3. Mugler JP III, Altes TA, Ruset IC, et al. Simultaneous magnetic resonance imaging of ventilation distribution and gas uptake in the human lung using hyperpolarized xenon-129. Proc Natl Acad Sci. 2010; 107:21707-21712.
Figures