1180
In-vivo Imaging of Ablation Lesions during MRI-guided Epicardial Ventricular Ablation in Swine1Division of Imaging Sciences and Biomedical Engineering, King's College London, London, United Kingdom, 2MR Research Collaborations, Siemens Healthcare Limited, Frimley, United Kingdom, 3Imricor Medical Systems, Burnsville, MN, United States, 4Siemens Healthcare GmbH, Erlangen, Germany
Synopsis
Cardiac MR (CMR) shows promise for the guidance of ventricular tachycardia (VT) ablation procedures and imaging of ablation lesions. CMR-thermometry is a promising approach for real-time tissue temperature monitoring and tissue characterization for prediction of permanent ablation lesions. In this study, we sought to develop an integrated multi-parametric framework for real-time, hyper-acute and acute imaging of ablation lesions using CMR-thermometry, native T1 mapping and late gadolinium enhancement (LGE), respectively. This framework is evaluated during MR-guided epicardial ventricular ablation in swine.
Background
Catheter ablation of ventricular tachycardia (VT) is the only available curative treatment of VT but is associated with a low success rate (50%) mainly due to incorrect location/extent of permanent ablation lesions1. Cardiac MR (CMR) shows promise for the guidance of ventricular tachycardia (VT) ablation procedures and imaging of ablation lesions2. CMR-thermometry using the proton resonance frequency shift (PRFs) technique is a promising approach for real-time volumetric tissue temperature monitoring and prediction of the extent of the permanent ablation lesions3. Native myocardial T1 mapping4 and late gadolinium enhancement (LGE)5 also show promise for ablation lesion imaging. However, LGE requires contrast administration and cannot be performed multiple times during the procedure. In this study, we sought to develop and evaluate an integrated multi-parametric framework for real-time, hyper-acute and acute imaging of ablation lesions using CMR-thermometry, native T1 mapping, and LGE, respectively. This framework is evaluated during MR-guided epicardial ventricular ablation in swine.Methods
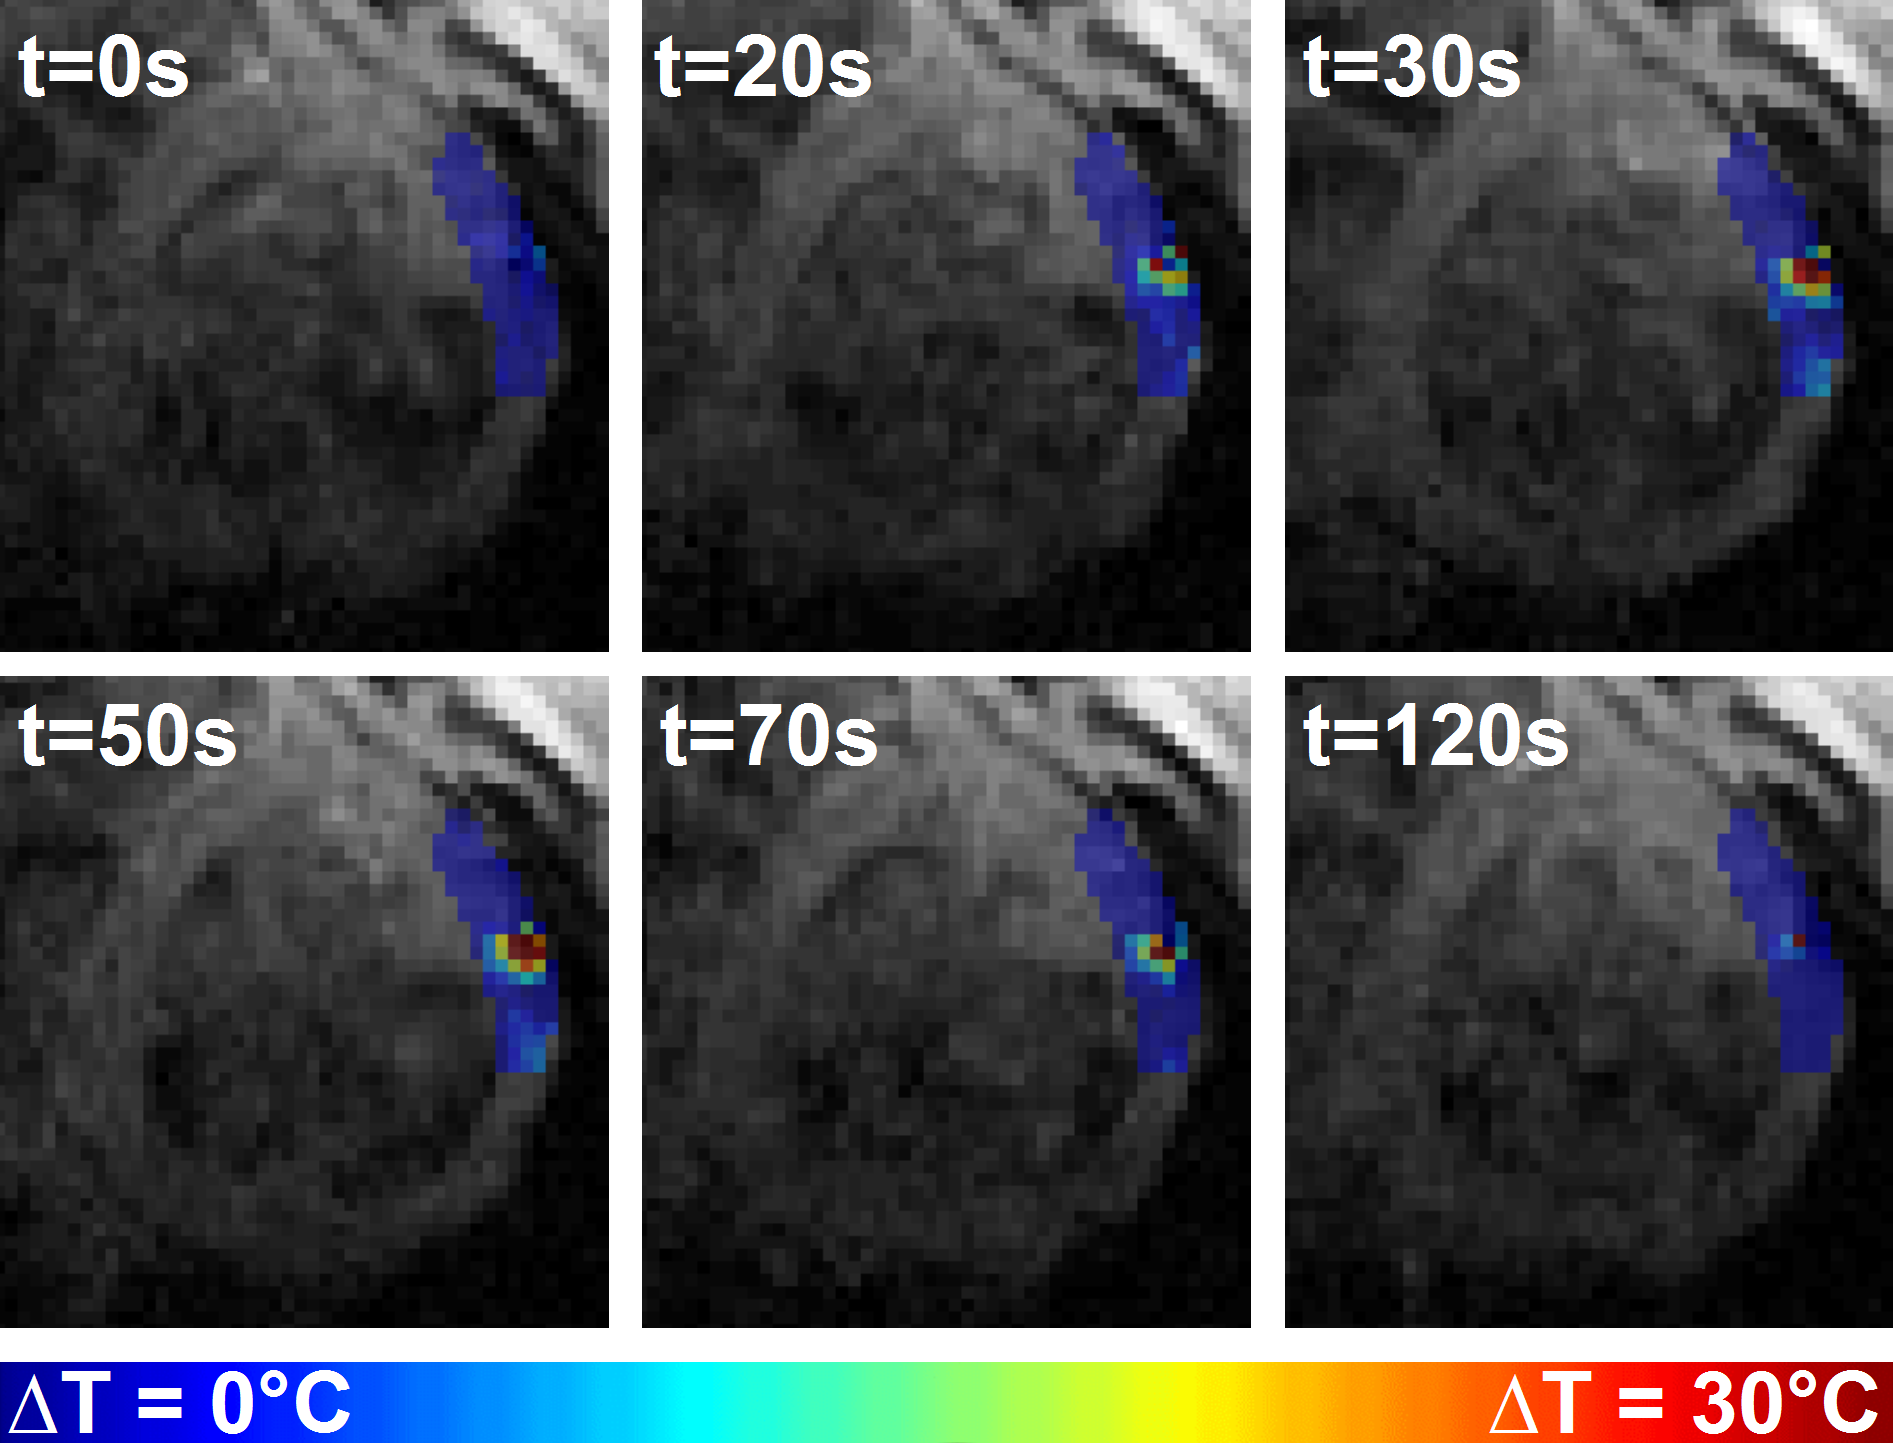
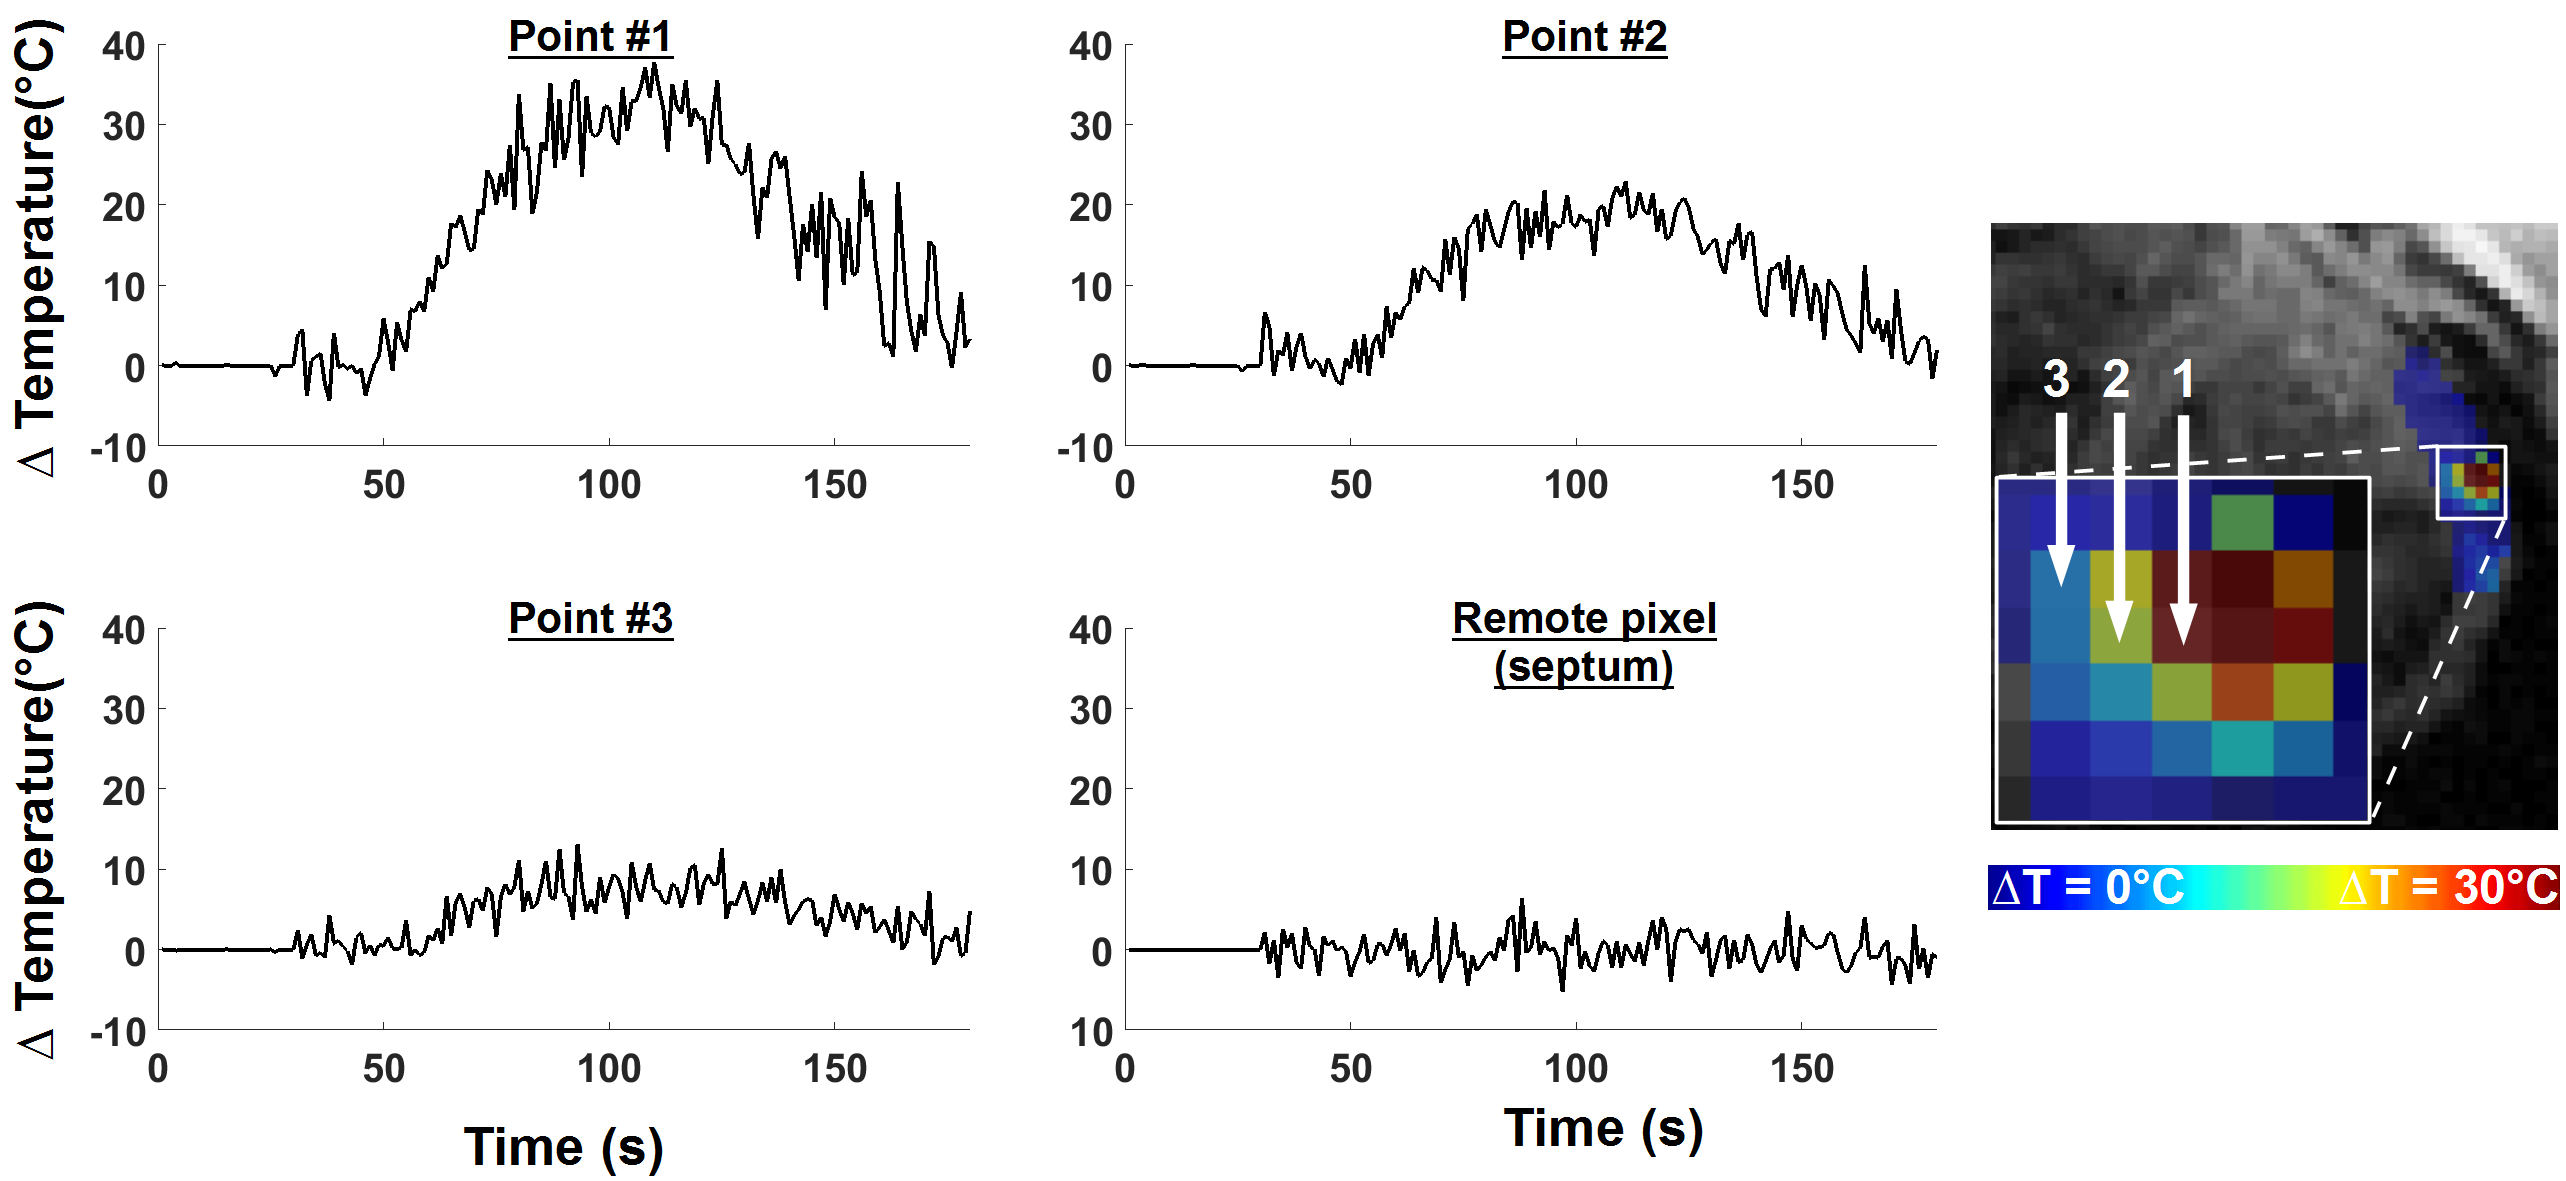
CMR-thermometry: CMR-thermometry was performed using an ECG-triggered multi-slice single-shot echo planar imaging (EPI) sequence with spoiled gradient echo (TR/TE/α=50ms/17ms/60°, FOV=180×180mm2, voxel size=1.6×1.6mm2, slice thickness=5mm, number of slices=4, bandwidth=1565Hz/Px, GRAPPA factor=2, partial Fourier=0.75). Saturation slabs were used for reduced field of view imaging and inflow saturation to reduce blood signal. Reconstruction of temperature maps was performed offline using a customized multi-baseline approach. A look up table of 30 co-registered CMR-phase images is initially created as follows. The CMR-thermometry sequence is started 30 heartbeats before each ablation. Images from the first heart beat serves as reference image. Non-rigid motion is then estimated between the reference and each subsequent magnitude image using an optical flow technique. Phase images are registered to the reference position using the estimated motion fields. During ablation, each new phase image is registered to the reference position, as described above. The phase image from the lookup table that best match the current registered phase image (i.e. minimal mean square error between pair-wise unwrapped phase images) is then selected and used for PRFs based temperature estimation. Temporal phase drift is finally corrected by removing a global temperature variation offset measured from a remote area.
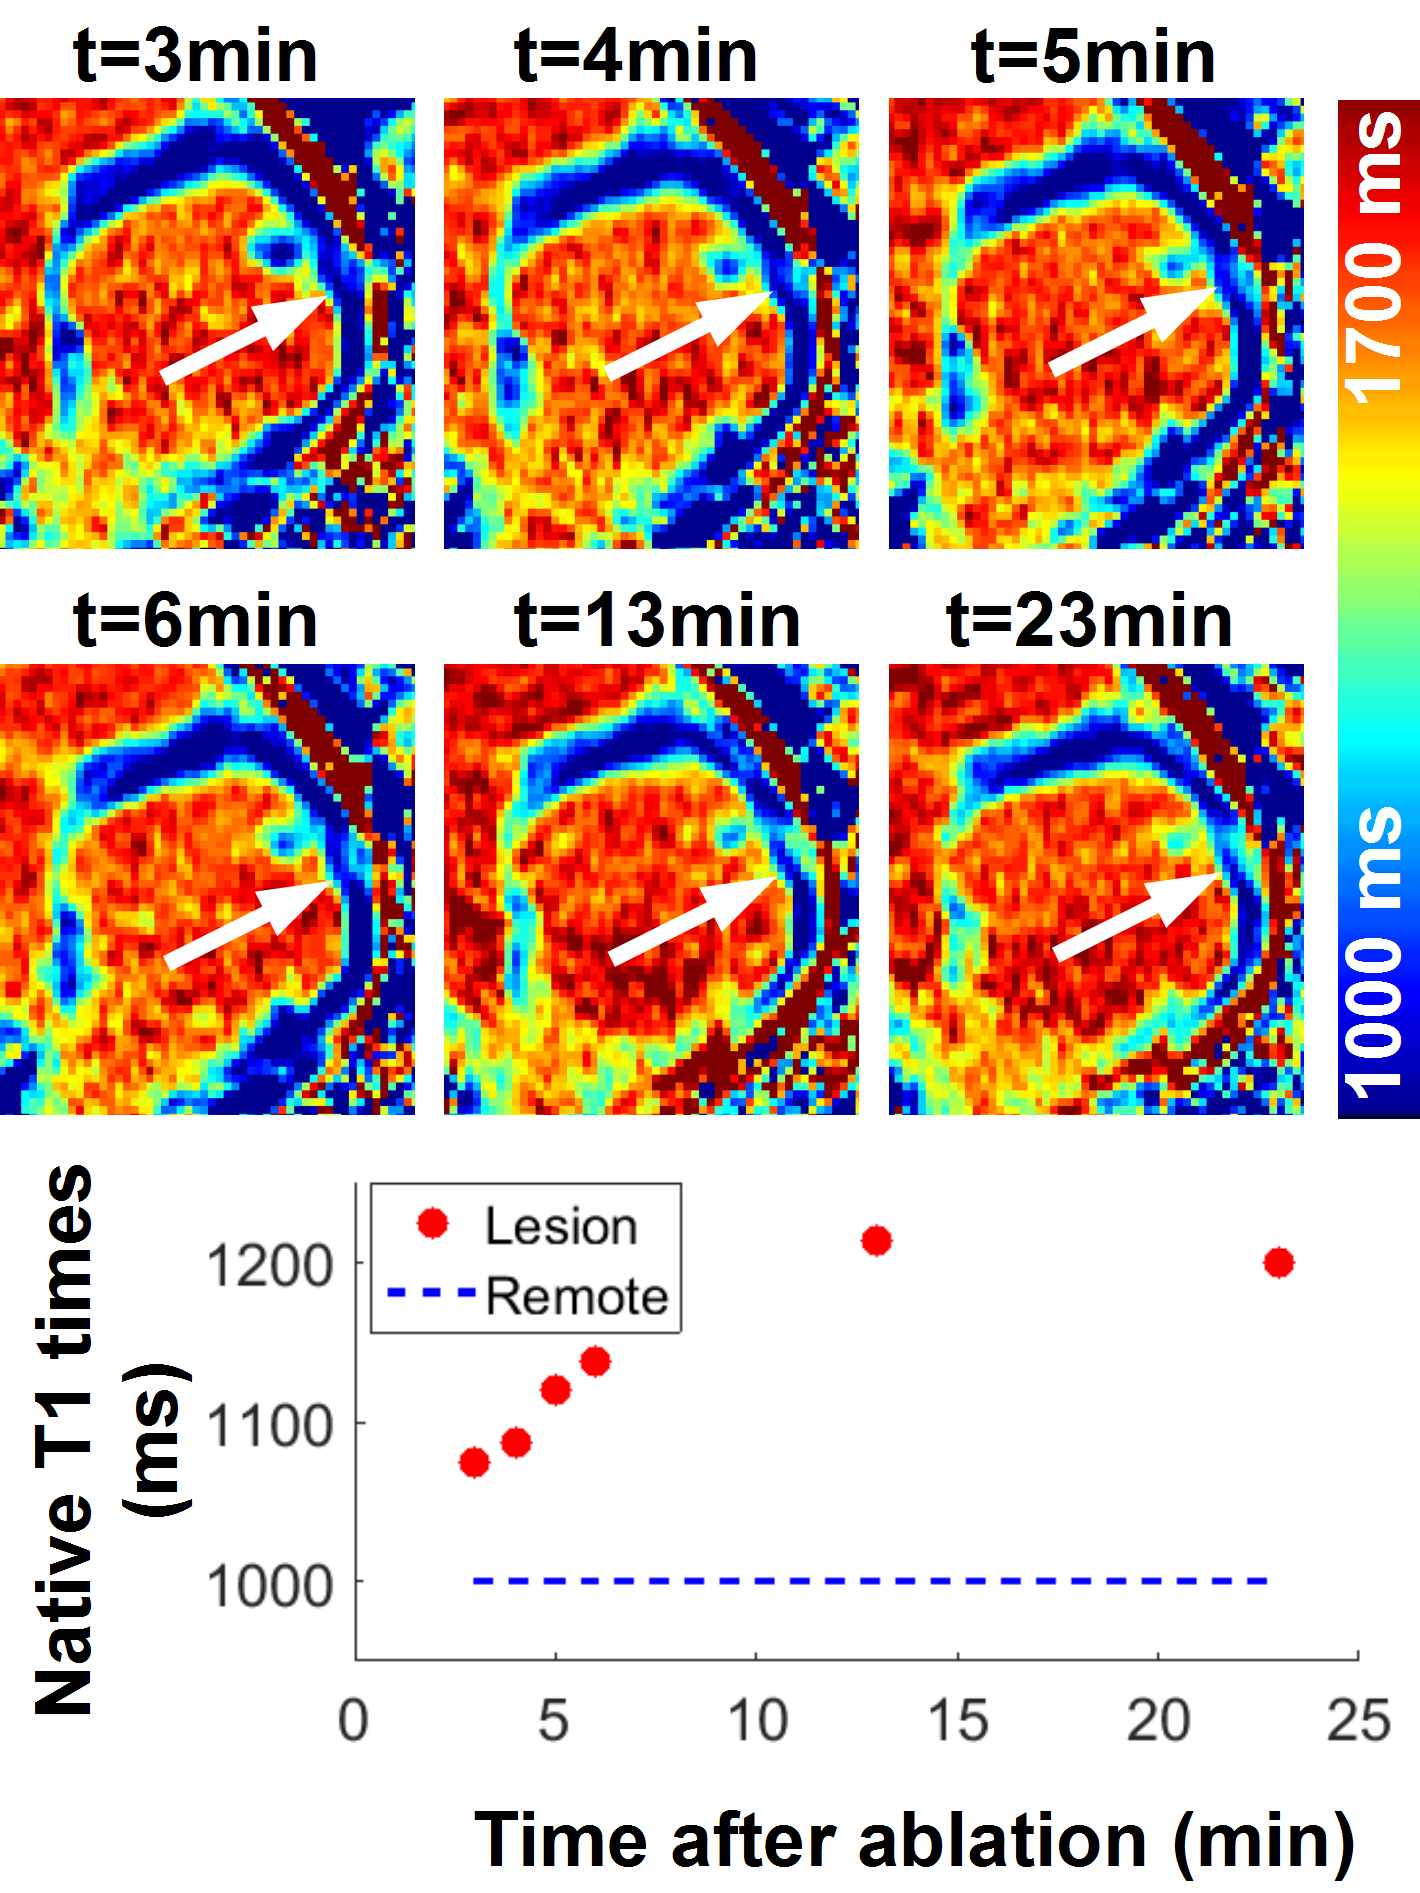
Native T1 mapping: The modified Look-Locker (MOLLI) sequence was used for native myocardial T1 mapping using a 5-(3)-3 scheme and a bSSFP readout (TR/TE/α=2.5ms/1.2ms/35°, FOV=360×307mm2, voxel size=1.4×2.1mm2, slice thickness=8mm, bandwidth=1085Hz/Px, GRAPPA factor=2, partial Fourier=0.87).
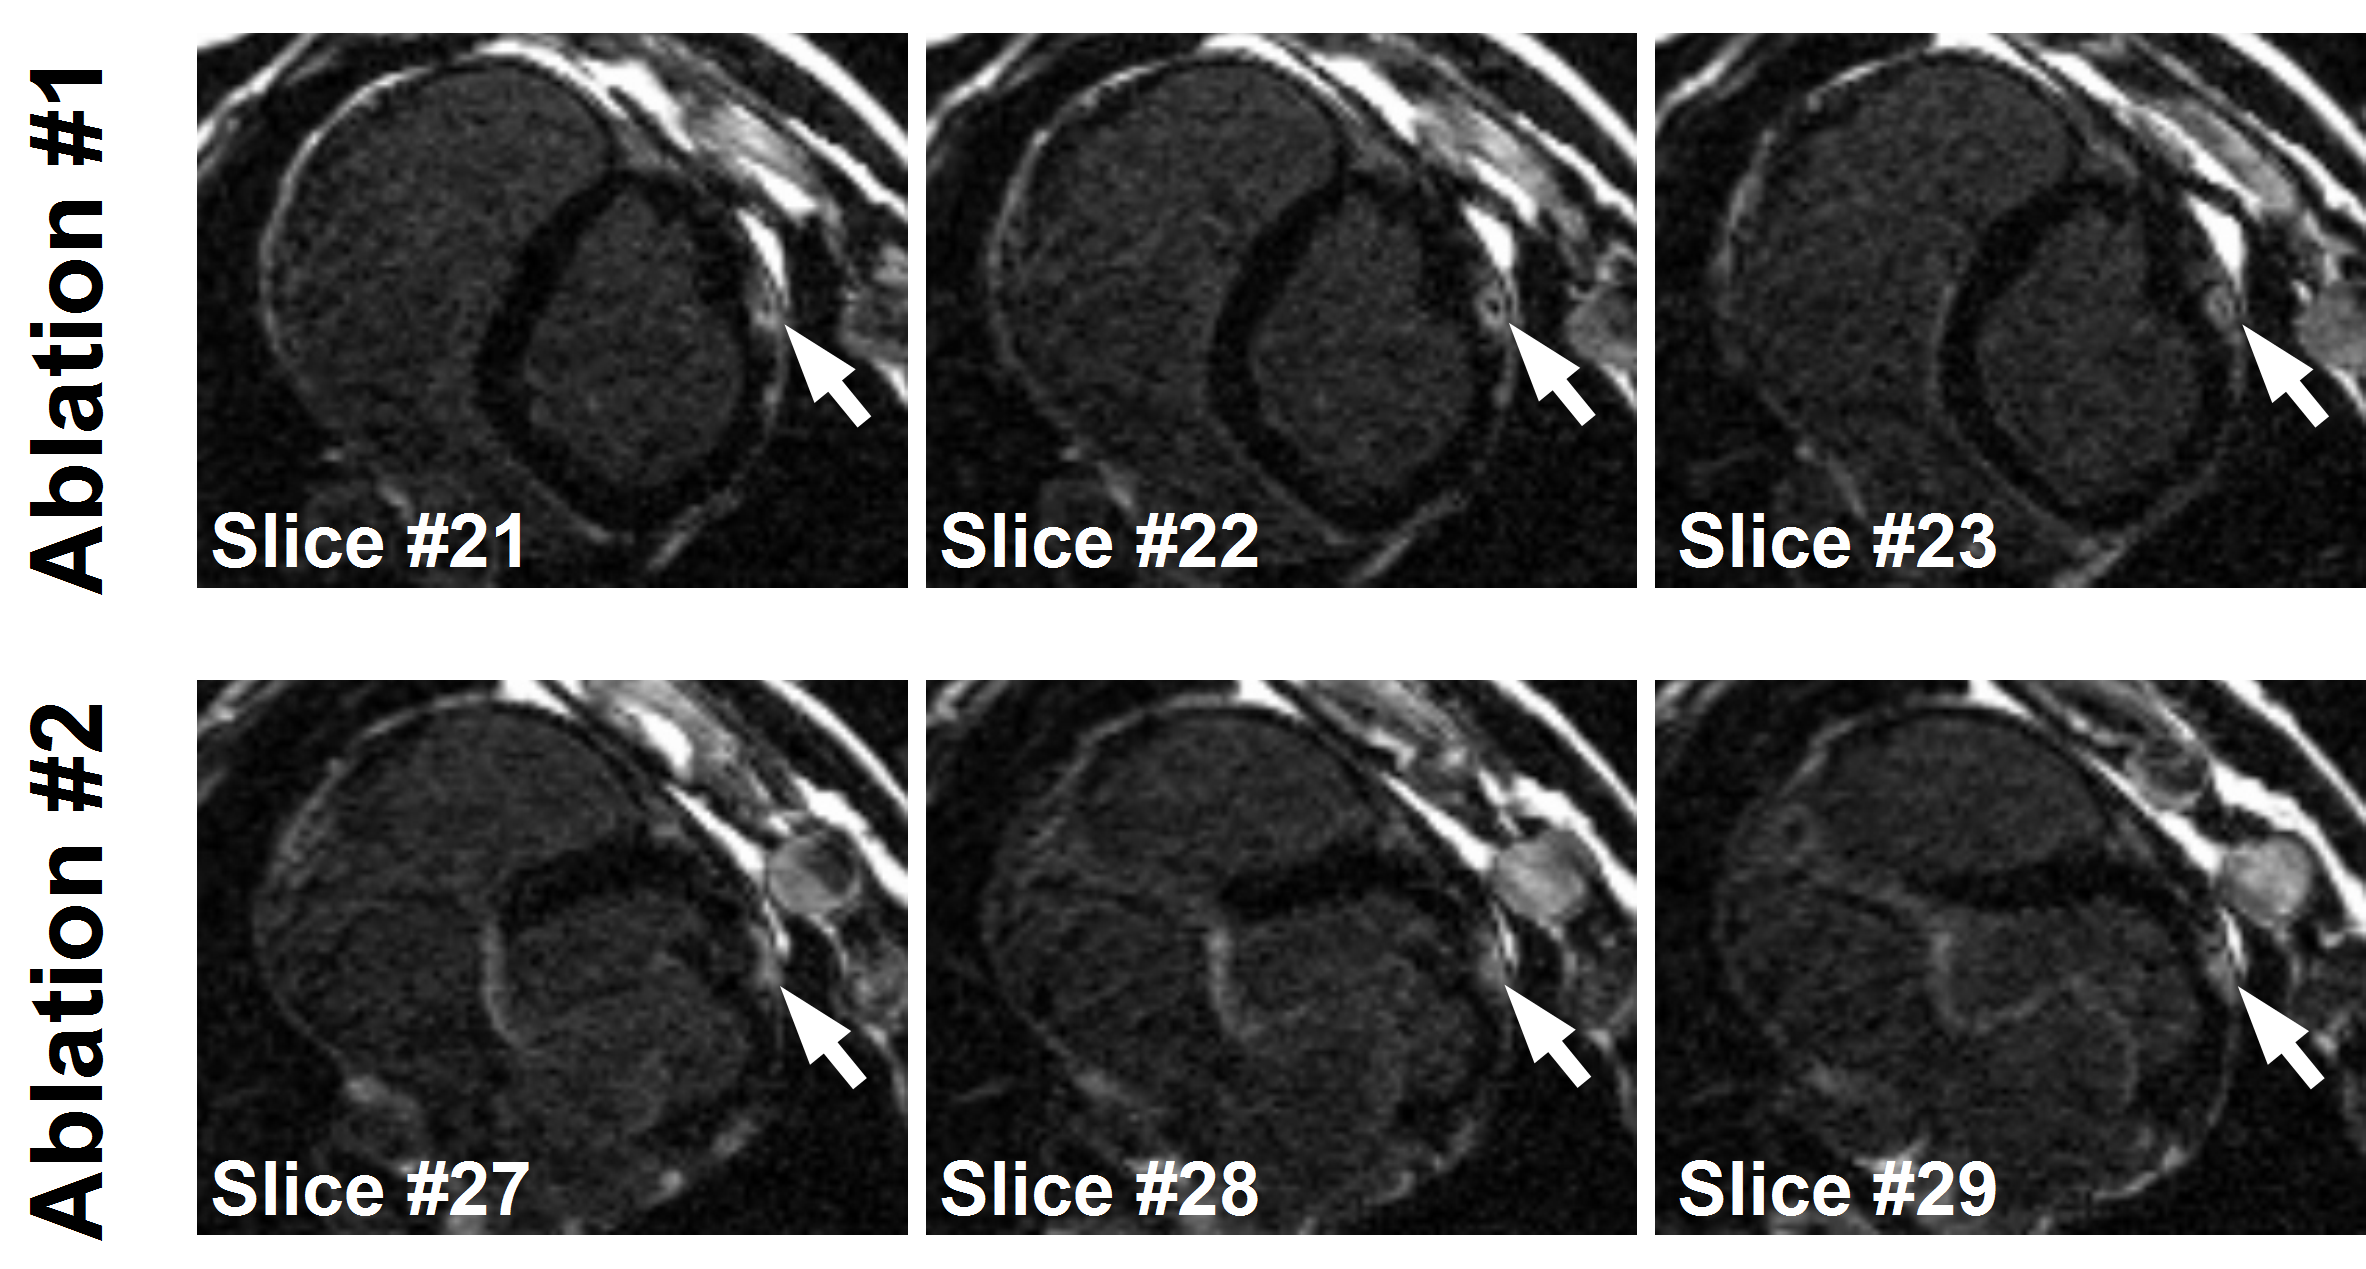
LGE Imaging: High resolution LGE was performed using a free-breathing navigator-gated inversion recovery gradient echo (GRE) sequence (TR/TE/α=5.45ms/1.8ms/10°, FOV=339×264×100mm3, voxel size=1.3×1.3×4mm3, bandwidth=360Hz/Px, GRAPPA factor=2, 2RR acquisition). Experimental validation: The proposed framework was evaluated during CMR-guided ventricular ablation in one swine. All imaging was performed using a 1.5T Magnetom Aera scanner (Siemens Healthcare, Erlangen, Germany). Navigation of the ablation catheter was performed using active catheter tracking. Two ablations (50-60W for 50s) were performed epicardially using a 9 French MR-compatible catheter with active tracking coils (Vision-MR Ablation Catheter, Imricor, Burnsville, MN). The CMR-thermometry sequence was run during the first ablation. Several post-ablation T1 mapping scans were acquired after the second ablation. Active catheter tracking was used for initial positioning of the imaging plane location of the CMR-thermometry and native T1 mapping sequences. LGE was performed 20 minutes after contrast injection (0.2ml/kg of Magnivest).
Results
Figure 1 and 2 show the results obtained with CMR thermometry sequence during the first epicardial ablation. Localised temperature elevation could be visualized epicardially on the temperature maps. A maximum temperature variation of 35°C was observed near the catheter tip. Figure 3 shows the result obtained with native myocardial T1 mapping acquired from 3 to 23 minutes after the second ablation. Elevated native T1 times were observed in the ablated area. Figure 4 shows the LGE images acquired at the end of the procedure. Both ablation lesions could be visualised and matched well the CMR-thermometry and native T1 mapping findings.Discussion
Ablation lesion areas identified using CMR-thermometry and native T1 mapping matched visually well with LGE findings. Future work will include quantitative analysis and comparison of ablation lesion volumes identified with each method, as well correlation of MRI with histology.Conclusions
CMR-thermometry, native myocardial T1 mapping and LGE imaging were successfully used for real-time, hyper-acute, and acute imaging of ablation lesion. These three complementary techniques may serve as foundation for a robust ablation lesion imaging framework for MRI-guided VT ablation.Acknowledgements
This work was supported by the Health Innovation Challenge Fund [Grant number HICF-R10-698], a parallel funding partnership between the Department of Health and the Wellcome Trust. This research was also supported by the National Institute for Health Research (NIHR) Biomedical Research Centre award to Guy's and St Thomas' NHS Foundation Trust in partnership with King's College London, and by the NIHR Healthcare Technology Co-operative for Cardiovascular Disease at Guy’s and St Thomas’ NHS Foundation Trust. The views expressed are those of the author(s) and not necessarily those of the NHS, the NIHR or the Department of Health.References
[1] Aliot EM, et al., EHRA/HRS Expert Consensus on Catheter Ablation of Ventricular Arrhythmias. Europace 2009;11(6):771-817
[2] Halperin HR and Kolandaivelu A, MRI-Guided Electrophysiology Intervention. Rambam Maimonides Med J. 2010 Oct; 1(2): e0015
[3] Kolandaivelu A, et al., Noninvasive assessment of tissue heating during cardiac radiofrequency ablation using MRI thermography. Circ Arrhythm Electrophysiol. 2010;3(5):521-9.
[4] Messroghli DR, et al., Modified Look-Locker inversion recovery (MOLLI) for high-resolution T1 mapping of the heart. Magn Reson Med 2004;52(1):141–146
[5] Kim RJ, et al., The Use of Contrast-Enhanced Magnetic Resonance Imaging to Identify Reversible Myocardial Dysfunction. N Engl J Med 2000; 343:1445-1453
Figures