1179
MRI-based myocardial ablation lesion extent relates to area of voltage reduction in MR-guided electroanatomical voltage maps1Medical Biophysics, University of Toronto, Toronto, ON, Canada, 2Sunnybrook Research Institute, Toronto, ON, Canada
Synopsis
In this study we investigated subtle features of acute RF ablation lesions using co-registered MR images and electroanatomic voltage maps (EAVM) acquired under MR guidance. Of particular interest was the relationship between the extent of edema detected in T2 maps and altered electrical activity surrounding the ablation site. The results from this study aim to elucidate mechanisms of high ventricular arrhythmia recurrence rates after successful RF ablation therapy, which may be driven by transient conduction block produced acutely by edema.
Introduction
Although radiofrequency (RF) ablation is a potentially effective curative therapy for arrhythmia in patients with structural heart disease, the current success rate is low. For instance, in one cohort, 37% of acutely successful RF ablation procedures for ventricular tachycardia resulted in recurrence with a 12±3-month follow-up1. Typically, thermal ablation creates a permanent necrotic core surrounded by a region of edematous myocardium2, where tissue electrical excitability is suspected to be partially reversible3. We predict that edema may cause a disturbance to excitability that could confound acute clinical measures of procedural success.
To better understand the mechanism causing the appearance of acute success in such cases, here we specifically studied the MR properties of RF ablation lesions and co-registered electroanatomic voltage maps (EAVM) acquired during MR-guided electrophysiology (EP) studies in a pre-clinical model.
Methods
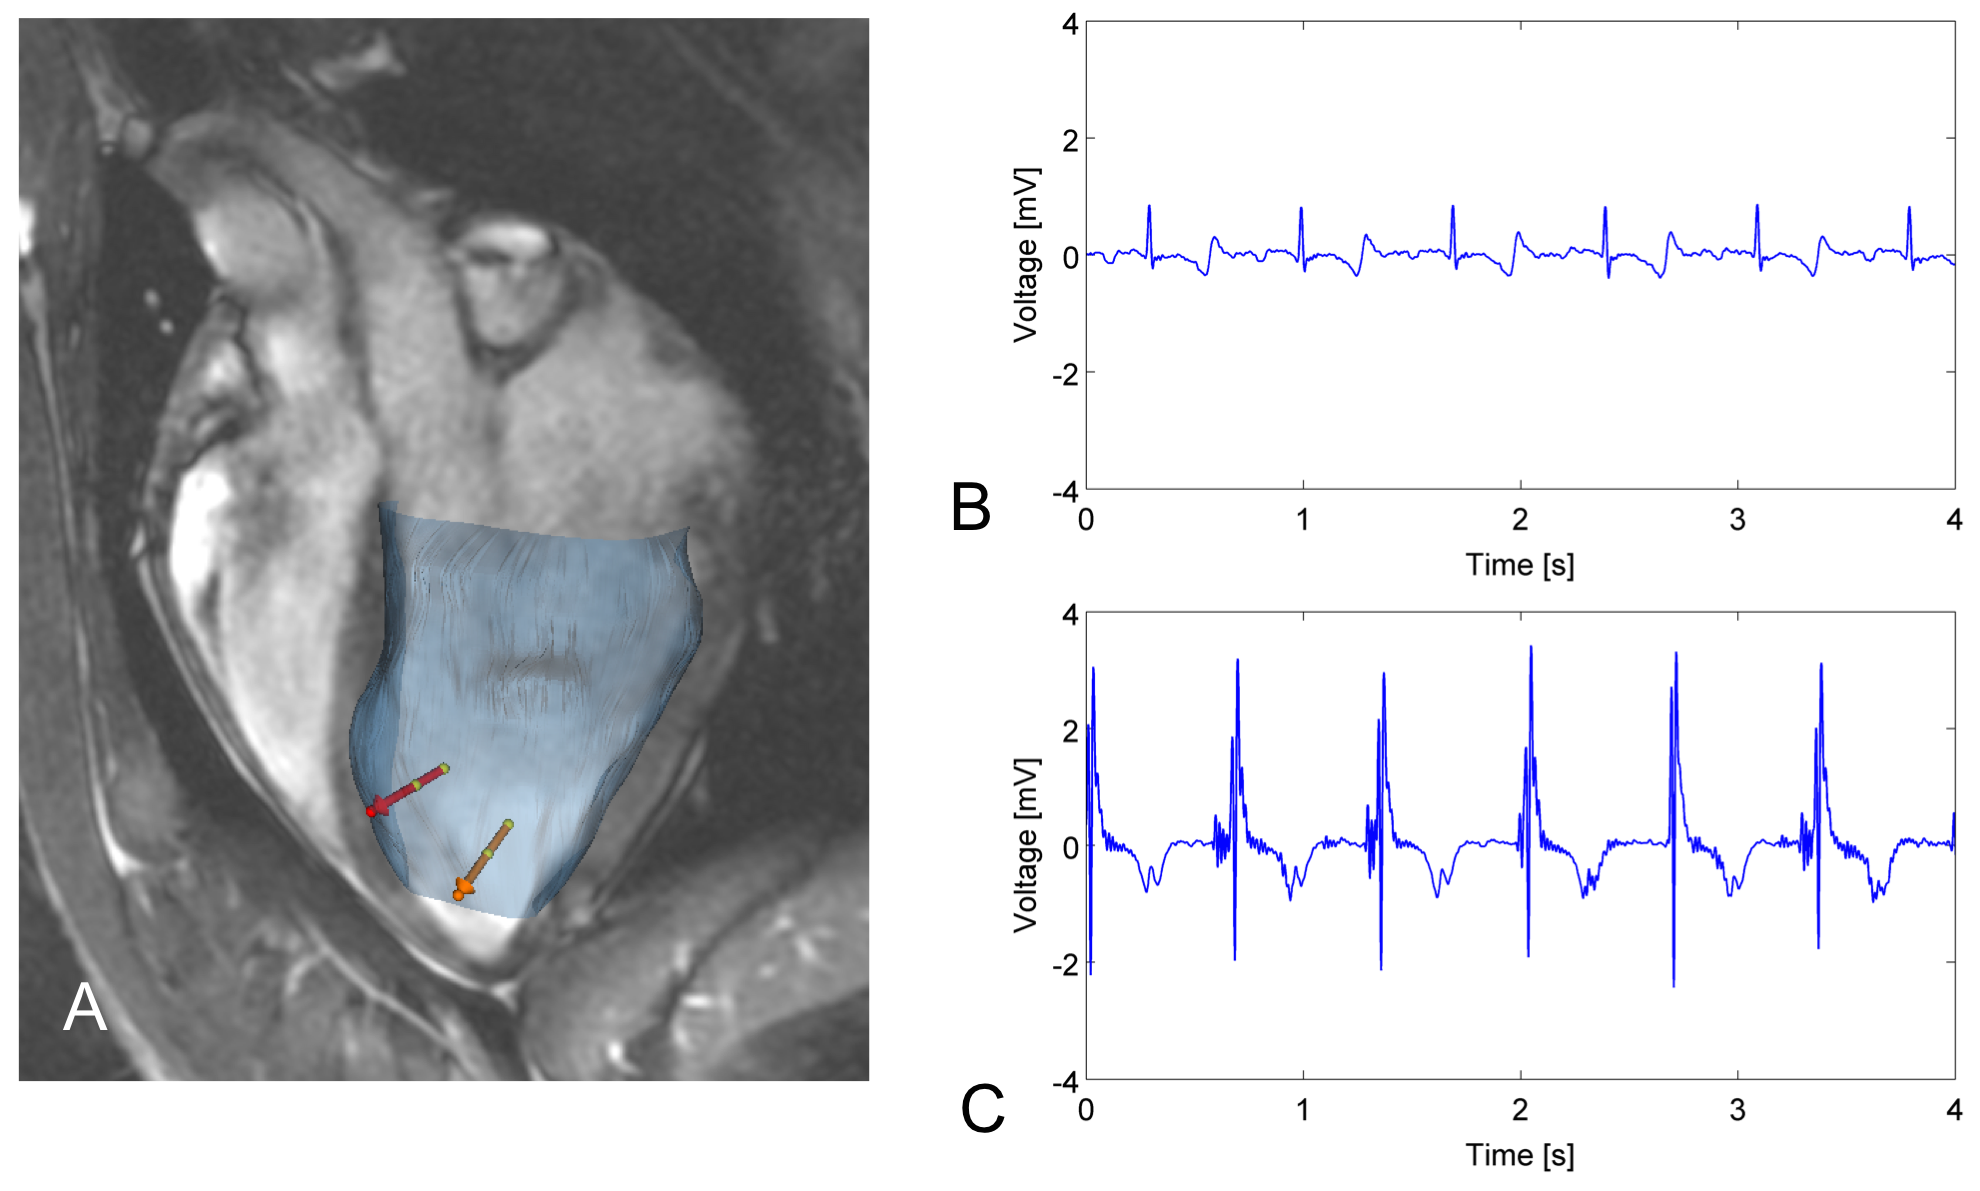
MR-guided RF ablation was performed in the left ventricles (LV) of 3 healthy swine, which remained within the 1.5T wide-bore scanner (MR450w, GE Healthcare) throughout the entire experiment. We used the GE FIESTA sequence (slice thickness=6mm, TE/TR=2.0/5.8ms, FOV=240mm, matrix=192x160), to generate an anatomical roadmap for the ablation procedure. A Vision-MR catheter (9F, Imricor Medical Systems) was actively tracked using the projection method4 (23.4 frames per second, flip angle=5°, FOV=60cm, resolution=1.2x1.2mm) as it was navigated into the LV. We displayed the roadmap images and real-time updated catheter position simultaneously during the catheter navigation in VURTIGO5 (Figure 1A).
RF ablation was performed by delivering 30W for 60-100s with irrigation, and was immediately followed by lesion visualization using two primary imaging sequences. These included IR-prepared SSFP6 (FOV=240mm, matrix=192x160, slice thickness=6mm, TE/TR=2.0/5.8ms), which yielded 40 images at variable TIs across 2R-R intervals, and was performed to visualize the extent of lesion necrotic cores evident due to a shortened T17. Additionally, a T2-prepared spiral sequence was repeated at 4 TEs (10 interleaves, 3072 points, FOV=240mm, effective in-plane resolution=1.3x1.3mm, slice thickness=6mm, TE=2.9-184.2ms, TR=2R-R intervals) in order to generate T2 maps, which were used to measure the extent of edema indicated by elevated T2.
After the imaging study was completed, approximately 1.5-2h after ablation, the catheter was re-introduced to the heart to electrically probe the LV endocardium. Each recording was associated with a bipolar intracardiac electrogram (EGM, see Figure 1), catheter tip location, and physiological data (cardiac and respiratory phases). EAVM analysis and measurement of the lesion cores and edematous regions was done retrospectively.
Results & Discussion
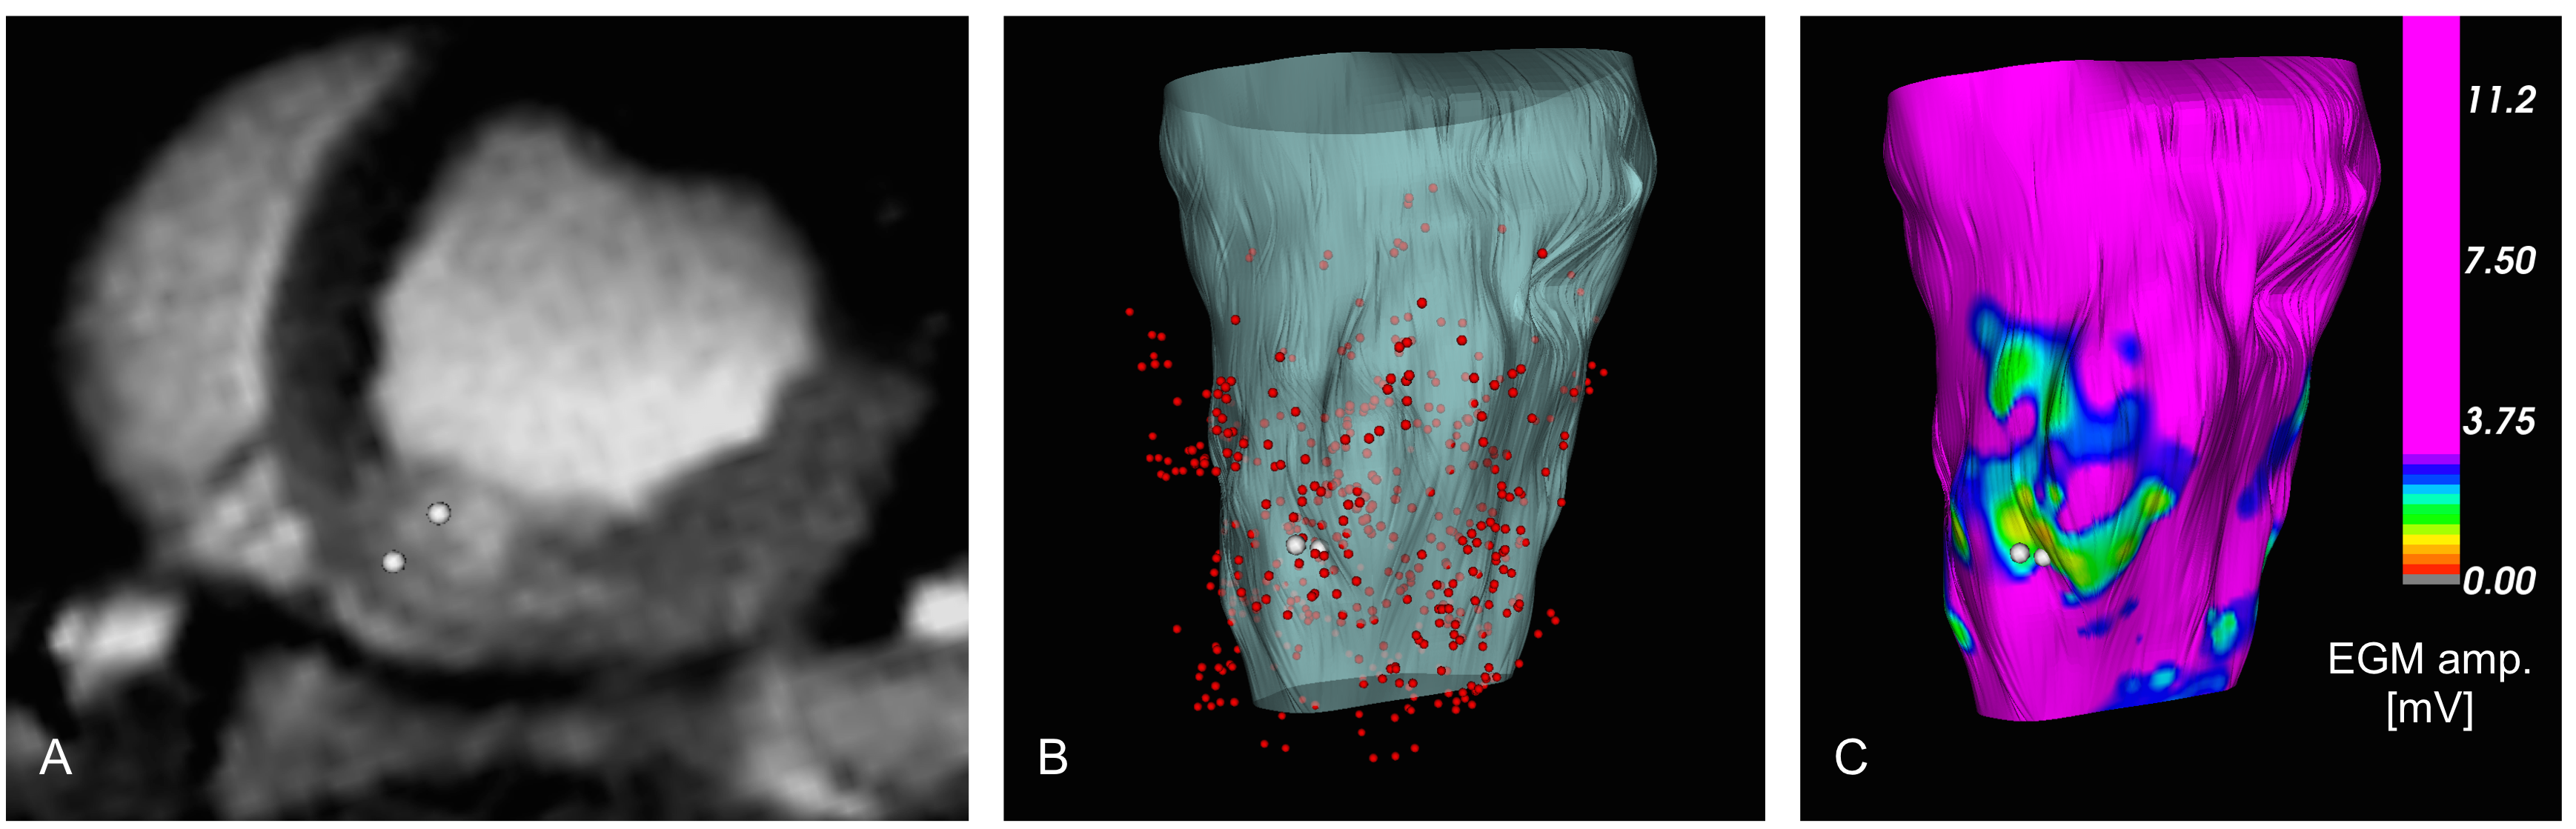
We obtained 3 co-registered MRI and EAVM datasets describing 3 lesions. EAVMs were composed of 25-116 recordings each. At each ablation site and the surrounding tissue, we observed the presence of edema as regions of elevated T2 as well as reduced electrical excitability indicated by low EGM amplitude (Figure 2).
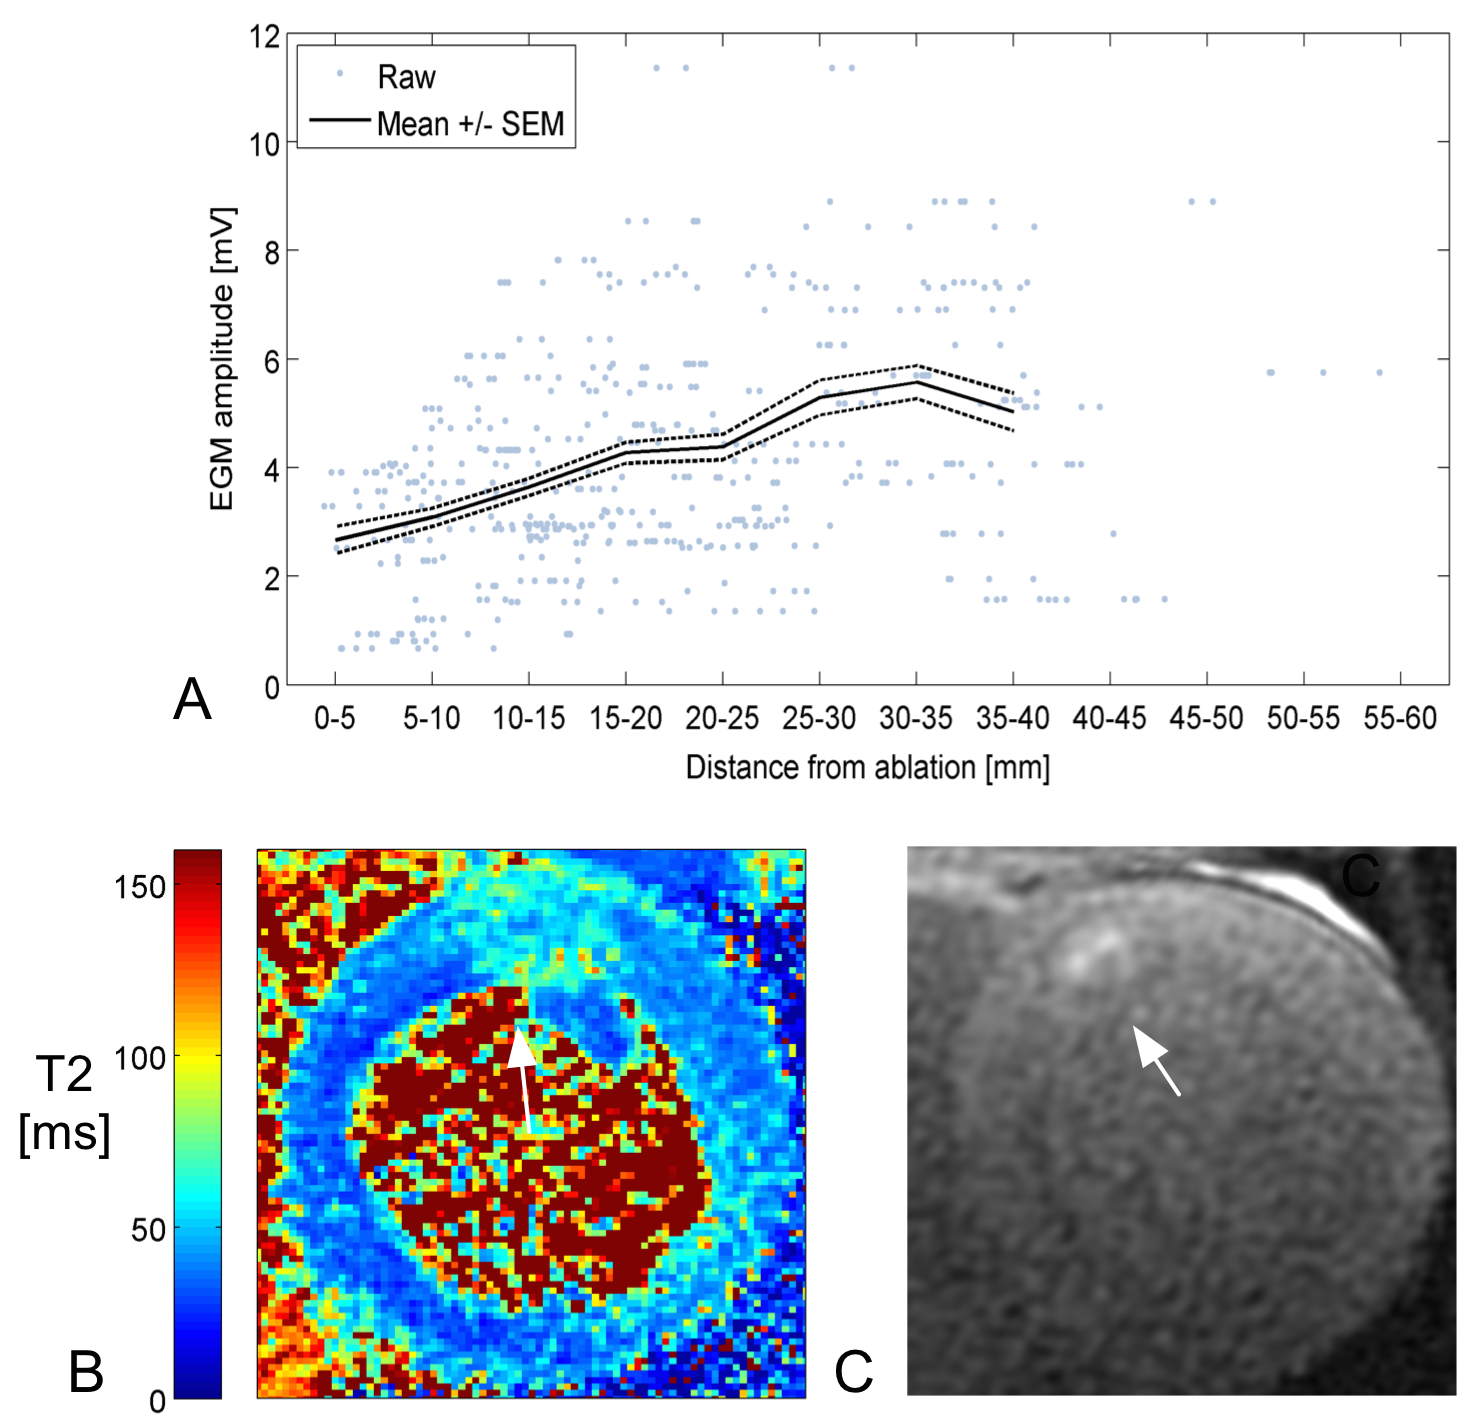
EGM amplitude is considered a key marker of myocardial electrical excitability, and in all cases EGM amplitude increased with distance away from the ablation (Figure 3A). This trend indicates the presence of a transition zone between the centre of the ablation lesion and tissue with normal excitability.
The maximum core diameter among the 3 lesions was 5±5mm (one was not detectable), while the maximum edema diameter was much larger at 24±4mm (e.g., Figures 3B-C). The regions of reduced excitability extended to approximately 10-15mm, 20-25mm, and 30-35mm away from the ablation position, respectively. These extents were more comparable to the corresponding diameters of edematous tissue, which suggests that edema contributes to the broad reduction in excitability (well beyond the size of lesion core), in congruence with our hypothesis.
Additional factors that may affect this comparison are the T2 thresholds selected to compute segmented edematous tissue volumes and the sensitive volume of the mapping catheter electrodes (with radius estimated at 6mm8), causing a partial volume effect to the spatial distribution of electrical measurements.
Conclusion
We successfully demonstrated the MR characteristics of RF lesions relate to subtle features of electrical activity near the ablation sites. In particular, we focused on areas which sustained injury including necrosis and development of edema. The use of MRI visualization post-ablation, combined with knowledge of the relationship to electrical properties of the myocardium, may in future cases shed greater light on the factors that currently affect RF ablation procedural success.Acknowledgements
No acknowledgement found.References
1. Tanner H, Hindricks G, Volkmer M, et al. Catheter Ablation of Recurrent Scar-Related Ventricular Tachycardia Using Electroanatomical Mapping and Irrigated Ablation Technology: Results of the Prospective Multicenter Euro-VT-Study. J Cardiovasc Electrophysiol. 2010;21:47-53.
2. Knowles BR, Caulfield D, Cooklin M, et al. 3-D visualization of acute RF ablation lesions using MRI for the simultaneous determination of the patterns of necrosis and edema. IEEE TBME. 2010;57(6):1467-1475.
3. Harrison JL, Jensen HK, Peel SA, et al. Cardiac magnetic resonance and electroanatomical mapping of acute and chronic atrial ablation injury: a histological validation study. Eur Heart J. 2014;1-10.
4. Dumoulin CL, Souza SP, Darrow RD. Real-time position monitoring of invasive devices using magnetic resonance. MRM. 1993;29(3):411-415.
5. Radau PE, Pintilie S, Flor R, et al. VURTIGO: Visualization Platform for Real-Time, MRI-Guided Cardiac Electroanatomic Mapping, 2012. Berlin, Germany: Statistical Atlases and Computational Models of the Heart: Imaging and Modelling Challenges.
6. Detsky JS, Stainsby JA, Vijayaraghavan R, Graham JJ, Dick AJ, Wright GA. Inversion-recovery-prepared SSFP for cardiac-phase-resolved delayed-enhancement MRI. MRM. 2007;58(2):365-372.
7. Celik H, Ramanan V, Barry J, et al. Intrinsic contrast for characterization of acute radiofrequency ablation lesions. Circ Arrhythm Electrophysiol. 2014;7(4):718-727.
8. Oduneye SO, Pop M, Biswas L, et al. Post-Infarction Ventricular Tachycardia Substrate Characterization: A Comparison Between Late Enhancement Magnetic Resonance Imaging And Voltage Mapping Using a MR-Guided Electrophysiology System. IEEE TBME. 2013;60(9).
Figures