1175
Ultrashort Echo-Time Imaging based Skull Density Ratio Assessment for Transcranial MR guided Focused Ultrasound1Department of Diagnostic Radiology & Nuclear Medicine, University of Maryland School of Medicine, Baltimore, MD, United States
Synopsis
Transcranial MRI-guided focused ultrasound (tcMRgFUS) applications have been growing steadily on treatment of brain diseases. Typically a CT skull scan is used with the MR scan to perform treatment planning in tcMRgFUS procedures. In this study we examine the use of ultrashort echo time imaging to perform the skull imaging and assess the feasibility of using the information from MRI to perform treatment planning through acoustic and temperature modeling with skull characteristics generated from UTE imaging. We further compared the simulation results with existing data from tcMRgFUS treatment of essential tremor procedure that used CT images of the skull for treatment planning. We demonstrated that UTE based treatment planning is feasible and avoids the use of CT based images thus avoiding unnecessary radiation exposure.
Introduction
Transcranial MRI-guided focused ultrasound (tcMRgFUS) applications have been growing steadily including treatment of various movement disorders such as essential tremors and Parkinson's, blood-brain barrier opening, tumor ablation and non-invasive neuromodulation. A key barrier to effective transmission of ultrasonic power is the skull. Typically a CT bone scan is used with the MR scan to perform treatment planning in tcMRgFUS procedures. In this study we examine the use of ultrashort echo time (UTE) imaging to image the skull and assess the feasibility of using the information from MR to perform treatment planning through acoustic and temperature modeling with skull characteristics generated from UTE imaging. We further compared the simulation results with existing data from tcMRgFUS treatment of essential tremor procedure that used CT images of the skull for treatment planning.Methods
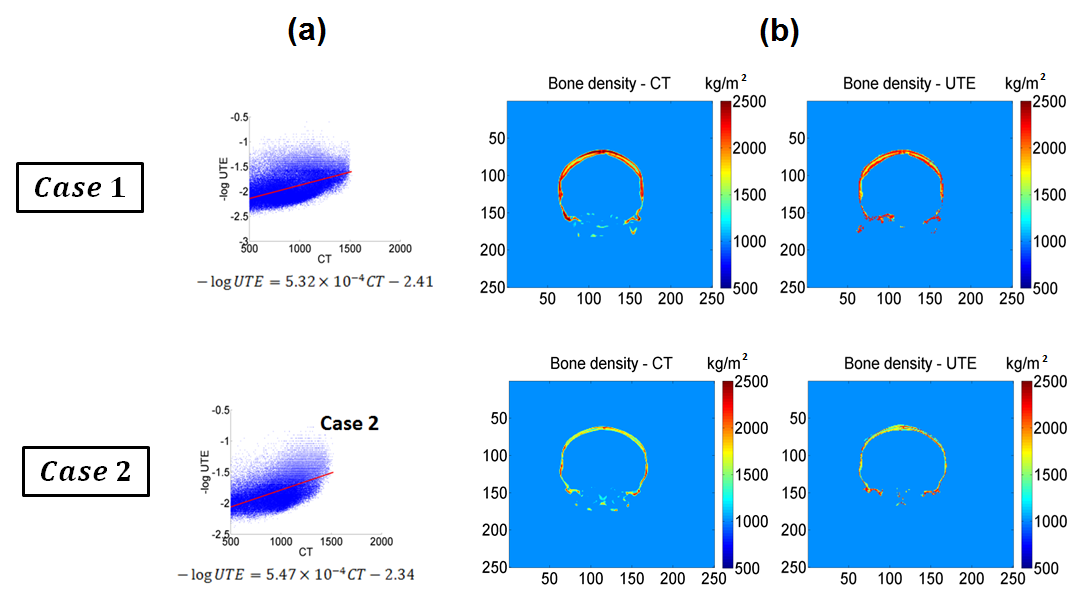
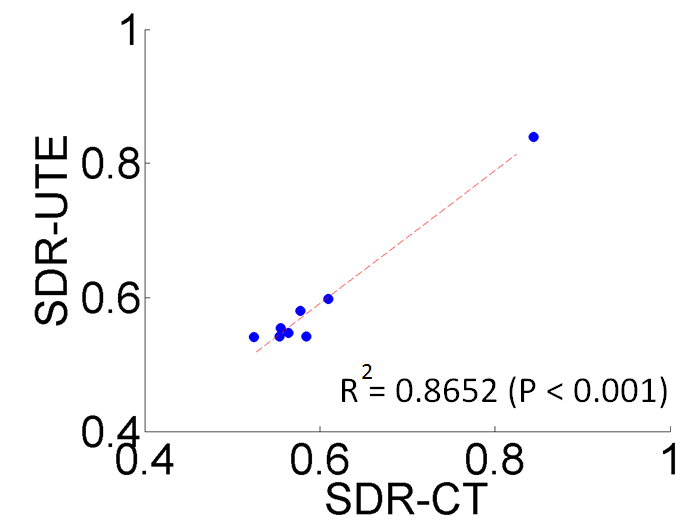
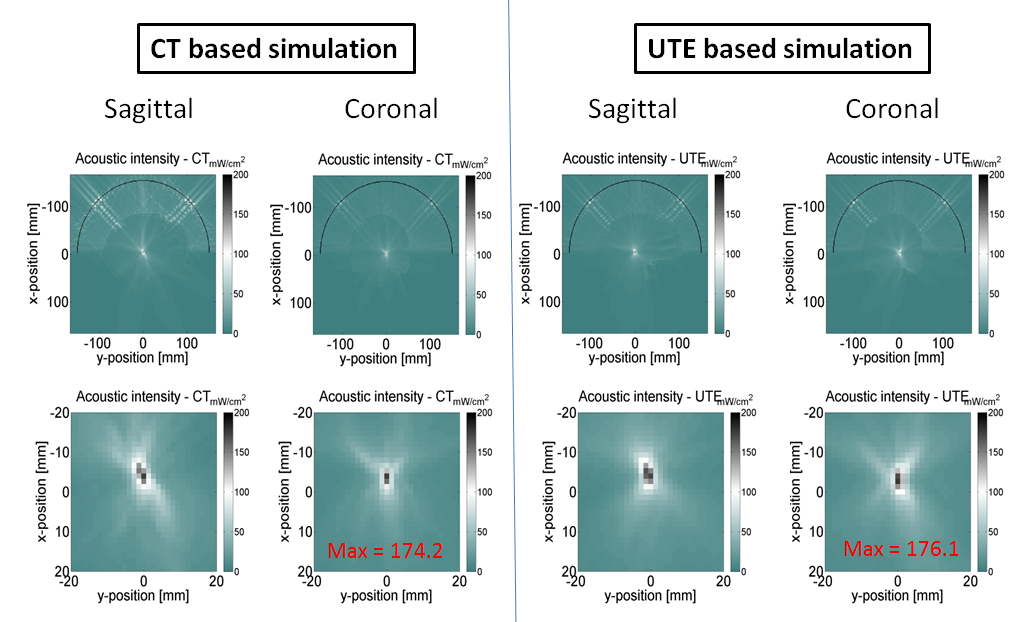
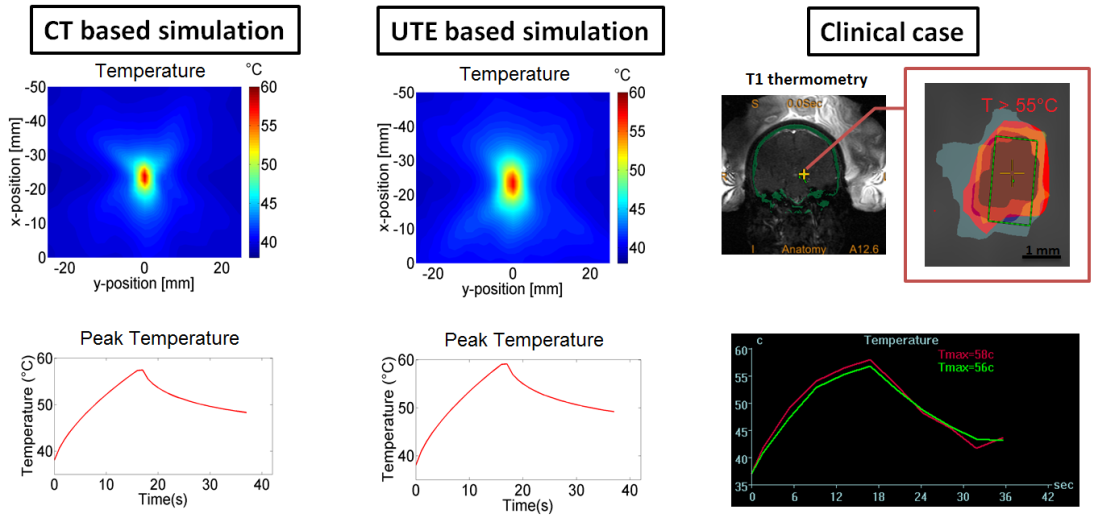
UTE and CT acquirement: MR brain images were obtained on a Siemens 3T Tim Trio scanner. 3D radial UTE images were acquired with two echoes (TE1/TE2 = 0.07ms/4ms, TR = 5ms, voxel size = 1.3×1.3×1.3mm3, flip angle = 5⁰, base resolution = 192x192x192, radial views =60000). CT head images were obtained on a 64-slice Philips Brilliance CT scanner. UTE and CT comparison: To establish a relationship between the UTE intensity and CT intensity, the UTE intensity was first converted to a log scaling to be in line with the way CT images are scaled for Hounsfield units. A relationship between the scaled UTE image intensity and the CT Hounsfield units was determined by correlating the pixel-by-pixel values from each of these modalities. We compared the Skull density ratio (SDR), an important factor typically used to evaluate the efficiency of ultrasound transmission through skull, from both the CT and scaled UTE images in 8 clinical cases. SDR is defined as the minimum CT image intensity (Hounsfield units) divided by maximum image intensity along a ray trajectory that passes from the ultrasound transducer to the target location in the brain through the skull. Scaled UTE and CT intensity was converted to acoustic properties (density, sound speed and attenuation coefficient) according to previous work2. Temperature model: A non-linear acoustic model was employed to simulate the acoustic field by solving the full Westervelt equation3 assuming the setup of a 1024-element ultrasound transducer from ExAblate 4000 (Insightec, Israel). Temperature simulation was estimated by solving the inhomogeneous Pennes equation of heat conduction4. CT-based and UTE-based simulation results were compared for focal spot location and the pattern of temperature rise. This model was further validated using the data from patients that were previously treated with tcMRgFUS.Results and discussions
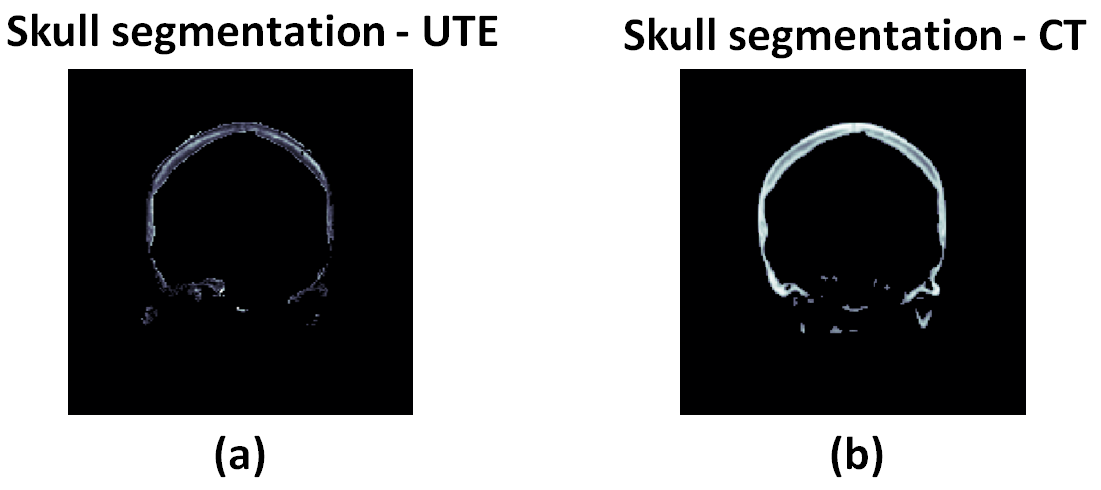
Figure 1 shows skull intensity from UTE and CT images.The first echo of the UTE image shows good contrast between cortical and trabecular bones, mimicking an inverted CT contrast. The relationship between UTE and CT image intensities is shown for two subjects in Fig 2a. Figure 2b shows the bone density map calculated from CT and UTE respectively. Strong correlation (R2=0.8652 with P <0.001) was found between CT-based and UTE-based average SDR from the eight cases that were examined (Fig.3). Figure 4 shows the acoustic simulation results for case 1 using both CT based and UTE based skull characteristics. The maximum acoustic intensities at the focal spot was found to be very similar between the two modalities, and the focal spots were also similar both in the sagittal and coronal planes. Temperature simulation results based on the simulated acoustic intensity field are presented in Figure 5. The predicted temperature change pattern from UTE based images was similar to the CT-based simulation and both were comparable with the recorded temperature during actual treatment (within 1-2 oC).Conclusions
In this study, we explored UTE imaging as a possible replacement for CT images to account for acoustic attenuation during tcMRgFUS procedures. The feasibility of segmenting the UTE images to arrive at a skull mask whose pixel intensities correlate with the Hounsfield units from CT images was demonstrated. Furthermore, simulation using the UTE bone images provided similar acoustic fields and resulted in a comparable focal spot as those obtained from CT based bone images. An MR based SDR was calculated which had a high correlation with the CT based SDR estimation. Finally, thermal simulations also demonstrated that similar pattern of heating can be observed with UTE based treatments. Taken together we have demonstrated that UTE based treatment planning is feasible and avoids the use of CT based images thus avoiding unnecessary radiation exposure. However, prior to embarking on UTE based tcMRgFUS planning, rigorous testing of the robustness of UTE must be performed.Acknowledgements
No acknowledgement found.References
1. Wiesinger F, Sacolick L, Menini A,et al. Zero TE MR bone imaging in the head. Magnetic Resonance in Medicine. 2015;75(1).
2. Aubry J, Tanter M, Gerber J, et al. Optimal focusing by spatio-temporal inverse filter: part II. Experiments. J. Acoust. Soc. Am. 2001;110(48).
3. Hamilton M, Blackstock D. Nonlinear Acoustics. Academic Press; 1998.
4. Pennes H. Analysis of tissue and arterial temperature in the resting human forearm. J. Appl. Physiol. 1948;1(2).
Figures