1174
Estimating Acoustic Velocity of Human Skull Bone with CT and MRI1Electrical Engineering, Stanford University, Stanford, CA, United States, 2Bionengineering, Stanford University, Stanford, CA, United States, 3Radiology, Stanford University, Stanford, CA, United States
Synopsis
Focusing of transcranial focused ultrasound requires knowledge of the speed of sound in the skull. Clinically, estimates of the speed of sound in the skull are obtained from a CT scan. We measure the acoustic velocity in several human skull fragments and correlate it to the average Hounsfield units, MR-Simulated-CT value (derived from an ultrashort echo time MR sequence), and R2* value of each fragment. Results show that both CT and MR can be used to accurately estimate the acoustic velocity in human skull bone and that replacing CT with MR to plan transcranial FUS treatments is feasible.
Introduction
Transcranial focused ultrasound (FUS) has shown great potential as a treatment modality for various neuropathologies, including Parkinsonian tremor[1]–[3] and essential tremor[4].
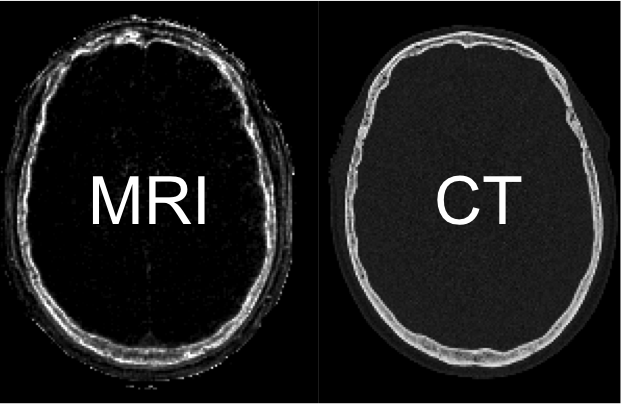
Focusing ultrasound through the skull requires making an assumption about the acoustic velocity in each tissue between transducer elements and the focal spot. Clinically the velocity is estimated with a CT scan but recently there has been interest in using ultra short echo time (UTE) MRI [5], [6]. Johnson et al [5] suggested a UTE derived metric called MR-Simulated-CT which is well correlated to HU (see Figure 1).
In this work we measure the predictive value of CT, MR-Simulated-CT, and R2* by correlating them with acoustic velocity. Our results show that using MR to plan transcranial FUS treatments is feasible.
Methods
Sample Preparation
An ex-vivo dried human skull (60 year old male) was acquired from Skulls Unlimited. Samples were generated by removing 0.5 inch diameter bores at various locations with a hole saw. The inner and outer tables were separated from the diploe and the samples were sanded in order to achieve flat and parallel interfaces. In order to more closely approximate in-vivo conditions, all fragments were degassed overnight before measurements were performed.
Imaging
CT images were obtained with a clinical CT scanner (GE, 0.49 mm in plane, 1.25 mm slice thickness, soft tissue filter). UTE images (GE, 3T, 0.75 mm isotropic resolution) were acquired using the sequence developed by Johnson et al [5]. A similar sequence (0.75 mm isotropic resolution) with altered echo times was used to estimate R2* by fitting the decay in the first three echoes (0.034, 0.234, and 0.534 ms) of the sequence. Each fragment was individually segmented and a region of interest within the fragment was used to compute the average HU, MR-Simulated-CT value, and R2*. The region of interest for each fragment was selected to be just smaller than the fragment itself in order to avoid partial voluming effects.
Acoustic Velocity Measurements
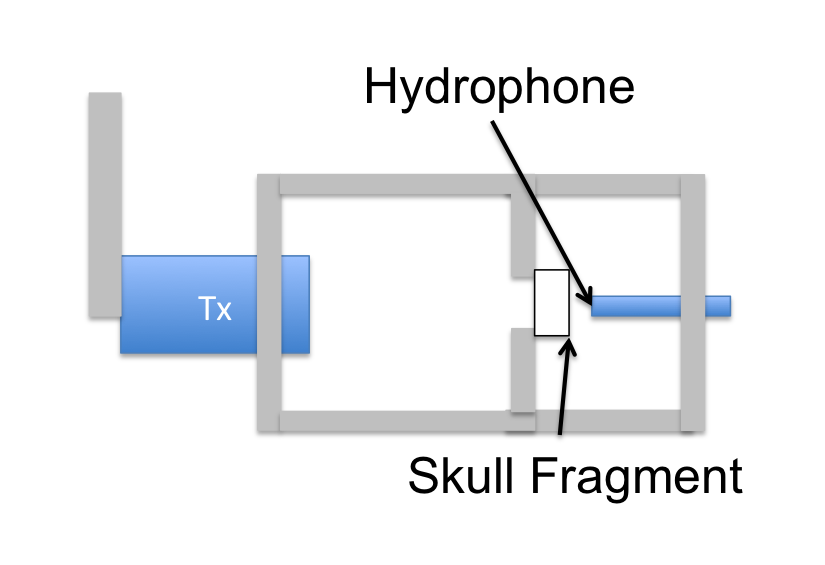
The speed of sound was estimated by measuring the arrival time of a short pulse with and without the bone fragment present. Figure 2 shows the experimental setup. An aluminum frame was constructed to hold the bone at the focal spot of the transducer. An acoustic pulse was generated by a single element Olympus transducer operating at 500 kHz. The transducer was driven for a single cycle by a function generator connected to an RF amplifier. The focal distance and aperture of the transducer were 1.5 inches and 1 inch respectively. A hydrophone (Onda HNR 0400) was placed just beyond the focal spot of the transducer to capture the transmitted signal. Each measurement was repeated three times. If the measured velocity varied by more than 100 m/s the result was discarded.
Results
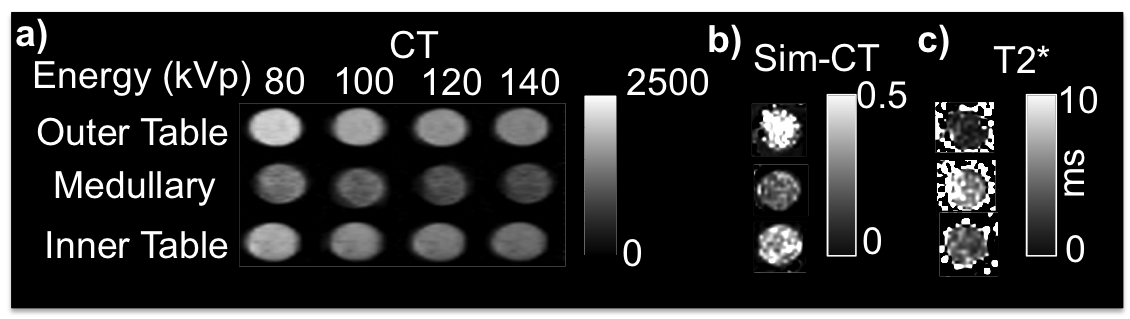
Figure 3 shows images of a fragment from the outer table, diploe, and the inner table. Figure 3a shows CT images at four different energies with a clear decrease in the average HU of the fragment as the energy increases. Figures 3b and 3c show MR-simulated-CT and R2* images of the same fragments.
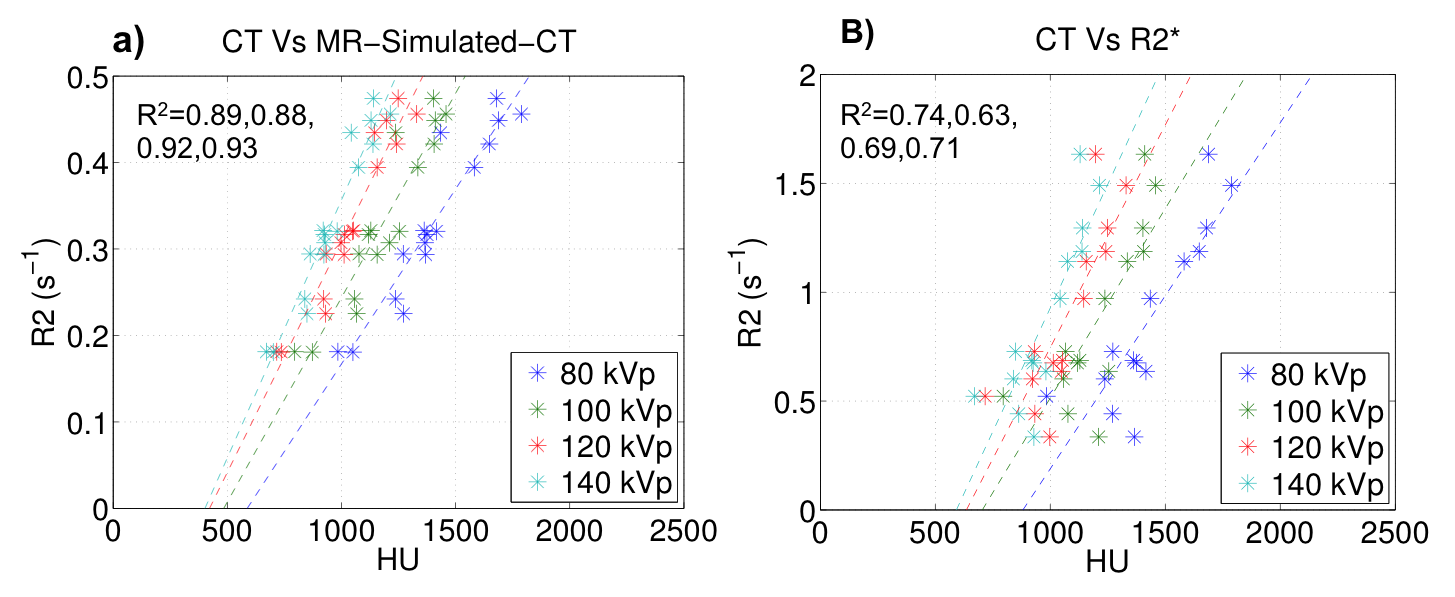
Figure 4 compares the average HU of each fragment to the average MR-Simulated-CT and average R2*. The R-squared values for the correlation between MR-Simulated-CT and HUs are comparable to those presented in [5].
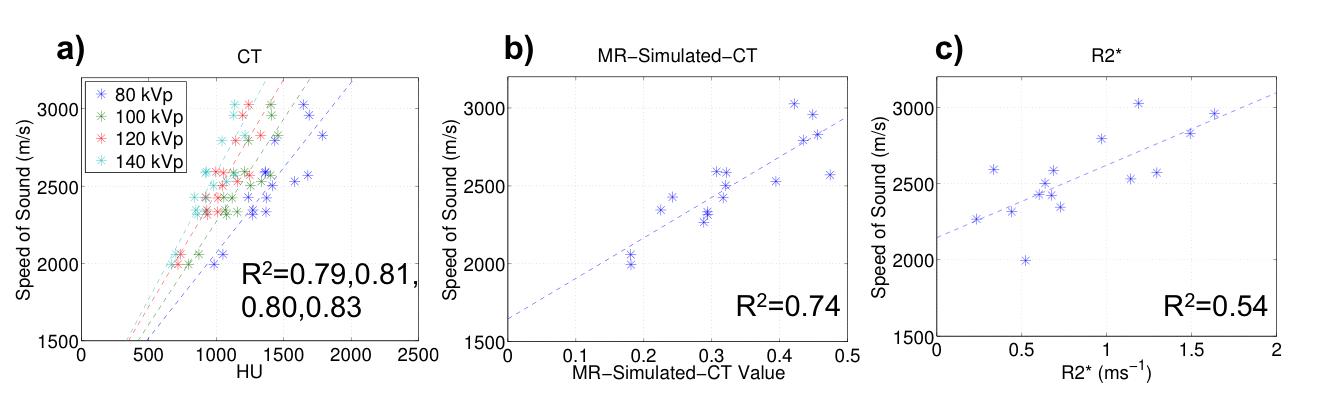
Figure 5 shows the measured speed of sound plotted as a function of HUs, MR-Simulated-CT, and R2*. The data show that the predictive capacity of MR-Simulated-CT approaches that of CT with R2* showing less correlation.
Discussion
The data provide strong evidence that MR UTE is capable of estimating the acoustic velocity with a predictive capacity similar to that of CT, suggesting that replacing CT with MR in transcranial FUS treatments is feasible. The data also show the importance of accounting for the CT energy when converting from HU to acoustic velocity.
Though the correlation between R2* and acoustic velocity is weaker, our data still show a reasonably strong relationship. This could be a result of the dependence of R2* on magnetic susceptibility which varies with the fractional bone volume and pore size of each fragment. Further work should continue to examine these relationships for additional information that can improve estimates of acoustic velocity.
Conclusion
We have shown that CT and MR-Simulated-CT can predict the acoustic velocity of human skull bone and that MR-Simulated-CT has a similar predictive power to CT, making it feasible to replace CT with MR in FUS treatments.Acknowledgements
R01 MH111825, PO1 CA159992References
[1] W. J. Fry, “Applications Jiomedicine *,” in Proceedings of the IRE, 1962, pp. 1393–1404.
[2] A. Magara, R. Bühler, D. Moser, M. Kowalski, P. Pourtehrani, and D. Jeanmonod, “First experience with MR-guided focused ultrasound in the treatment of Parkinson’s disease,” J. Ther. Ultrasound, vol. 2, no. 11, pp. 1–8, 2014.
[3] Y. C. Na, W. S. Chang, H. H. Jung, E. J. Kweon, and J. W. Chang, “Unilateral Magnetic Resonance-Guided Focused Ultrasound Pallidotomy For Parkinson Disease,” Neurology, vol. 85, no. 6, pp. 549–552, 2015.
[4] W. J. Elias, D. Huss, T. Voss, J. Loomba, M. Khaled, E. Zadicario, R. C. Frysinger, S. a Sperling, S. Wylie, S. J. Monteith, J. Druzgal, B. B. Shah, M. Harrison, and M. Wintermark, “A pilot study of focused ultrasound thalamotomy for essential tremor.,” N. Engl. J. Med., vol. 369, pp. 640–8, 2013.
[5] E. M. Johnson, U. Vyas, P. Ghanouni, K. B. Pauly, and J. M. Pauly, “Improved Cortical Bone Specificity in UTE MR Imaging,” Magn. Reson. Med., vol. In Press, pp. 1–12, 2016.
[6] G. W. Miller, M. Eames, J. Snell, and J. Aubry, “Ultrashort echo-time MRI versus CT for skull aberration correction in MR-guided transcranial focused ultrasound?: In vitro comparison on human calvaria,” Med. Phys., vol. 42, no. 5, pp. 2223–2233, 2015.
Figures