1173
MR guided High Intensity Focused Ultrasound for treating painful bone metastases: relating intra-procedural ADC changes and thermal dose to volume of ablated tissue1CRUK Cancer Imaging Centre, Institute of Cancer Research, London, United Kingdom, 2CRUK Cancer Imaging Centre, Royal Marsden Hospital, London, United Kingdom, 3Pain Management Team, Department of Anaesthetics, Royal Marsden Hospital, 4Therapeutic Ultrasound, Institute of Cancer Research, London, United Kingdom
Synopsis
Thermal dose estimates and apparent diffusion coefficient (ADC) changes during MR-guided High Intensity Focused Ultrasound of painful bone metastases (n=11) were correlated with ablated tissue volumes assessed on Gd-T1W imaging acquired immediately, and at 30 days post-treatment. Thermal dose volume and mean maximum temperature were estimated from proton resonance frequency shift thermometry. Ablated tissue volume did not change significantly over 30 days. Mean maximum temperature and thermal dose volume were significant indicators of ablated volume, and mean maximum temperature was significantly higher in those with enduring ADC changes at Day 30. Further work will relate imaging changes to pain outcomes.
Background
Although efficacy of MR guided High Intensity Focused Ultrasound (MRgHIFU) treatment for painful bone metastases is assessed clinically using pain scores, post-treatment Gadolinium (Gd) contrast-enhanced imaging can also be used to assess outcome by defining the volume of tissue ablated1. However, as contrast cannot be given during HIFU2, other techniques, such as diffusion-weighted imaging (DWI), may be exploited intra-procedurally to recognize changes indicative of effective treatment3. In addition, proton resonance frequency shift (PRFS) thermometry sequences provide intra-procedural information on whether tissue temperature is sufficiently elevated (>55oC) to induce ablation4. However, intra-procedural DWI and PRFS changes have not been correlated with the volume of extra-osseous tissue ablation when treating bone metastases with MRgHIFU.Purpose
To correlate tissue temperature and thermal dose dimensions from PRFS (acquired during MRgHIFU bone treatments) and intra-procedural changes in apparent diffusion coefficient (ADC) with ablated extra-osseous tissue volumes estimated on post-treatment contrast-enhanced scans.Methods
Patients: Palliative MRgHIFU treatments were delivered under sedation to 12 painful bone metastases in 11 patients using a 3T Achieva MR/Sonalleve HIFU clinical system (Philips Healthcare, Vantaa, Finland). Treatment was planned and delivered on a patient and lesion specific basis using cell sizes 4-12mm in diameter.
Imaging: Images were acquired using HIFU window and pelvic coils in combination. 3D T1W imaging was exported to the Sonalleve for treatment planning. PRFS thermometry was performed before, during and after each sonication to evaluate temperature change. DWI was acquired before sonication in 10 patients, and re-acquired during intra-procedural post-sonication cooling periods, and immediately post-treatment in n=9 in whom artefacts did not degrade imaging. b-values used were 0,100,700 s/mm2. On completion of treatments, 3D T1W-THRIVE images (TR 5.4 ms, TE 2.6 ms, FA 120, SPAIR fat suppression) were obtained after 2ml/kg Gd-chelate injection. Follow-up in n=10 recorded DWI and post-Gd data at Day 30 after treatment.
Analysis: For each sonication, thermal dose volume (V240EM) was estimated as the product of 3 orthogonal measured maximum dimensions of the 240 equivalent minutes (EM) dose contour. Maximum temperature recorded in the target region during each sonication was used to calculate mean maximum temperature (TM) for each patient. Regions of interest (ROI) were drawn around non-perfused extra-osseous tissue regions on every slice they were seen on immediate post-treatment and Day 30 Gd-enhanced images as regions of non-enhancement. Ablation volume (VTHRIVE) was calculated from the product of totalled ROI areas and slice thickness. In n=6, ROIs were drawn on ADC maps (calculated from a Levenberg-Marquardt least squares fit to the b=100 & 700 s/mm2 data) in extra-osseous tissue regions that showed heating on PRFS. ADC changes were considered relevant if above the 95% Limits of Agreement (LoA) from prior established repeatability estimates (Coefficient of Variation:5.1%, 95% LoA:10.6%, -9.6%)5. Statistical analyses were undertaken using parametric tests following log-transformation of the non-normally distributed VTHRIVE and V240EM data.
Results
TM and V240EM were estimated for 11 lesions in 10 patients. Failure of fat suppression during PRFS compromised these data in 1 patient in whom VTHRIVE was also not measured due to considerable extra-osseous tumour extension. A second patient was excluded from THRIVE analyses due to confounding appearances after a subcutaneous injection of saline was administered to enable treatment of a superficial rib lesion. VTHRIVE data were therefore estimated for 10 lesions in 9 patients (Table 1).
VTHRIVE measurements were not different between immediate and 30-day post-treatment assessments, (3.84±5.53 cm3 and 3.55±5.15 cm3 respectively, p=0.84). There was a significant correlation between TM and V240EM (r=0.80, p=0.003), which were each significantly correlated with VTHRIVE immediately and 30 days post-treatment (TM and VTHRIVE: r=0.78 and p=0.02 at both time-points; V240EM and VTHRIVE: r=0.86, p=0.006 and r=0.73, p=0.04 respectively).
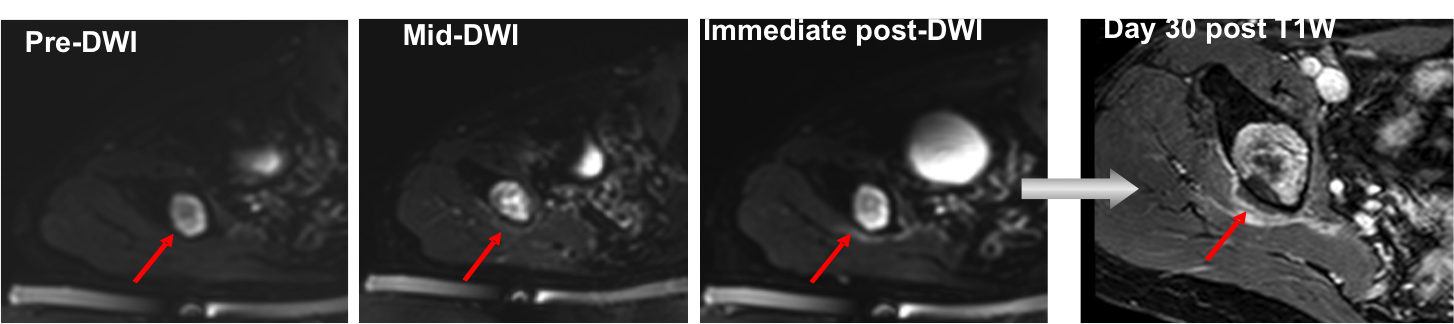
Post-treatment mean ADC increased significantly from pre-treatment values across the cohort of assessable patients (n=6, p=0.03). Intra-procedural changes above 95% LoA were seen in 4/6 patients, maintained after treatment in n=3, and at Day 30 in n=2 (Figure 1). TM was lowest in 2 patients without intra-procedural ADC changes, and was significantly higher in those with >repeatability changes that endured at Day 30 (p=0.002). Differences in V240EM did not achieve statistical significance.
Discussion and Conclusion
The volume of ablated extra-osseous tissue seen immediately post-treatment does not change significantly over 30 days. Estimates of TM and V240EM are significant indicators of subsequent ablated tissue volume, and can be acquired between sonications. Intra- and post-procedural ADC changes above the 95% LoA are recognizable, and there was a significant relationship with tissue temperature when ADC changes were sustained 30 days after treatment. Further work relating the observed imaging changes to improvement in pain scores is on-going.Acknowledgements
CRUK and EPSRC support to the Cancer Imaging Centre at ICR and RMH in association with MRC & Department of Health C1060/A10334, C1060/A16464 and NHS funding to the NIHR Biomedical Research Centre and the Clinical Research Facility in Imaging. We would also like to acknowledge the support of Philips Healthcare and the Focused Ultrasound FoundationReferences
1. Jolesz, F.A. (2009). “MRI-guided focused ultrasound surgery.” Annu Rev Med 60: 417-30
2. Hijnen, N.M. et al. (2013). “The magnetic susceptibility effect of gadolinium-based contrast agents on PRFS-based MR thermometry during thermal interventions.” J Ther Ultrasound 1:8
3. Chen, J., et al. (2008). “Monitoring prostate thermal therapy with diffusion-weighted MRI.” Magn Reson Med 59(6):1365-72
4. Lam, M.K., et al. (2015). “Quality of MR thermometry during palliative MR-guided high-intensity focused ultrasound (MR-HIFU) treatment of bone metastases.” J Ther Ultrasound 3:5
5. Giles S.L. et al. (2016). “Monitoring tissue damage during MR guided high intensity focused ultrasound of bone metastases: relating intra-procedural diffusion weighted changes to post-procedural image appearances.” Proc ISMRM # 2121
Figures
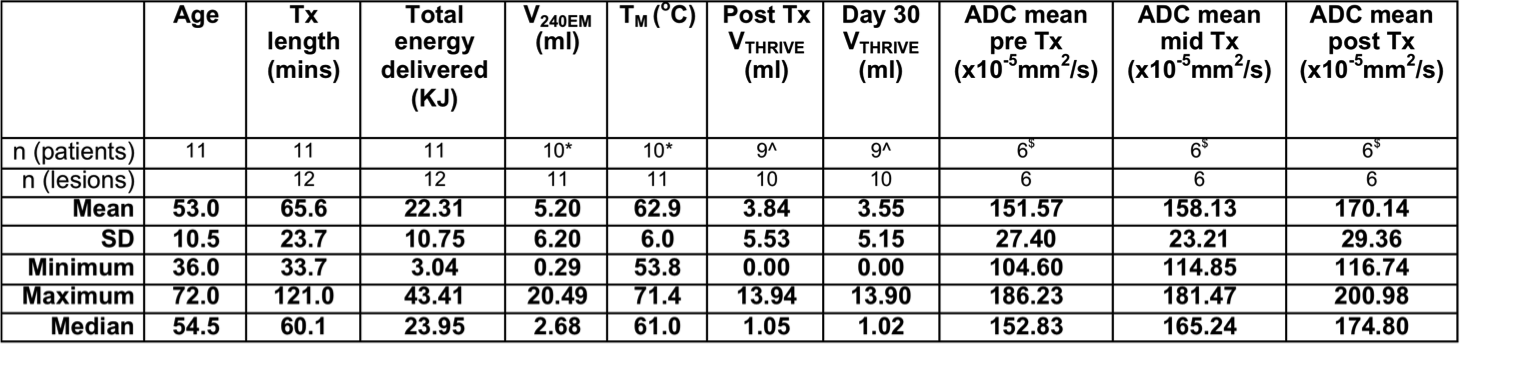
Table 1: Summary of measured treatment (Tx) and imaging parameters
* Failure of fat suppression during PRFS in one lesion in one patient made TM and VTHRIVE unreliable; therefore these data were excluded
^ VTHRIVE was also not measured in this patient due to considerable extra-osseous tumour, or in a 2nd patient due to prior subcutaneous injection of saline
$ ADC analyses were undertaken in n=6 where identical DWI was acquired at every time-point; the patient with prior subcutaneous injection of saline was excluded from analyses